| Param | Original file | Final file |
|---|---|---|
| Filename | modeM0/AS1P01_997T03_9000000216_01145cztM0_level2.evt | modeM0/AS1P01_997T03_9000000216_01145cztM0_level2_quad_clean.evt |
| Size (bytes) | 499,366,080 | 50,725,440 |
| Size | 476.2 MB | 48.4 MB |
| Events in quadrant A | 3,725,038 | 336,295 |
| Events in quadrant B | 3,837,522 | 335,121 |
| Events in quadrant C | 3,769,166 | 314,408 |
| Events in quadrant D | 3,568,261 | 313,649 |
| Mode M0 | |||
|---|---|---|---|
| Quadrant | BADHDUFLAG | Total packets | Discarded packets |
| A | 0 | 13421 | 1 |
| B | 0 | 13737 | 0 |
| C | 0 | 13545 | 0 |
| D | 0 | 12953 | 0 |
| Mode SS | |||
|---|---|---|---|
| Quadrant | BADHDUFLAG | Total packets | Discarded packets |
| A | 0 | 68 | 0 |
| B | 0 | 68 | 0 |
| C | 0 | 68 | 0 |
| D | 0 | 68 | 0 |
| Quadrant | Total seconds | Saturated seconds | Saturation percentage |
|---|---|---|---|
| A | 3326 | 0 | 0.000000% |
| B | 3326 | 4 | 0.120265% |
| C | 3326 | 1 | 0.030066% |
| D | 3326 | 9 | 0.270595% |
Noise dominated data is calculated using 1-second bins in cleaned event files. If a bin has >2000 counts, and if more than 50% of those come from <1% of pixels, then it is considered to be noise-dominated and hence unusable.
| Quadrant | # 1 sec bins | Bins with >0 counts | Bins with >2000 counts | High rate bins dominated by noise | Noise dominated (total time) | Noise dominated (detector-on time) | Marked lightcurve |
|---|---|---|---|---|---|---|---|
| A | 3326 | 3326 | 18 | 18 | 0.54% | 0.54% | 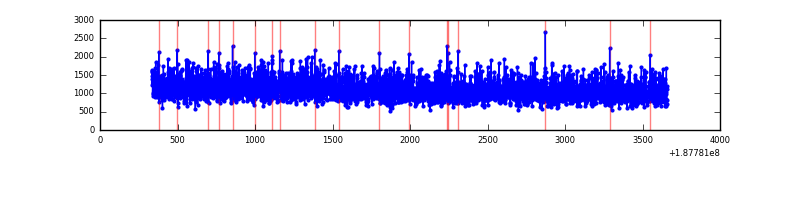 |
| B | 3326 | 3326 | 33 | 33 | 0.99% | 0.99% | 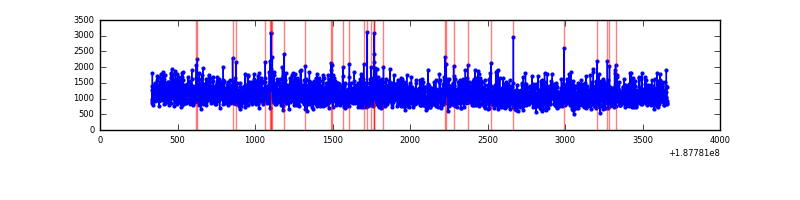 |
| C | 3326 | 3326 | 32 | 32 | 0.96% | 0.96% | 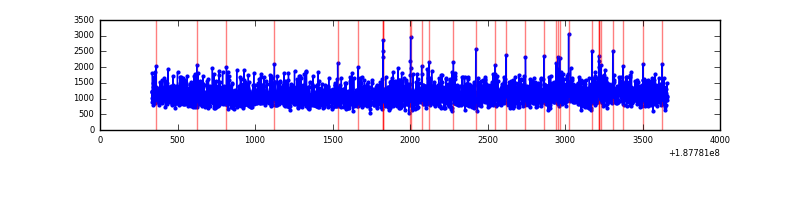 |
| D | 3326 | 3326 | 92 | 92 | 2.77% | 2.77% | 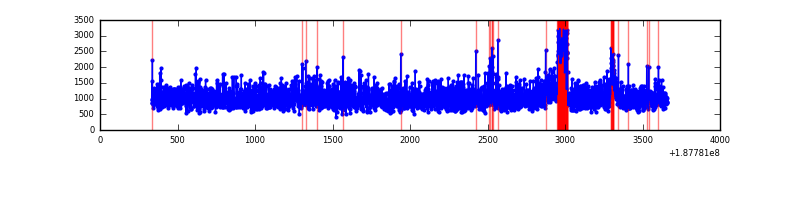 |
Top three noisy pixels from each quadrant. If the there are fewer than three noisy pixels in the level2.evt file, extra rows are filled as -1
| Pixel properties | Quadrant properties | ||||||
|---|---|---|---|---|---|---|---|
| Quadrant | DetID | PixID | Counts | Sigma | Mean | Median | Sigma |
| A | 15 | 127 | 11134 | 43.64 | 967 | 973 | 232.9 |
| A | 11 | 79 | 3307 | 10.02 | 967 | 973 | 232.9 |
| A | 12 | 243 | 2989 | 8.66 | 967 | 973 | 232.9 |
| B | 15 | 22 | 48985 | 207.47 | 975 | 981 | 231.4 |
| B | 0 | 220 | 23995 | 99.46 | 975 | 981 | 231.4 |
| B | 15 | 85 | 14856 | 59.97 | 975 | 981 | 231.4 |
| C | 15 | 241 | 158402 | 638.94 | 890 | 921 | 246.5 |
| C | 12 | 206 | 54585 | 217.73 | 890 | 921 | 246.5 |
| C | 9 | 83 | 50755 | 202.19 | 890 | 921 | 246.5 |
| D | 1 | 239 | 135113 | 490.24 | 894 | 925 | 273.7 |
| D | 10 | 85 | 34169 | 121.45 | 894 | 925 | 273.7 |
| D | 13 | 252 | 18110 | 62.78 | 894 | 925 | 273.7 |
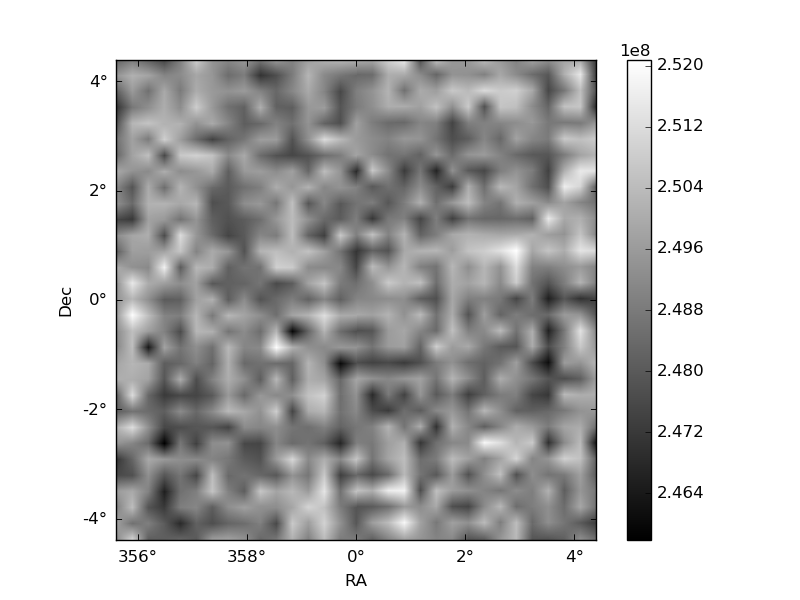
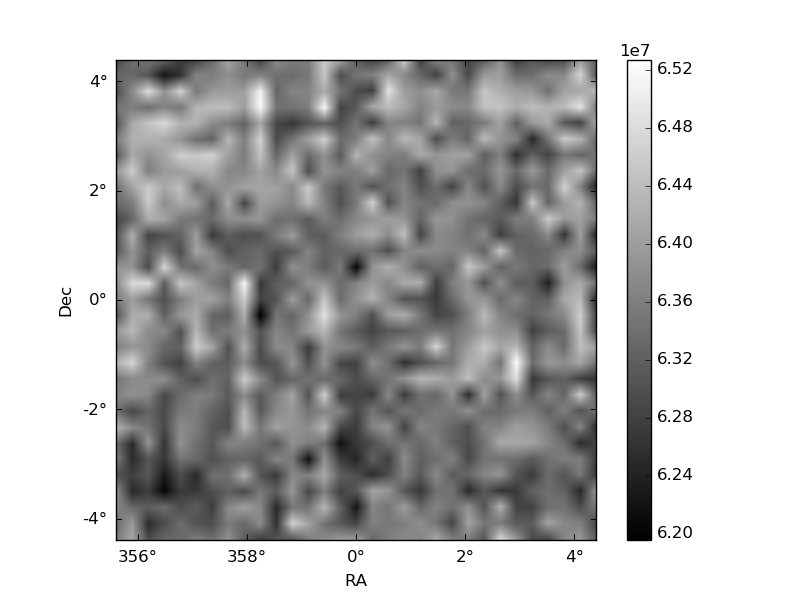
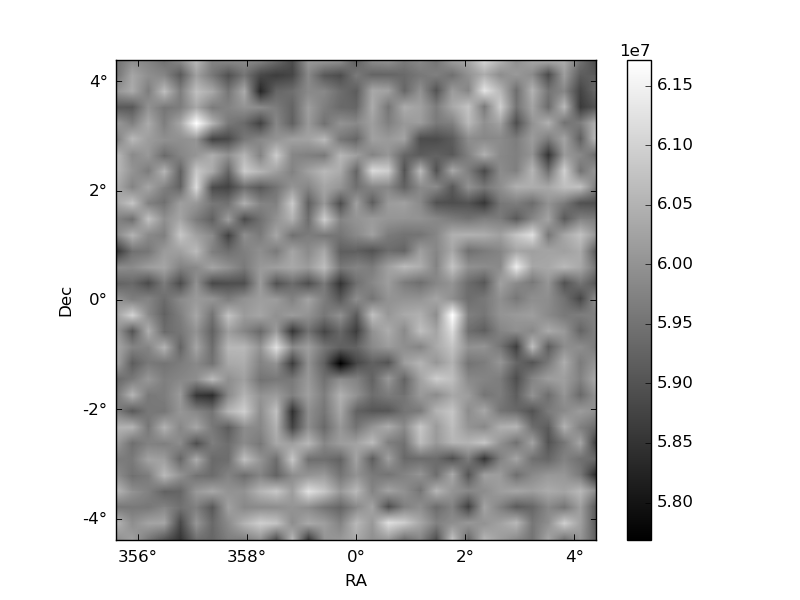
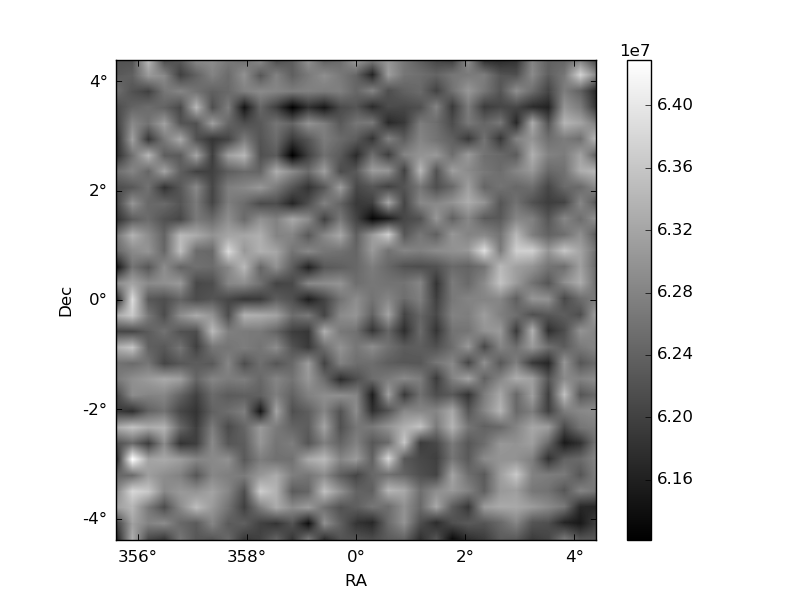
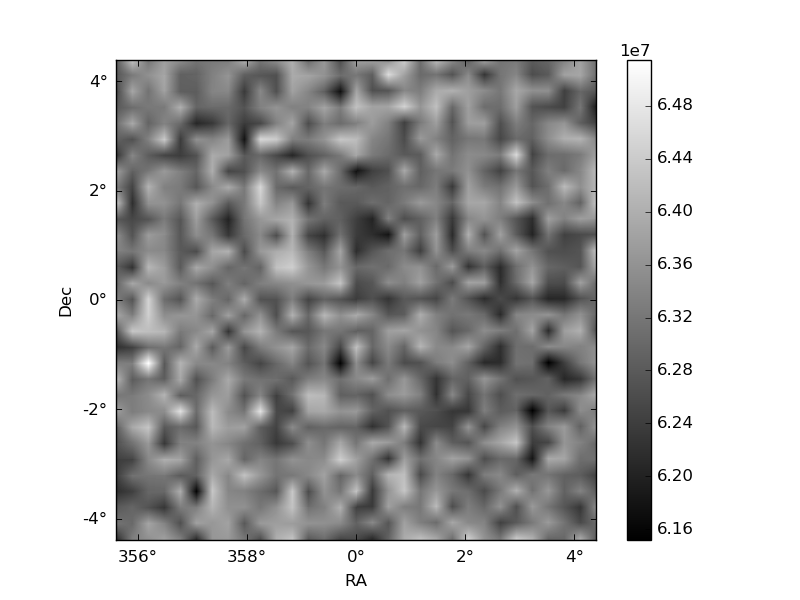
Histogram calculated using DETX and DETY for each event in the final _common_clean file
| Quadrant A | 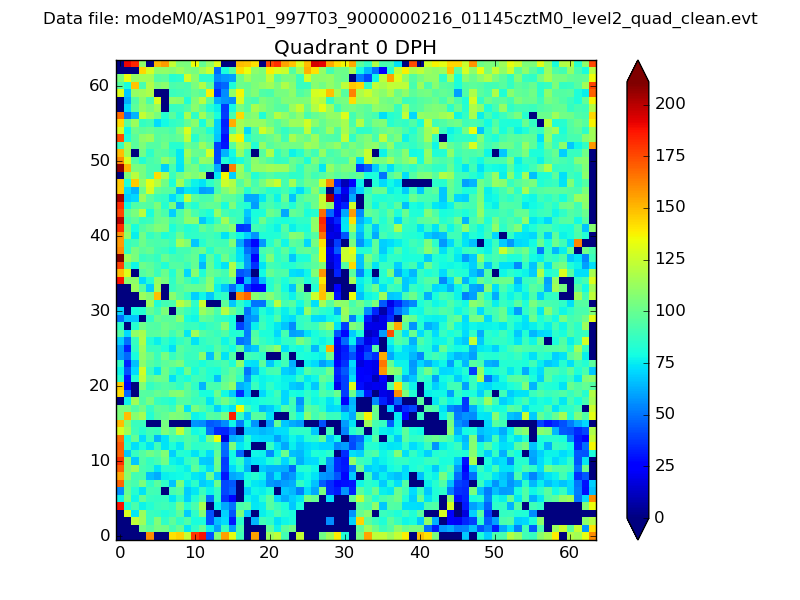 |
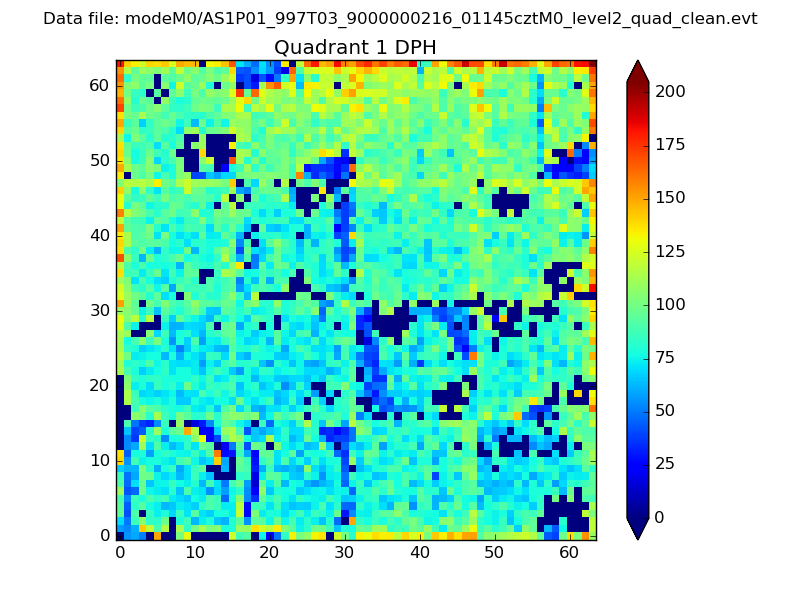 |
Quadrant B |
|---|---|---|---|
| Quadrant D | 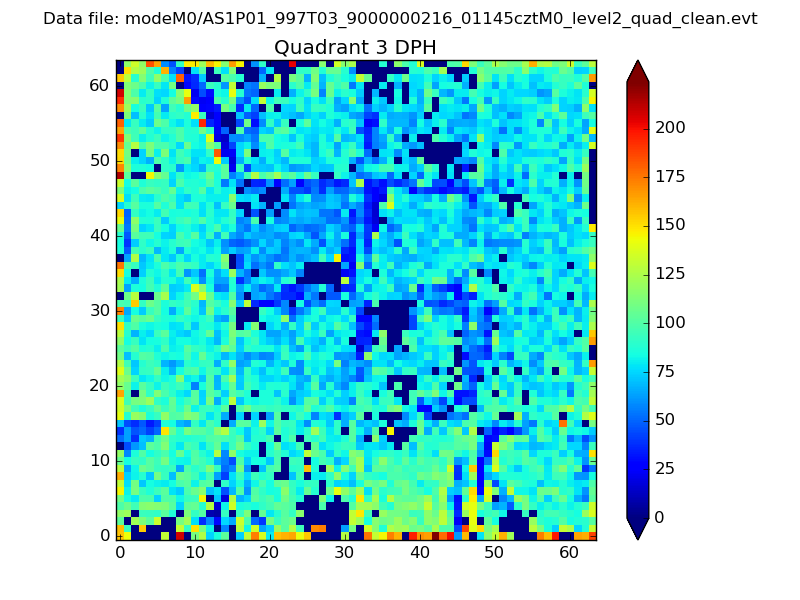 |
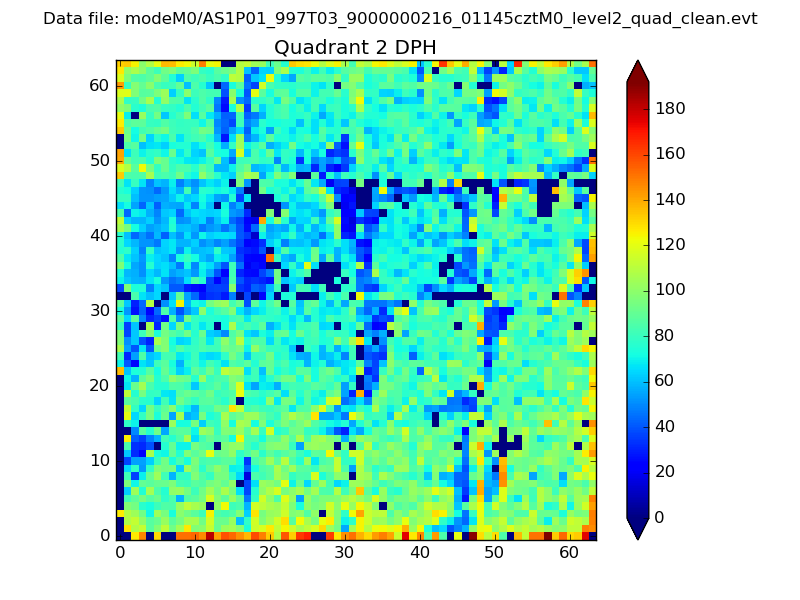 |
Quadrant C |
| Plot type | Count rate plots | Images |
|---|---|---|
| Comparison with Poisson distribution Blue bars denote a histogram of data divided into 1 sec bins. Red curve is a Poisson curve with rate = median count rate of data. |
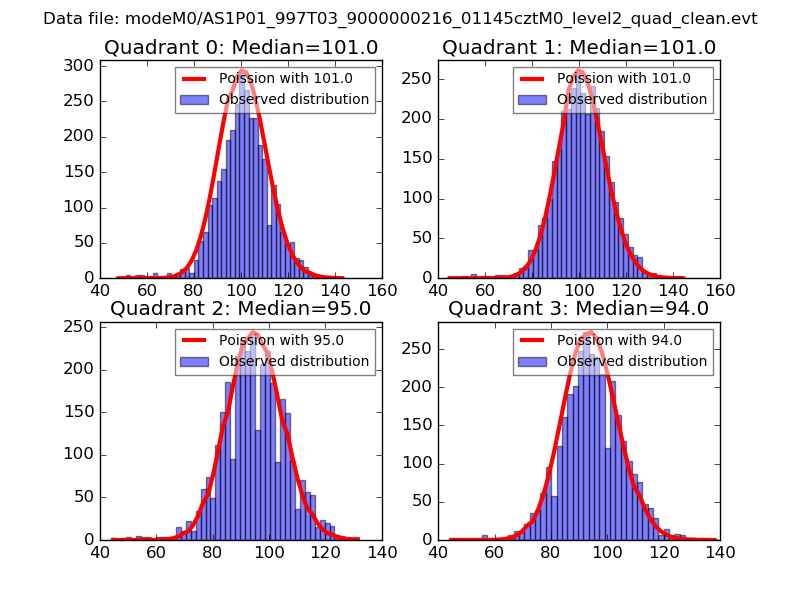 |
 |
| Quadrant-wise count rates Data is divided into 100 sec bins |
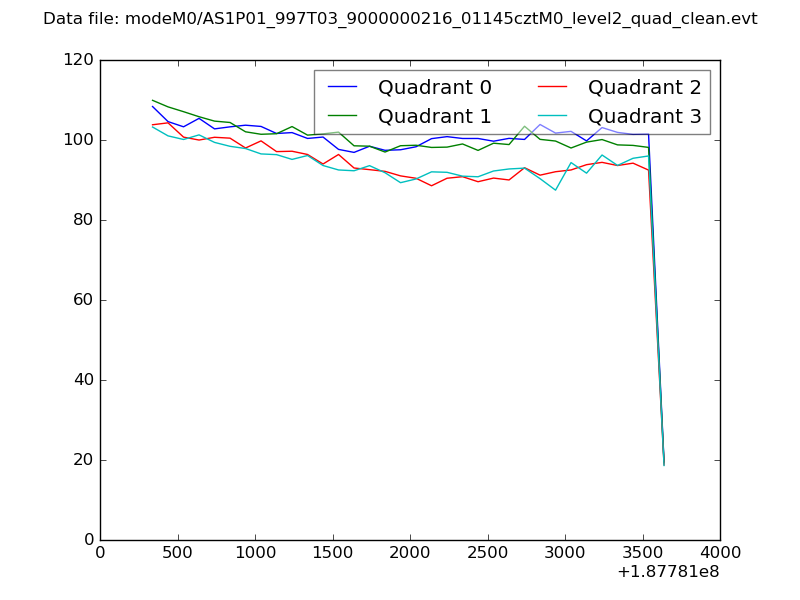 |
|
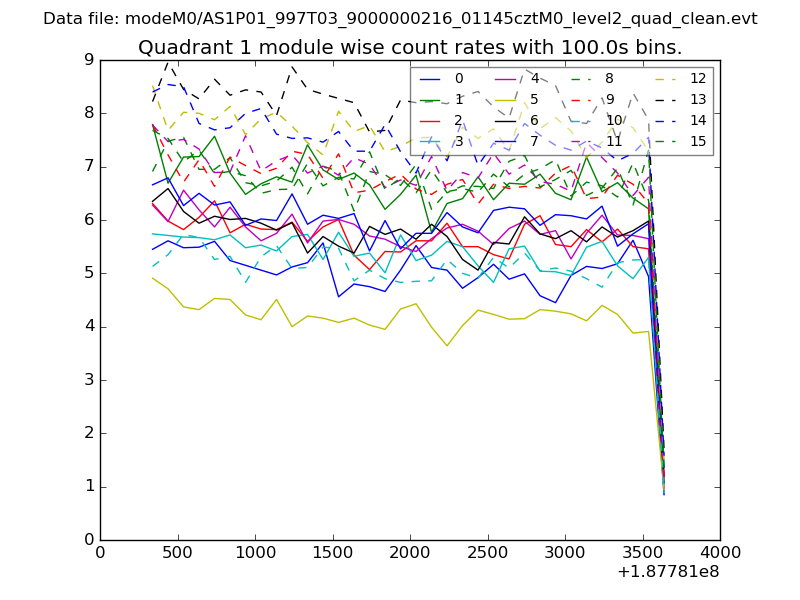
| Module-wise count rates for Quadrant A Data is divided into 100 sec bins |
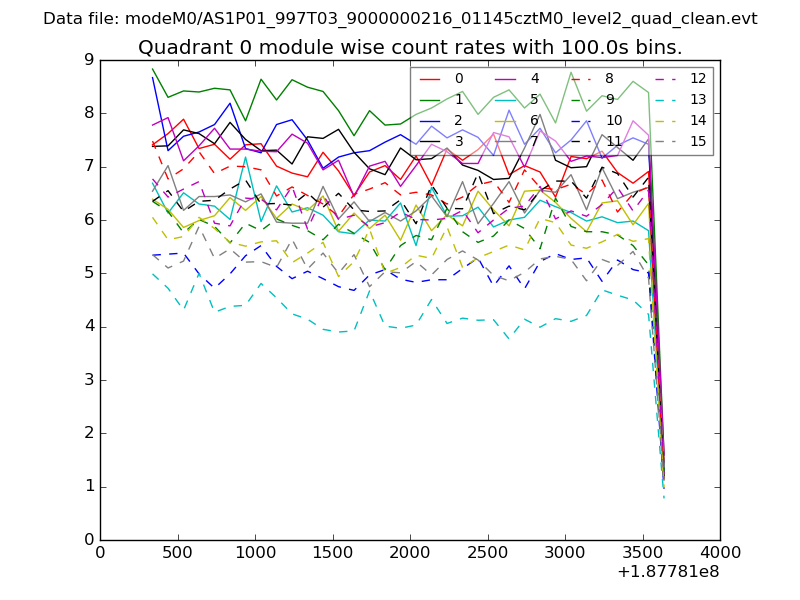 |
 |
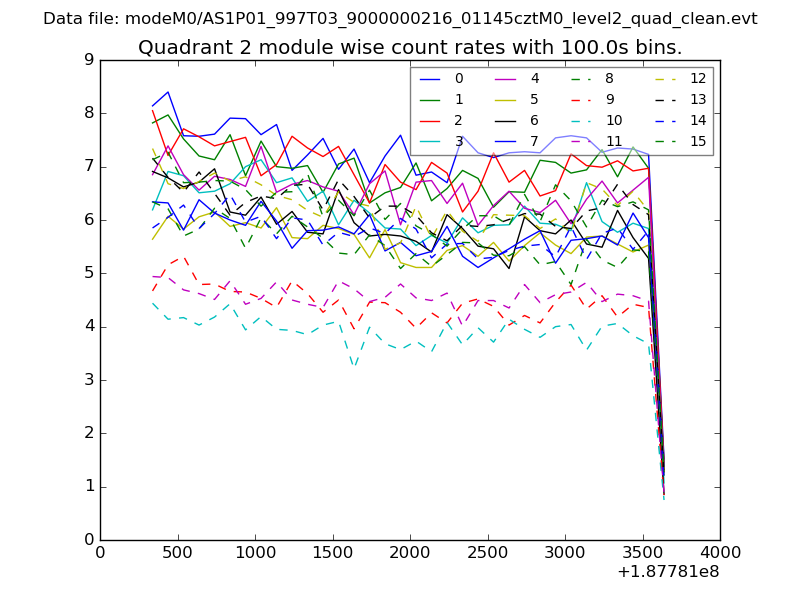
| Module-wise count rates for Quadrant B Data is divided into 100 sec bins |
 |
 |
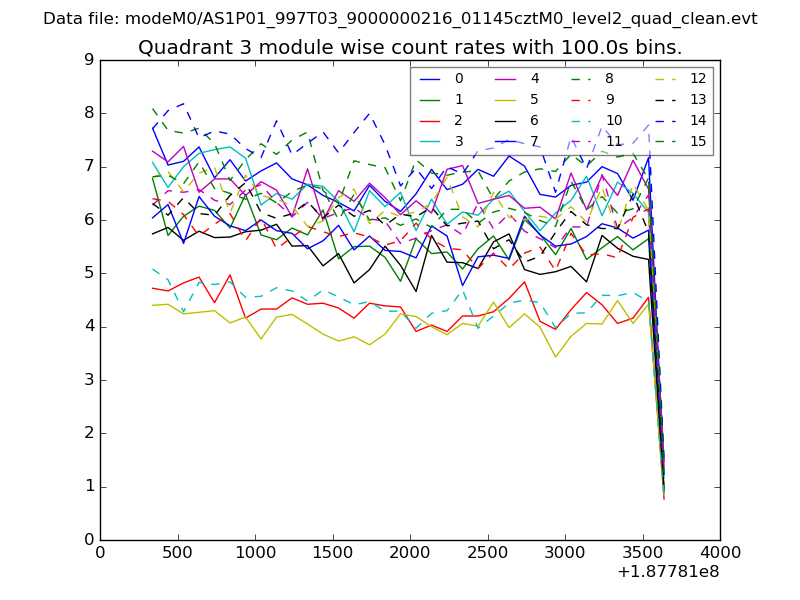
| Module-wise count rates for Quadrant C Data is divided into 100 sec bins |
 |
 |
| Module-wise count rates for Quadrant D Data is divided into 100 sec bins |
 |
 |
| Parameter | Plot |
|---|---|
| CZT HV Monitor |  |
| D_VDD | 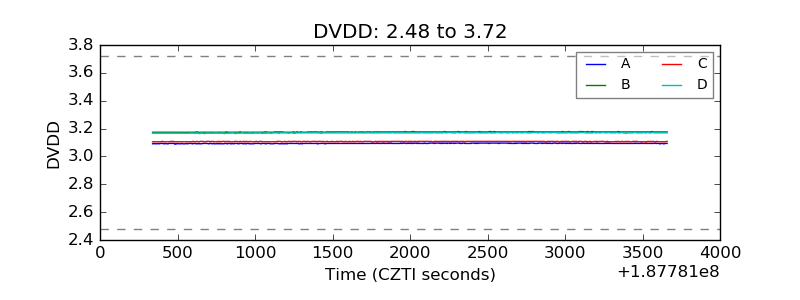 |
| Temperature 1 | 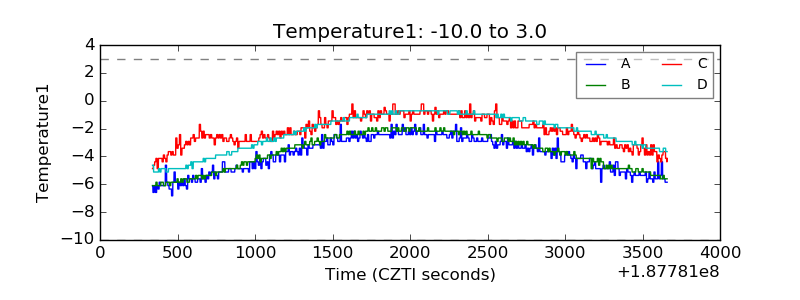 |
| Veto HV Monitor | 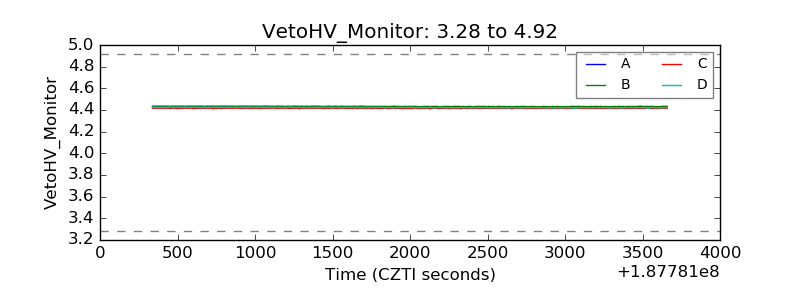 |
| Veto LLD | 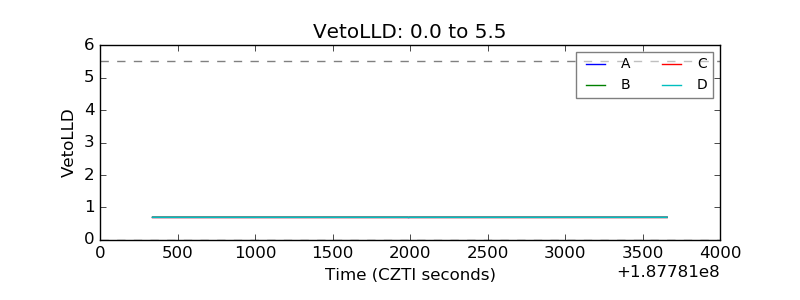 |
| Alpha Counter | 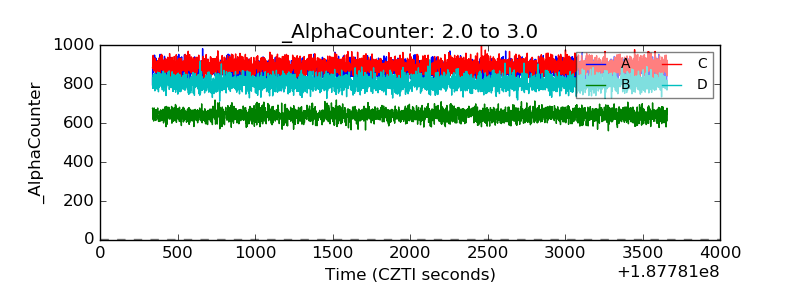 |
| _CPM_Rate | 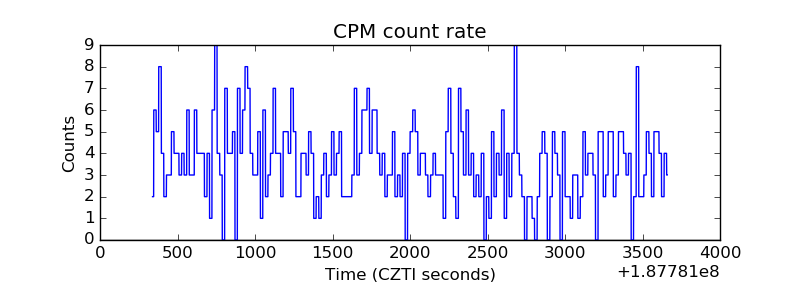 |
| CZT Counter | 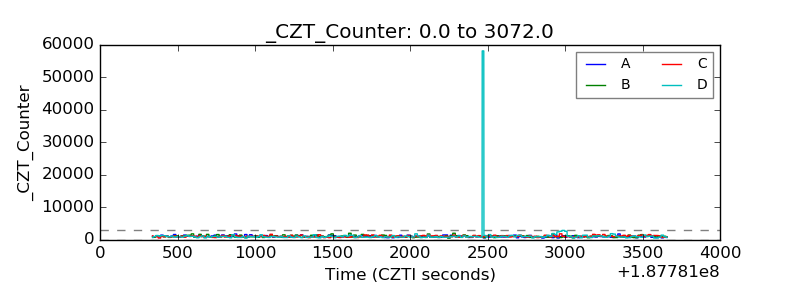 |
| +2.5 Volts monitor |  |
| +5 Volts monitor |  |
| _ROLL_ROT | 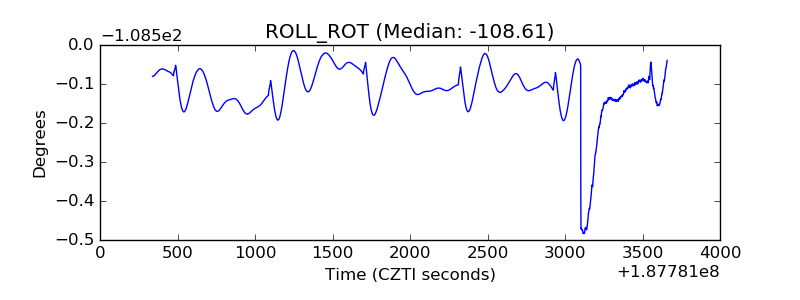 |
| _Roll_DEC | 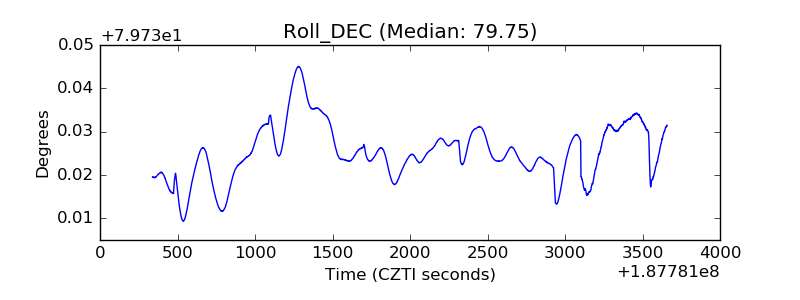 |
| _Roll_RA | 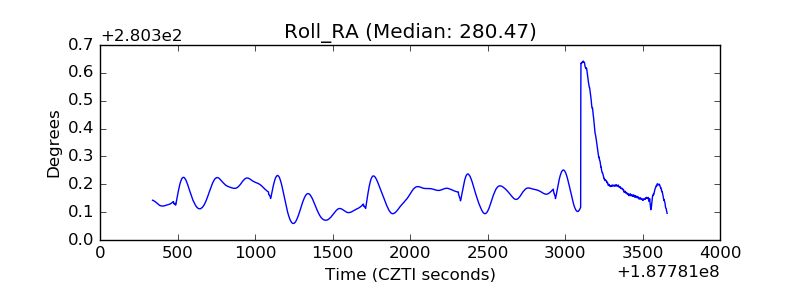 |
| Veto Counter | 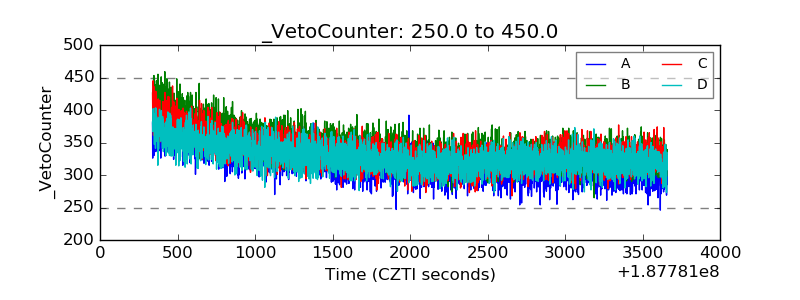 |