| Param | Original file | Final file |
|---|---|---|
| Filename | modeM0/AS1P01_997T03_9000000216_01146cztM0_level2.evt | modeM0/AS1P01_997T03_9000000216_01146cztM0_level2_quad_clean.evt |
| Size (bytes) | 1,079,585,280 | 98,326,080 |
| Size | 1.0 GB | 93.8 MB |
| Events in quadrant A | 7,948,267 | 648,381 |
| Events in quadrant B | 8,644,429 | 639,809 |
| Events in quadrant C | 8,191,917 | 618,604 |
| Events in quadrant D | 7,479,141 | 616,406 |
| Mode M0 | |||
|---|---|---|---|
| Quadrant | BADHDUFLAG | Total packets | Discarded packets |
| A | 0 | 28268 | 2 |
| B | 0 | 30321 | 1 |
| C | 0 | 28993 | 1 |
| D | 0 | 26823 | 1 |
| Mode SS | |||
|---|---|---|---|
| Quadrant | BADHDUFLAG | Total packets | Discarded packets |
| A | 0 | 132 | 0 |
| B | 0 | 132 | 0 |
| C | 0 | 132 | 0 |
| D | 0 | 132 | 0 |
| Mode M9 | |||
|---|---|---|---|
| Quadrant | BADHDUFLAG | Total packets | Discarded packets |
| A | 0 | 5 | 0 |
| B | 0 | 5 | 0 |
| C | 0 | 5 | 0 |
| D | 0 | 5 | 0 |
| Quadrant | Total seconds | Saturated seconds | Saturation percentage |
|---|---|---|---|
| A | 6519 | 91 | 1.395920% |
| B | 6519 | 117 | 1.794754% |
| C | 6519 | 97 | 1.487958% |
| D | 6519 | 84 | 1.288541% |
Noise dominated data is calculated using 1-second bins in cleaned event files. If a bin has >2000 counts, and if more than 50% of those come from <1% of pixels, then it is considered to be noise-dominated and hence unusable.
| Quadrant | # 1 sec bins | Bins with >0 counts | Bins with >2000 counts | High rate bins dominated by noise | Noise dominated (total time) | Noise dominated (detector-on time) | Marked lightcurve |
|---|---|---|---|---|---|---|---|
| A | 7024 | 6519 | 350 | 350 | 4.98% | 5.37% | 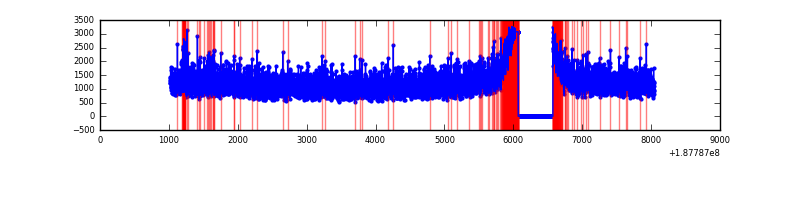 |
| B | 7024 | 6519 | 628 | 628 | 8.94% | 9.63% | 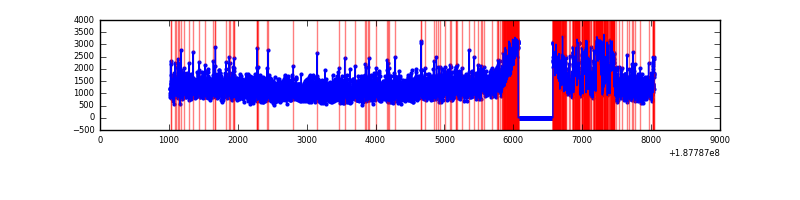 |
| C | 7024 | 6519 | 356 | 356 | 5.07% | 5.46% | 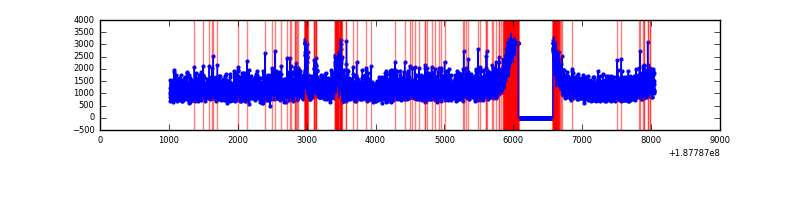 |
| D | 7024 | 6519 | 259 | 259 | 3.69% | 3.97% | 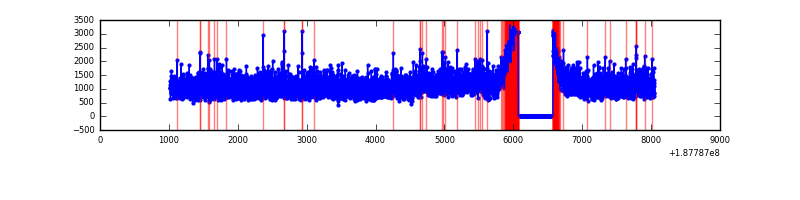 |
Top three noisy pixels from each quadrant. If the there are fewer than three noisy pixels in the level2.evt file, extra rows are filled as -1
| Pixel properties | Quadrant properties | ||||||
|---|---|---|---|---|---|---|---|
| Quadrant | DetID | PixID | Counts | Sigma | Mean | Median | Sigma |
| A | 15 | 127 | 31911 | 59.8 | 2062 | 2079 | 498.9 |
| A | 13 | 9 | 10172 | 16.22 | 2062 | 2079 | 498.9 |
| A | 3 | 111 | 6419 | 8.7 | 2062 | 2079 | 498.9 |
| B | 5 | 191 | 520371 | 1052.78 | 2087 | 2094 | 492.3 |
| B | 15 | 22 | 60596 | 118.84 | 2087 | 2094 | 492.3 |
| B | 0 | 220 | 42173 | 81.41 | 2087 | 2094 | 492.3 |
| C | 15 | 241 | 303812 | 563.61 | 1914 | 1986 | 535.5 |
| C | 12 | 206 | 298113 | 552.97 | 1914 | 1986 | 535.5 |
| C | 9 | 83 | 66744 | 120.93 | 1914 | 1986 | 535.5 |
| D | 1 | 239 | 257779 | 438.73 | 1891 | 1956 | 583.1 |
| D | 2 | 16 | 47901 | 78.79 | 1891 | 1956 | 583.1 |
| D | 13 | 73 | 27773 | 44.28 | 1891 | 1956 | 583.1 |
Histogram calculated using DETX and DETY for each event in the final _common_clean file
| Quadrant A | 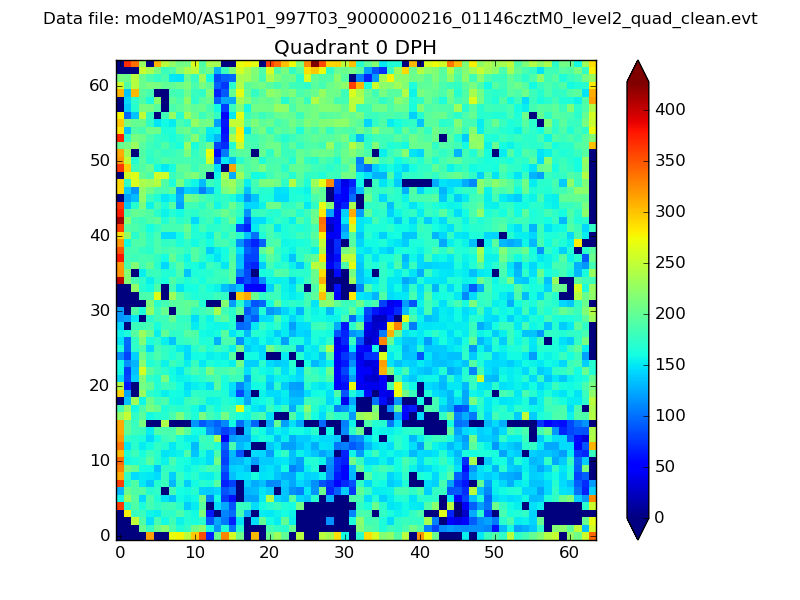 |
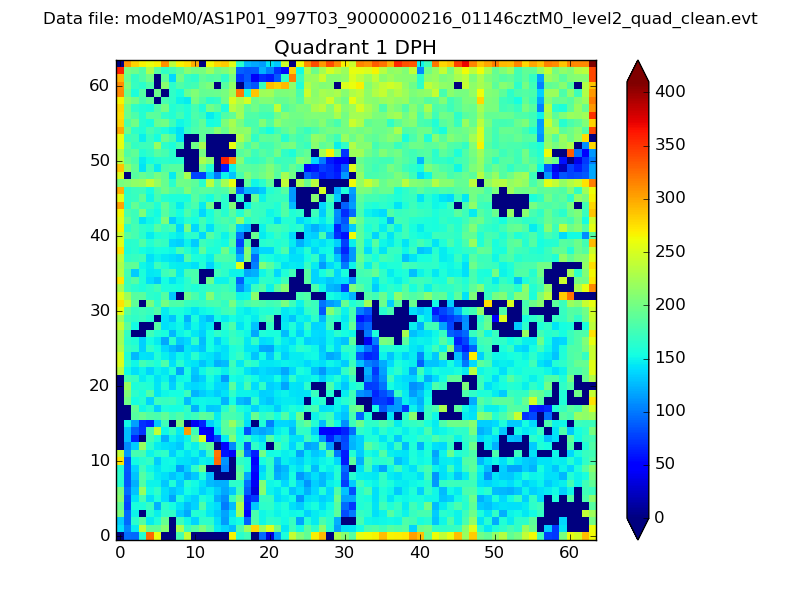 |
Quadrant B |
|---|---|---|---|
| Quadrant D | 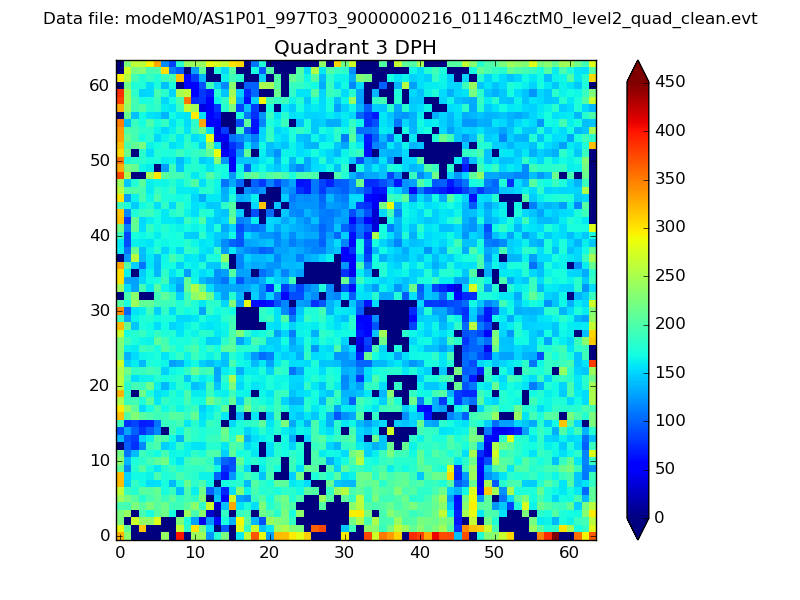 |
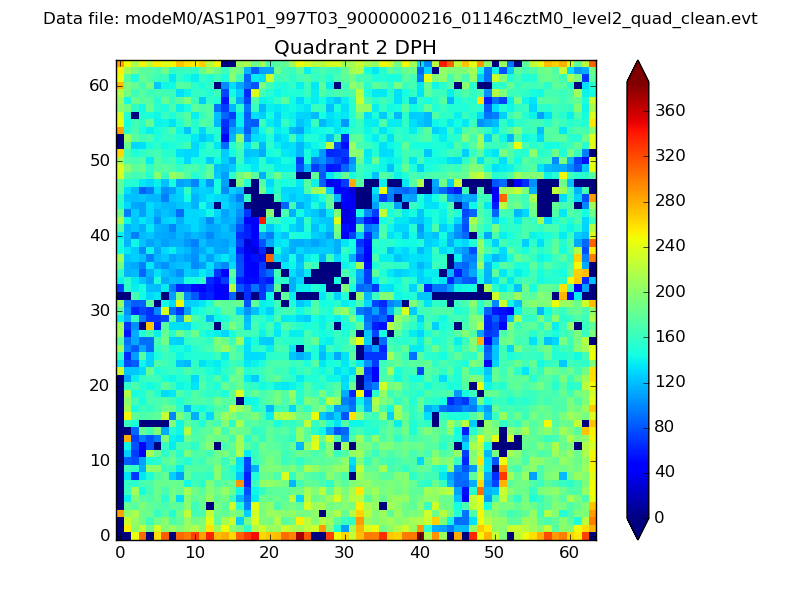 |
Quadrant C |
| Plot type | Count rate plots | Images |
|---|---|---|
| Comparison with Poisson distribution Blue bars denote a histogram of data divided into 1 sec bins. Red curve is a Poisson curve with rate = median count rate of data. |
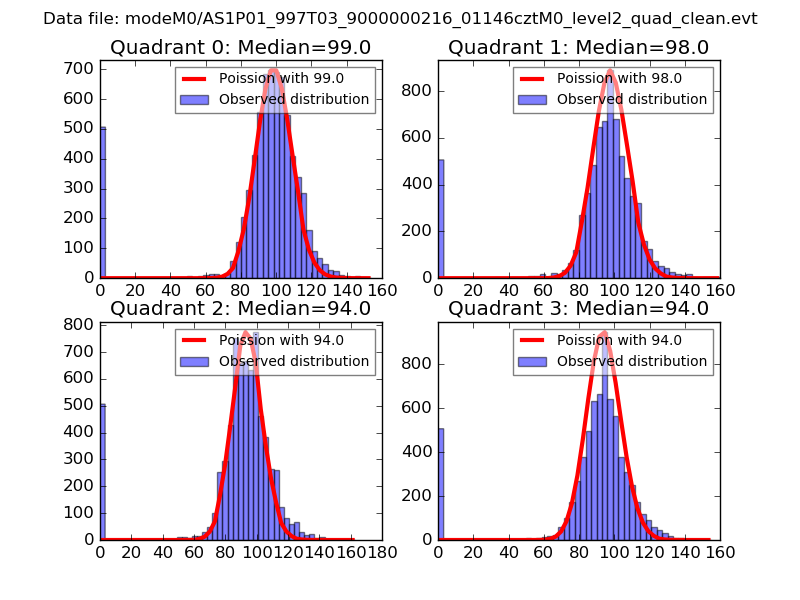 |
 |
| Quadrant-wise count rates Data is divided into 100 sec bins |
 |
|
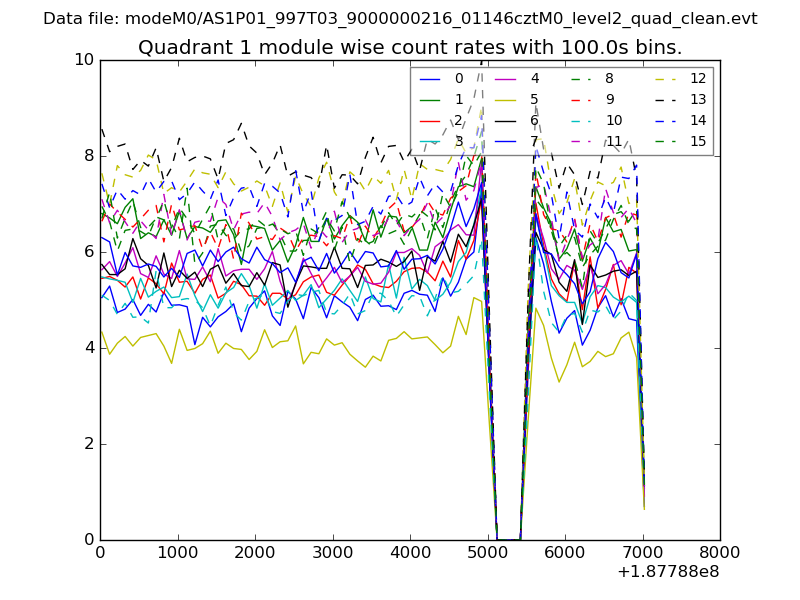
| Module-wise count rates for Quadrant A Data is divided into 100 sec bins |
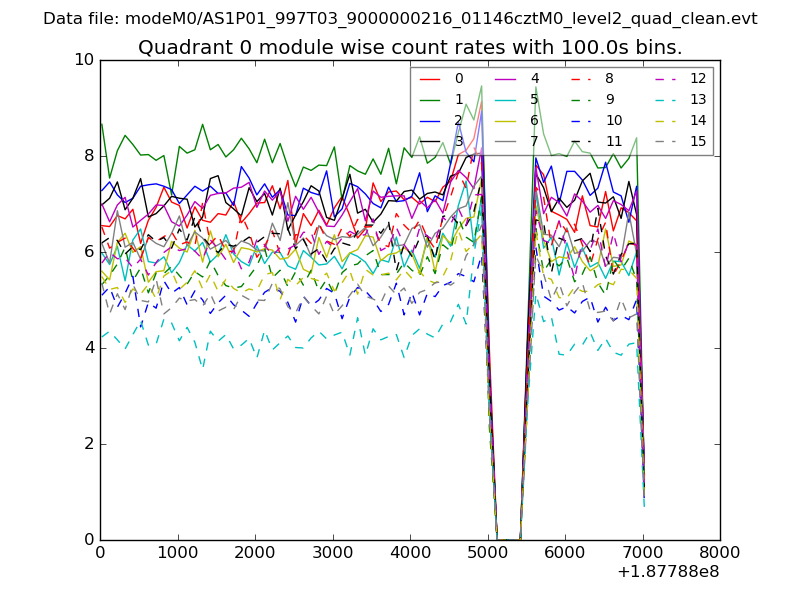 |
 |
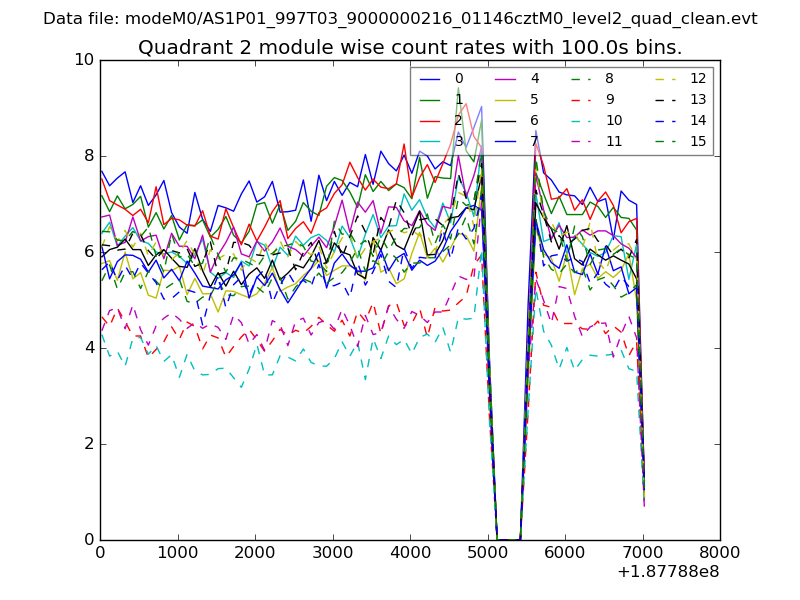
| Module-wise count rates for Quadrant B Data is divided into 100 sec bins |
 |
 |
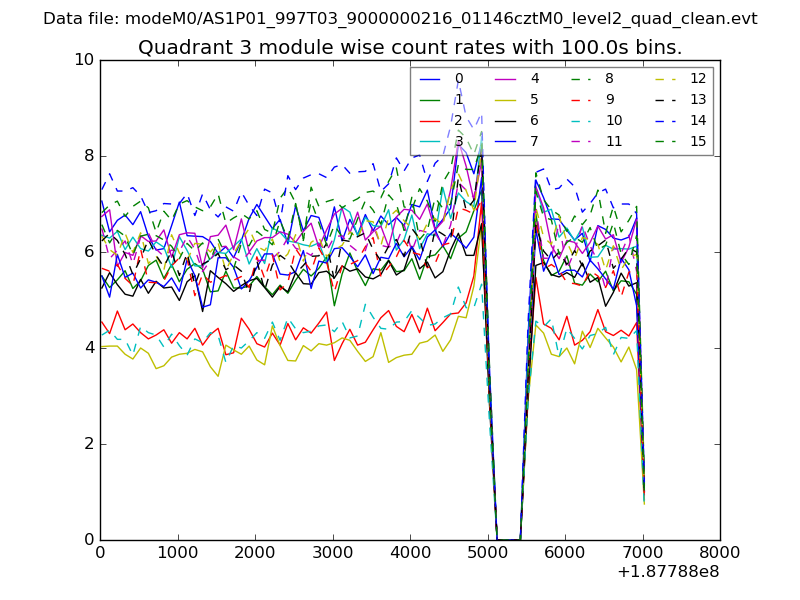
| Module-wise count rates for Quadrant C Data is divided into 100 sec bins |
 |
 |
| Module-wise count rates for Quadrant D Data is divided into 100 sec bins |
 |
 |
| Parameter | Plot |
|---|---|
| CZT HV Monitor | 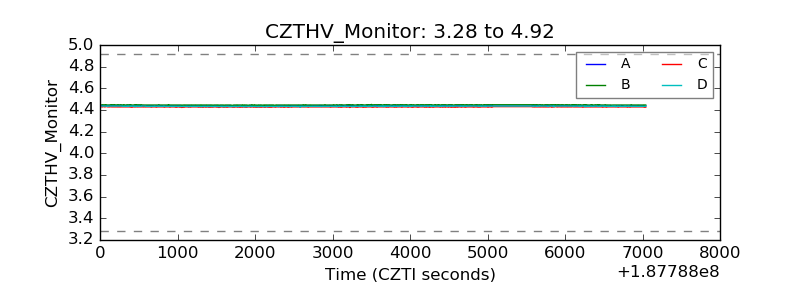 |
| D_VDD | 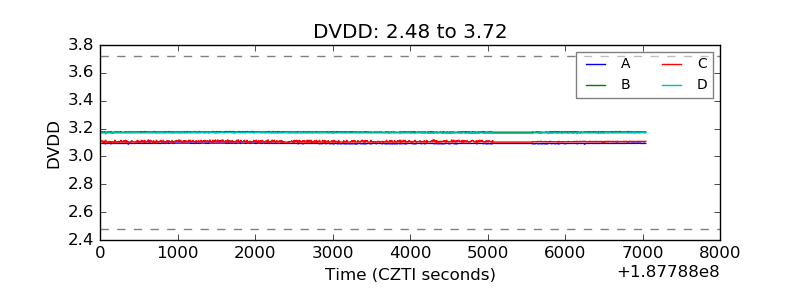 |
| Temperature 1 | 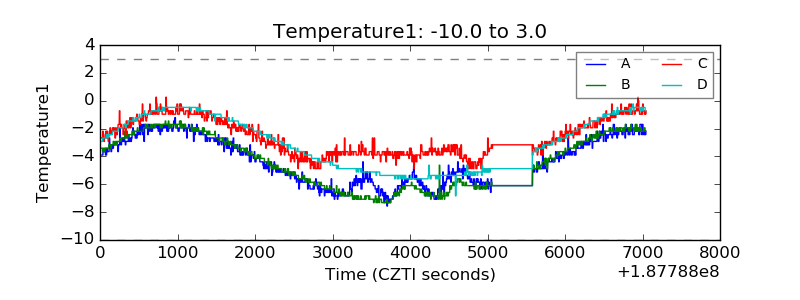 |
| Veto HV Monitor | 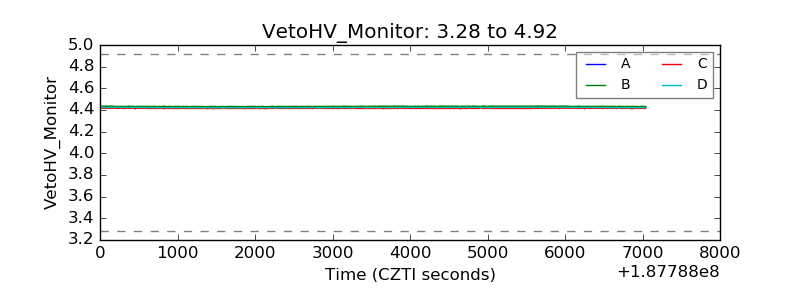 |
| Veto LLD | 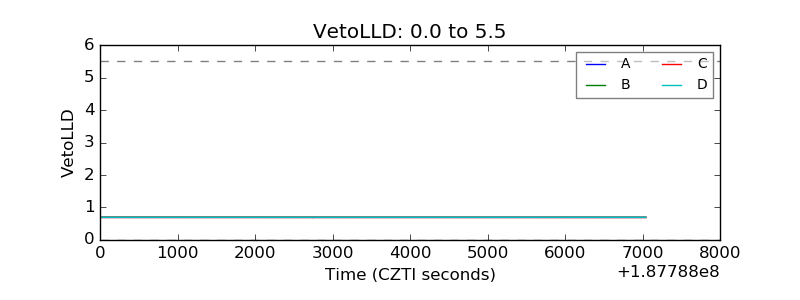 |
| Alpha Counter | 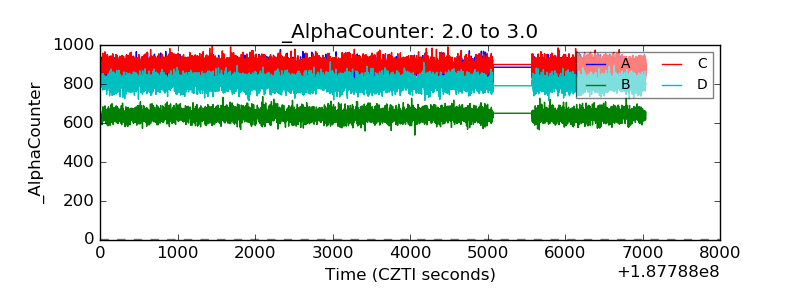 |
| _CPM_Rate | 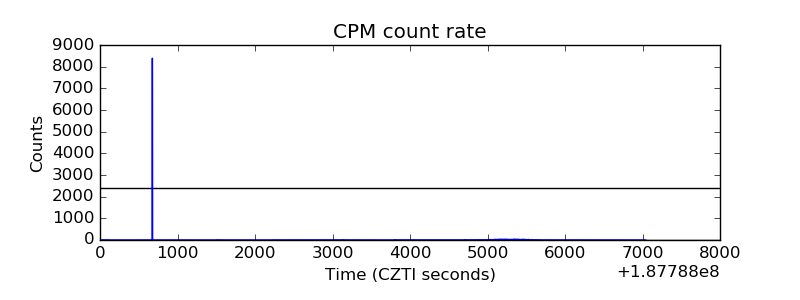 |
| CZT Counter | 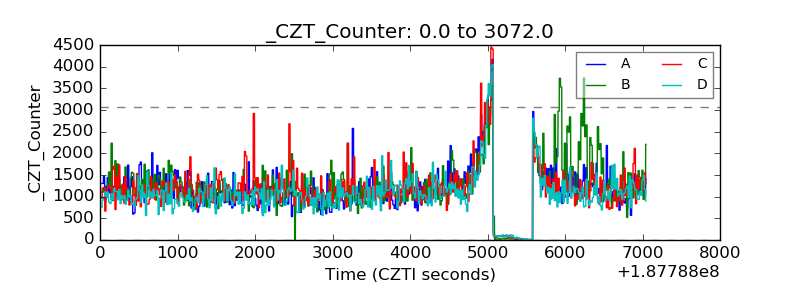 |
| +2.5 Volts monitor |  |
| +5 Volts monitor |  |
| _ROLL_ROT | 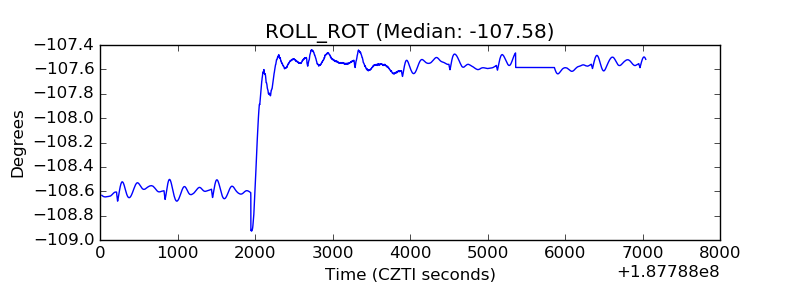 |
| _Roll_DEC | 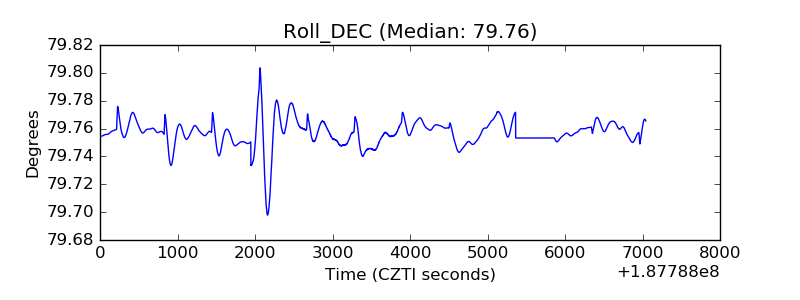 |
| _Roll_RA | 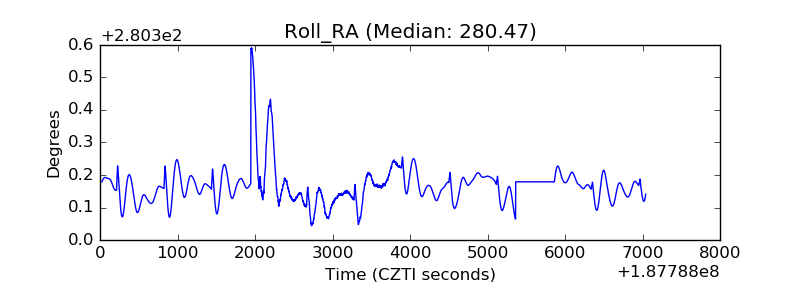 |
| Veto Counter | 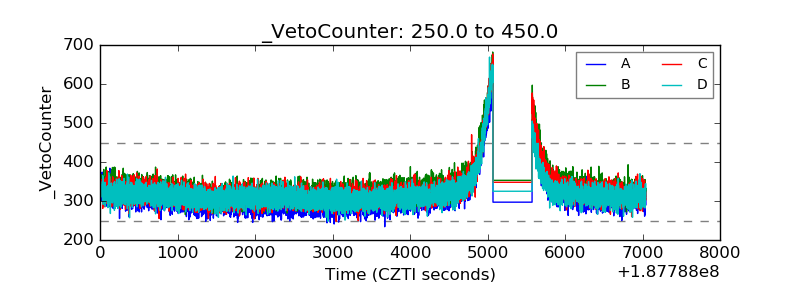 |