| Param | Original file | Final file |
|---|---|---|
| Filename | modeM0/AS1P01_997T03_9000000216_01147cztM0_level2.evt | modeM0/AS1P01_997T03_9000000216_01147cztM0_level2_quad_clean.evt |
| Size (bytes) | 1,295,795,520 | 113,463,360 |
| Size | 1.2 GB | 108.2 MB |
| Events in quadrant A | 9,223,957 | 749,964 |
| Events in quadrant B | 10,166,372 | 737,970 |
| Events in quadrant C | 10,222,420 | 711,497 |
| Events in quadrant D | 9,128,235 | 707,981 |
| Mode M0 | |||
|---|---|---|---|
| Quadrant | BADHDUFLAG | Total packets | Discarded packets |
| A | 0 | 32788 | 3 |
| B | 0 | 35527 | 2 |
| C | 0 | 35753 | 2 |
| D | 0 | 32525 | 2 |
| Mode SS | |||
|---|---|---|---|
| Quadrant | BADHDUFLAG | Total packets | Discarded packets |
| A | 0 | 152 | 0 |
| B | 0 | 152 | 0 |
| C | 0 | 152 | 0 |
| D | 0 | 152 | 0 |
| Quadrant | Total seconds | Saturated seconds | Saturation percentage |
|---|---|---|---|
| A | 7604 | 13 | 0.170963% |
| B | 7604 | 113 | 1.486060% |
| C | 7604 | 92 | 1.209890% |
| D | 7604 | 83 | 1.091531% |
Noise dominated data is calculated using 1-second bins in cleaned event files. If a bin has >2000 counts, and if more than 50% of those come from <1% of pixels, then it is considered to be noise-dominated and hence unusable.
| Quadrant | # 1 sec bins | Bins with >0 counts | Bins with >2000 counts | High rate bins dominated by noise | Noise dominated (total time) | Noise dominated (detector-on time) | Marked lightcurve |
|---|---|---|---|---|---|---|---|
| A | 7674 | 7608 | 360 | 360 | 4.69% | 4.73% | 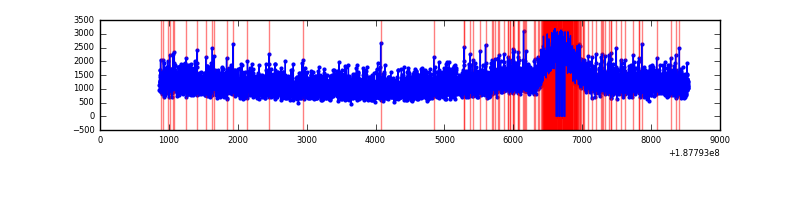 |
| B | 7674 | 7608 | 735 | 735 | 9.58% | 9.66% | 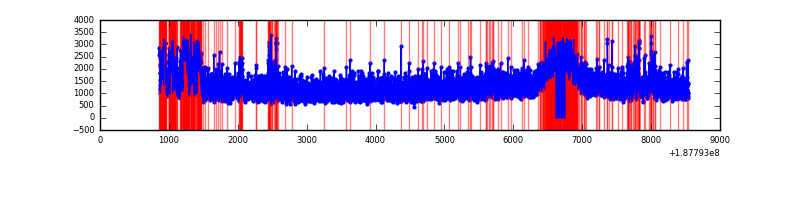 |
| C | 7674 | 7608 | 621 | 621 | 8.09% | 8.16% | 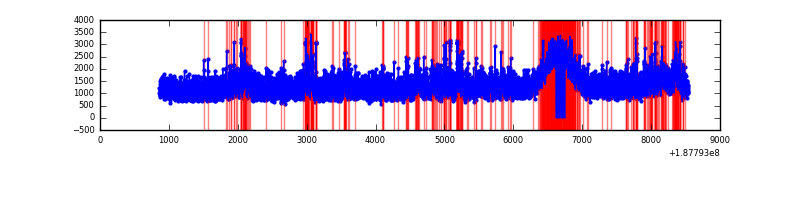 |
| D | 7674 | 7607 | 462 | 462 | 6.02% | 6.07% | 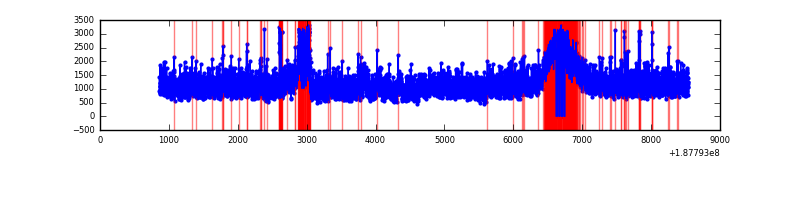 |
Top three noisy pixels from each quadrant. If the there are fewer than three noisy pixels in the level2.evt file, extra rows are filled as -1
| Pixel properties | Quadrant properties | ||||||
|---|---|---|---|---|---|---|---|
| Quadrant | DetID | PixID | Counts | Sigma | Mean | Median | Sigma |
| A | 15 | 127 | 12458 | 17.38 | 2398 | 2417 | 577.6 |
| A | 11 | 79 | 9515 | 12.29 | 2398 | 2417 | 577.6 |
| A | 15 | 233 | 7948 | 9.58 | 2398 | 2417 | 577.6 |
| B | 5 | 191 | 518752 | 895.85 | 2451 | 2462 | 576.3 |
| B | 6 | 53 | 98108 | 165.96 | 2451 | 2462 | 576.3 |
| B | 5 | 249 | 87520 | 147.59 | 2451 | 2462 | 576.3 |
| C | 12 | 206 | 872133 | 1386.45 | 2247 | 2324 | 627.4 |
| C | 15 | 241 | 364004 | 576.51 | 2247 | 2324 | 627.4 |
| C | 9 | 83 | 85056 | 131.87 | 2247 | 2324 | 627.4 |
| D | 1 | 239 | 380493 | 554.76 | 2209 | 2289 | 681.7 |
| D | 2 | 16 | 364039 | 530.62 | 2209 | 2289 | 681.7 |
| D | 13 | 252 | 49927 | 69.88 | 2209 | 2289 | 681.7 |
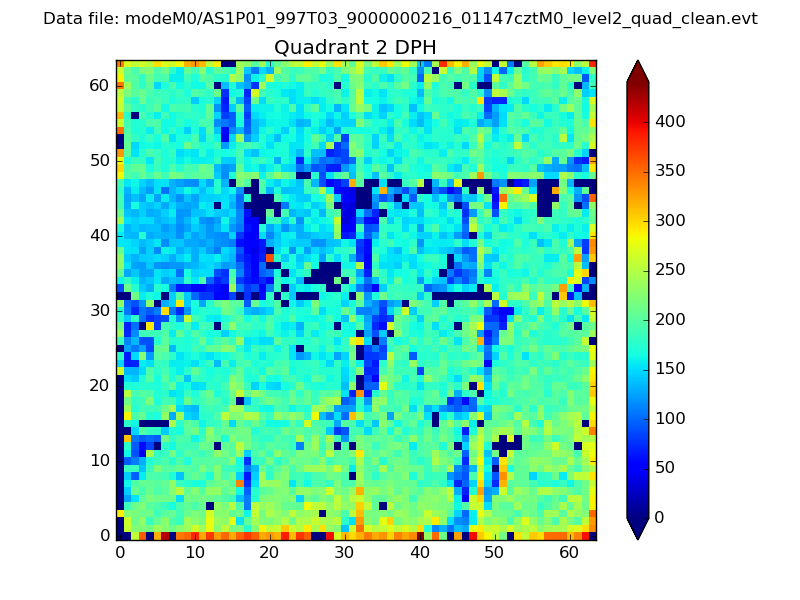
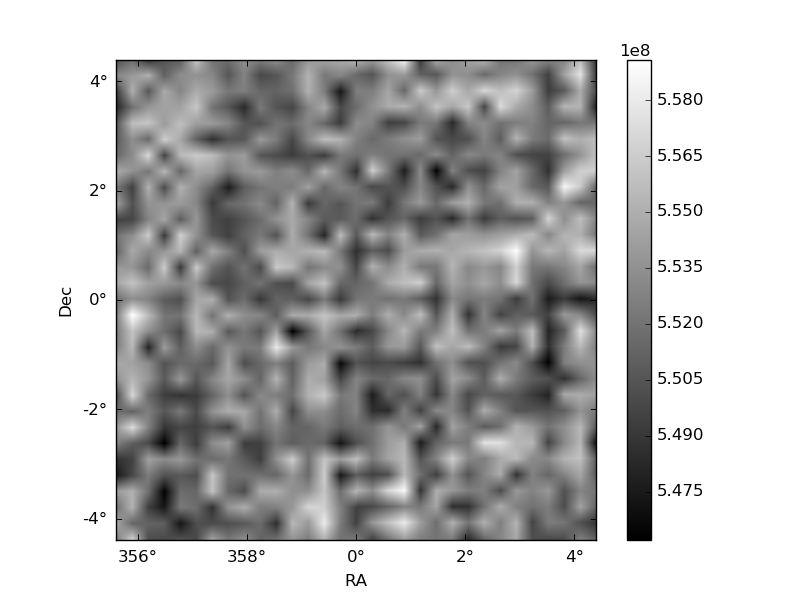
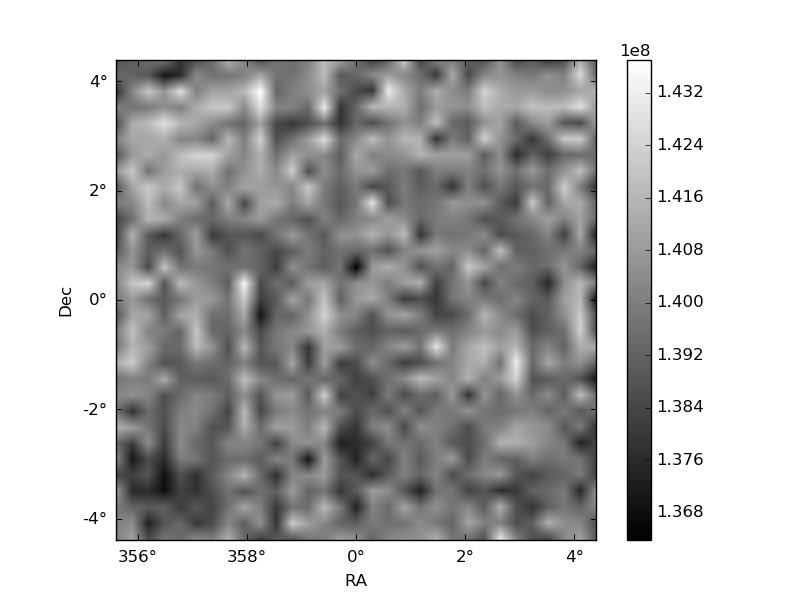
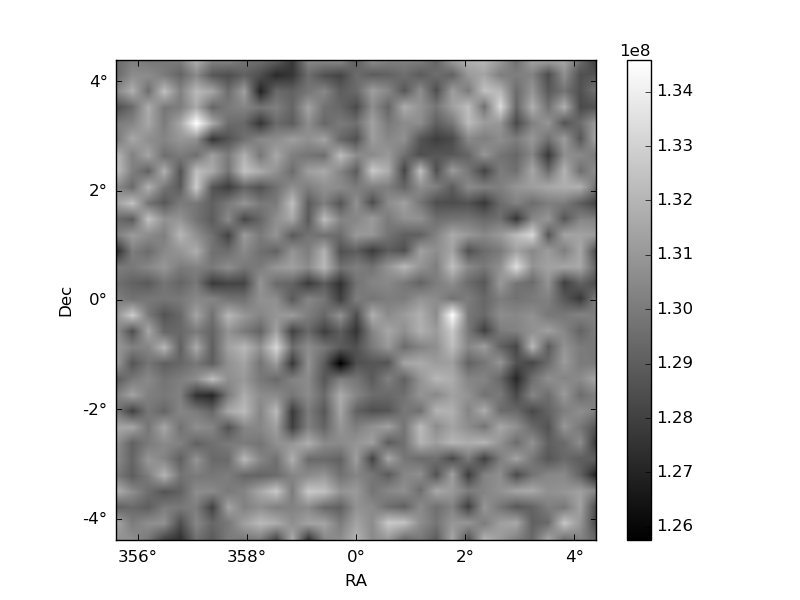
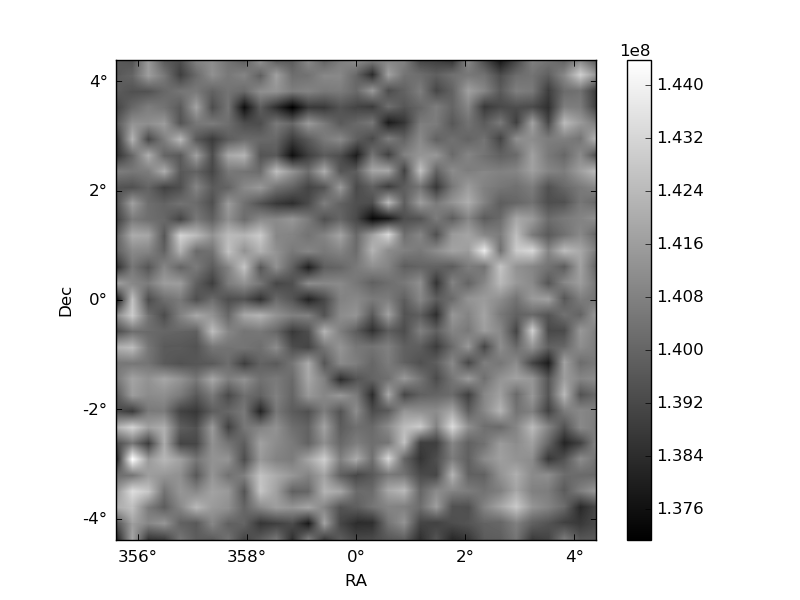
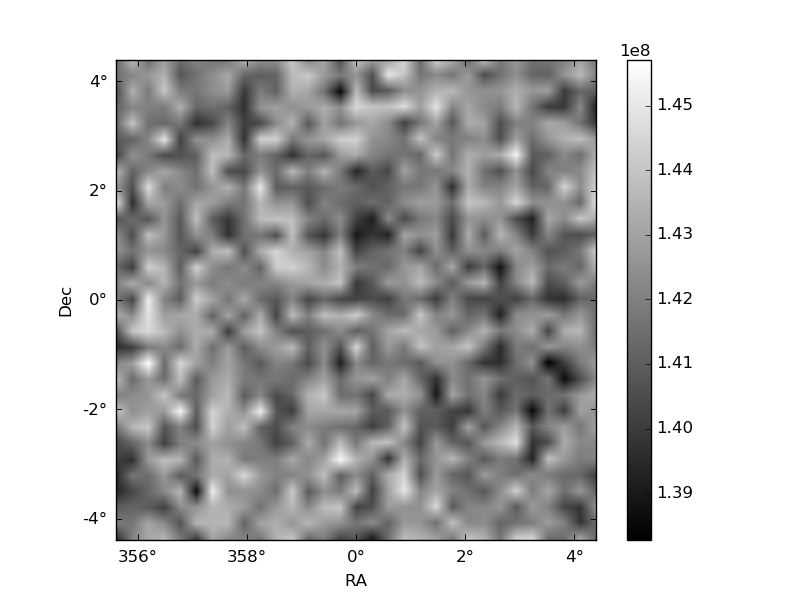
Histogram calculated using DETX and DETY for each event in the final _common_clean file
| Quadrant A | 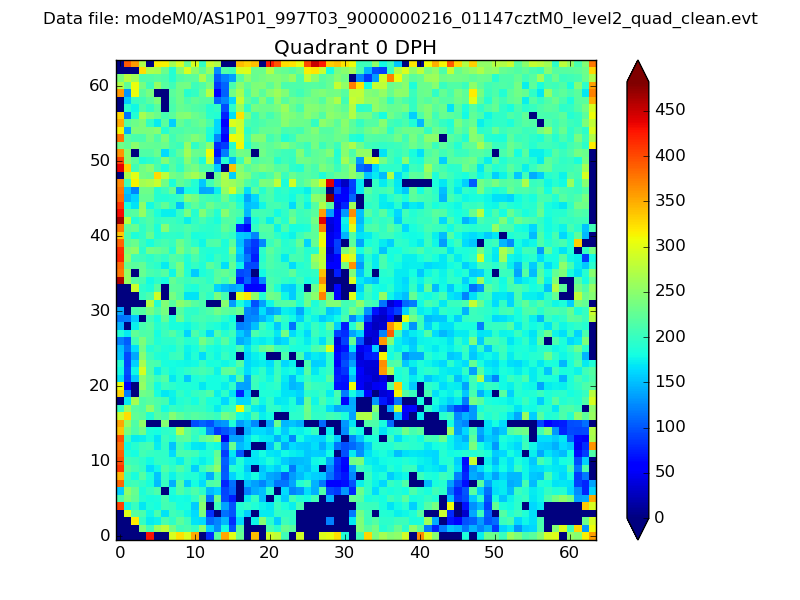 |
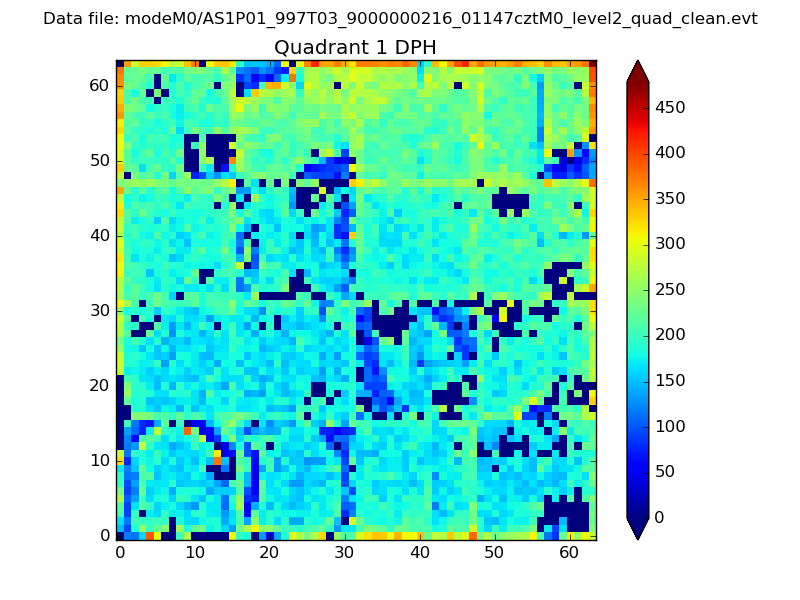 |
Quadrant B |
|---|---|---|---|
| Quadrant D | 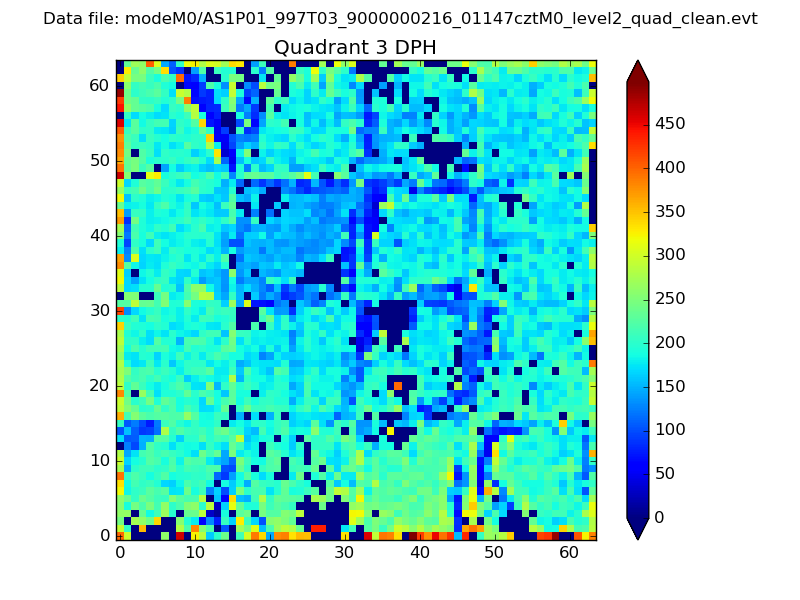 |
 |
Quadrant C |
| Plot type | Count rate plots | Images |
|---|---|---|
| Comparison with Poisson distribution Blue bars denote a histogram of data divided into 1 sec bins. Red curve is a Poisson curve with rate = median count rate of data. |
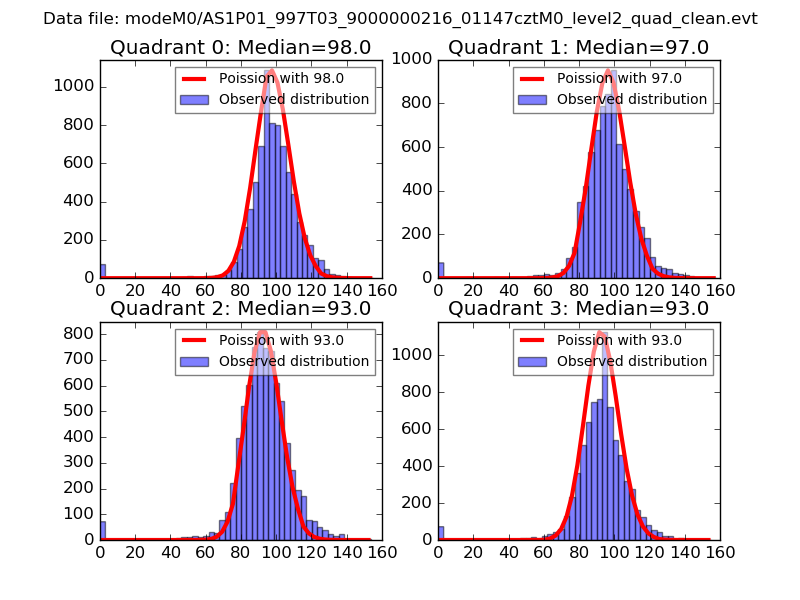 |
 |
| Quadrant-wise count rates Data is divided into 100 sec bins |
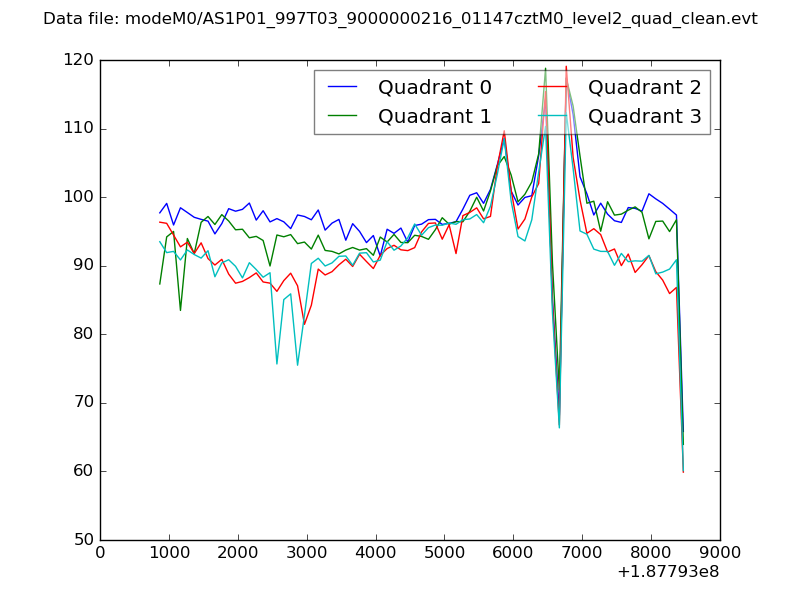 |
|
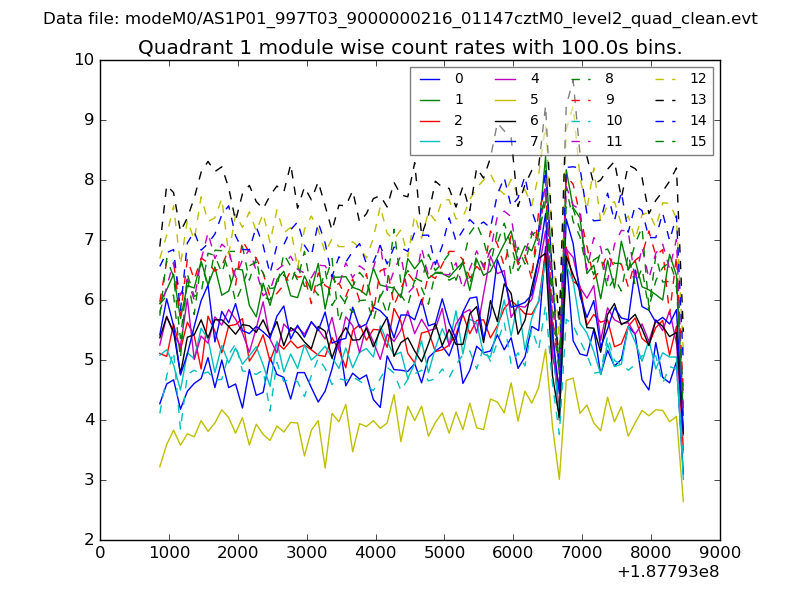
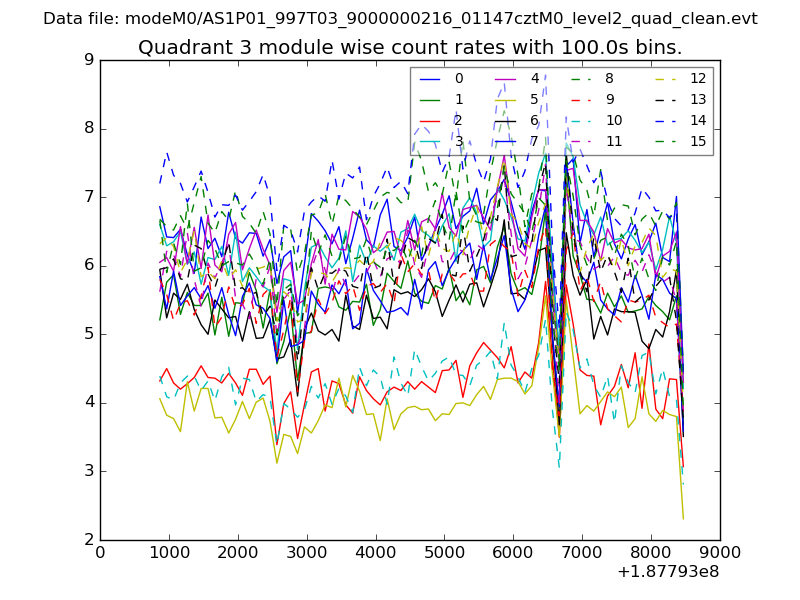
| Module-wise count rates for Quadrant A Data is divided into 100 sec bins |
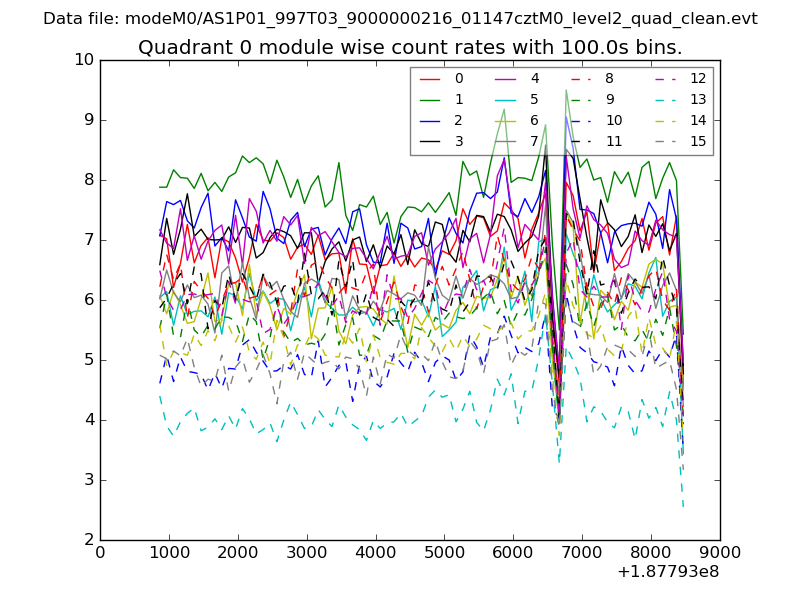 |
 |
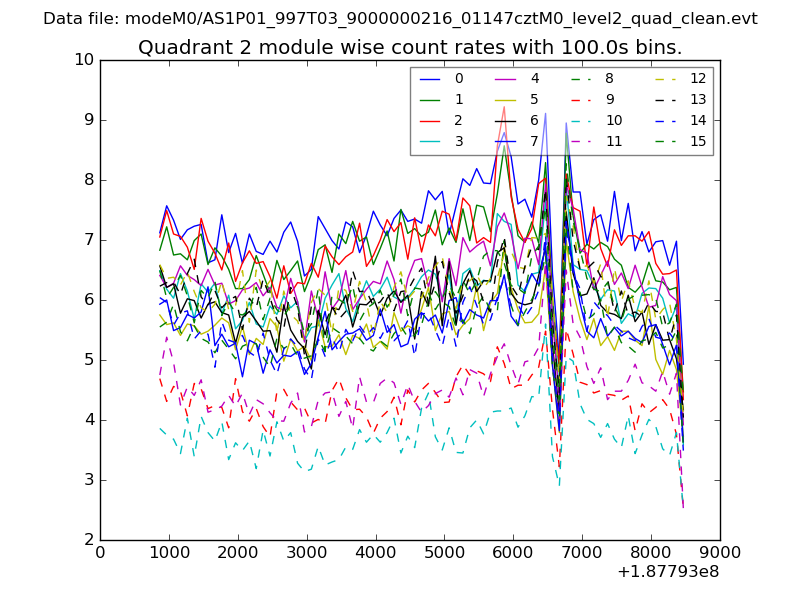
| Module-wise count rates for Quadrant B Data is divided into 100 sec bins |
 |
 |
| Module-wise count rates for Quadrant C Data is divided into 100 sec bins |
 |
 |
| Module-wise count rates for Quadrant D Data is divided into 100 sec bins |
 |
 |
| Parameter | Plot |
|---|---|
| CZT HV Monitor | 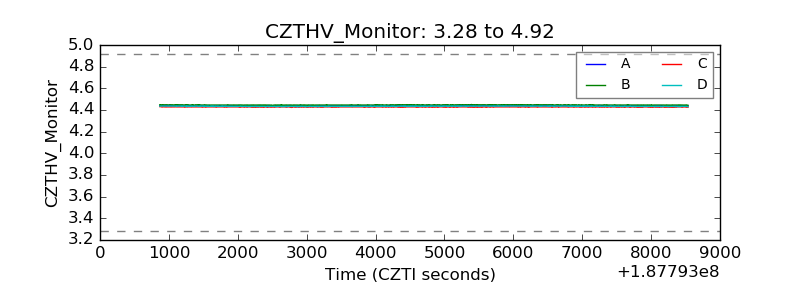 |
| D_VDD | 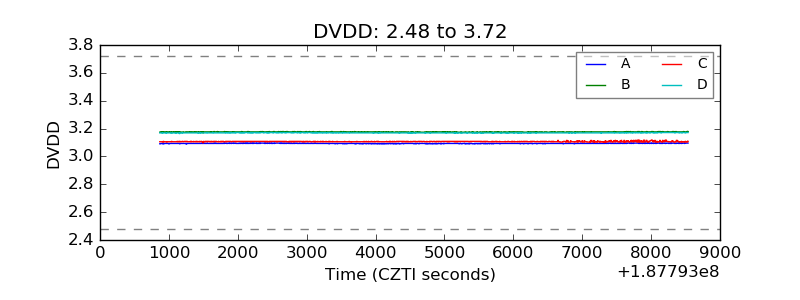 |
| Temperature 1 | 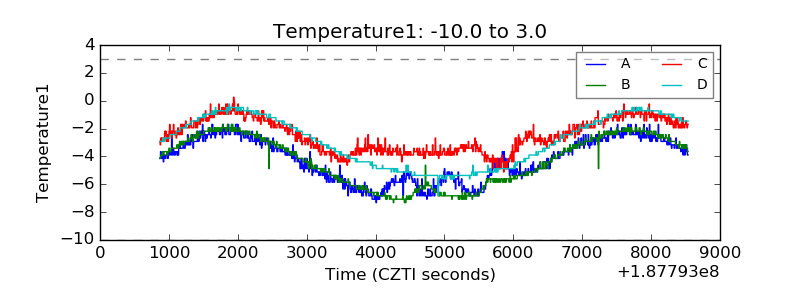 |
| Veto HV Monitor | 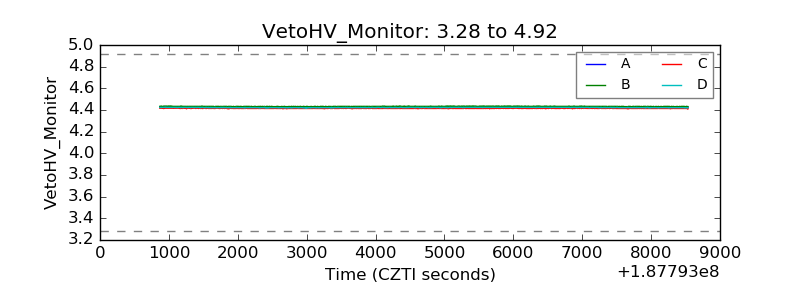 |
| Veto LLD | 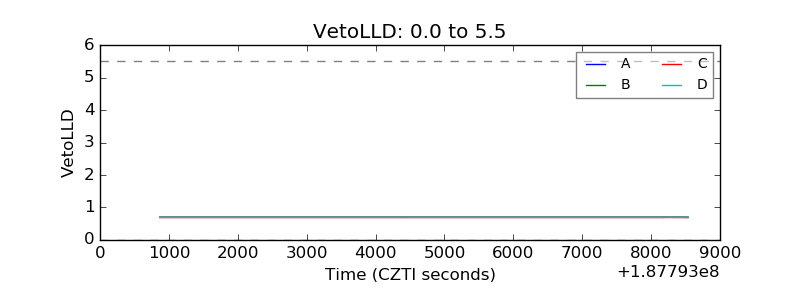 |
| Alpha Counter | 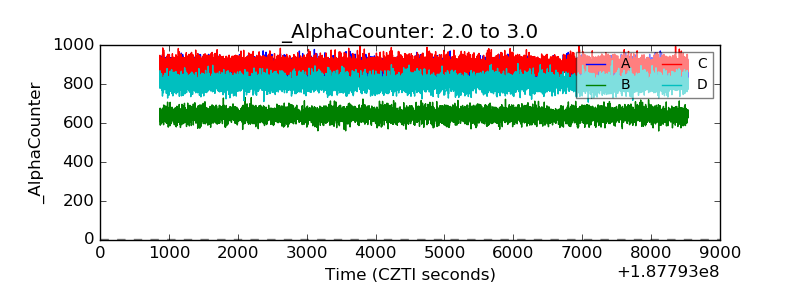 |
| _CPM_Rate | 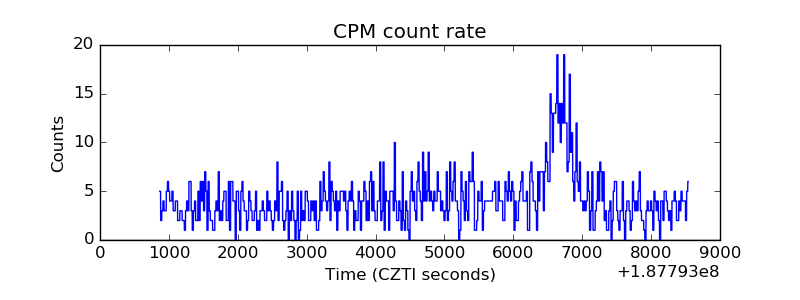 |
| CZT Counter | 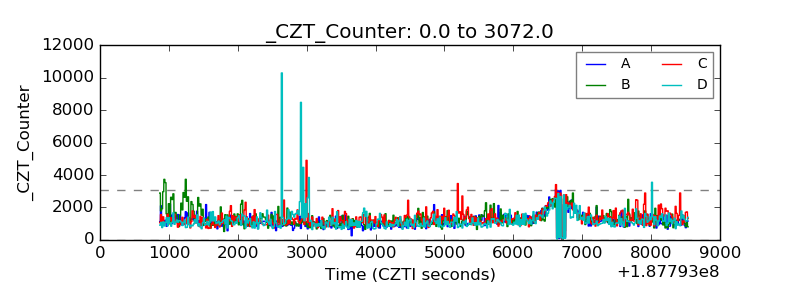 |
| +2.5 Volts monitor |  |
| +5 Volts monitor |  |
| _ROLL_ROT | 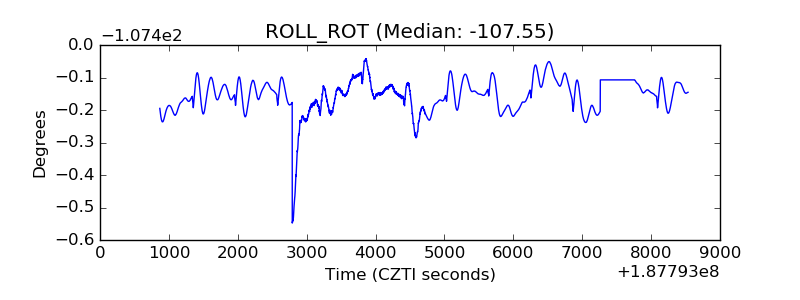 |
| _Roll_DEC | 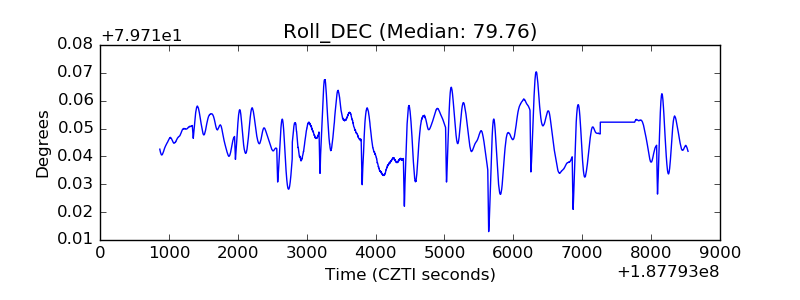 |
| _Roll_RA | 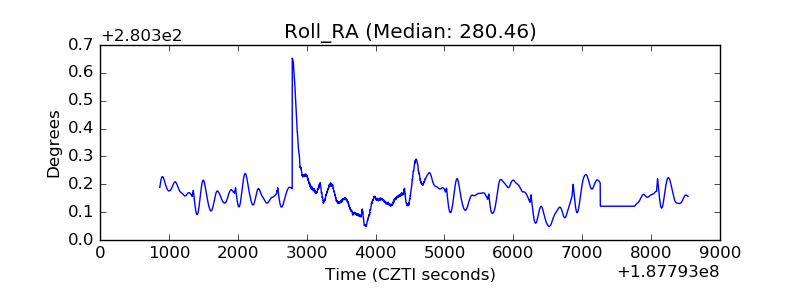 |
| Veto Counter | 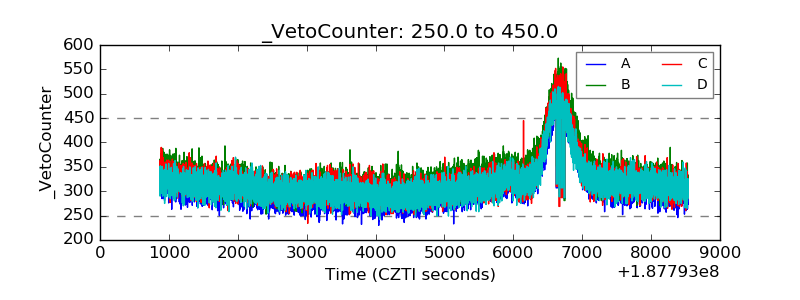 |