| Param | Original file | Final file |
|---|---|---|
| Filename | modeM0/AS1P01_997T03_9000000216_01148cztM0_level2.evt | modeM0/AS1P01_997T03_9000000216_01148cztM0_level2_quad_clean.evt |
| Size (bytes) | 1,198,186,560 | 103,677,120 |
| Size | 1.1 GB | 98.9 MB |
| Events in quadrant A | 8,498,348 | 690,049 |
| Events in quadrant B | 9,008,054 | 685,097 |
| Events in quadrant C | 9,363,793 | 655,668 |
| Events in quadrant D | 8,953,334 | 620,649 |
| Mode M0 | |||
|---|---|---|---|
| Quadrant | BADHDUFLAG | Total packets | Discarded packets |
| A | 0 | 30255 | 2 |
| B | 0 | 31720 | 1 |
| C | 0 | 32807 | 1 |
| D | 0 | 31660 | 1 |
| Mode SS | |||
|---|---|---|---|
| Quadrant | BADHDUFLAG | Total packets | Discarded packets |
| A | 0 | 140 | 0 |
| B | 0 | 140 | 0 |
| C | 0 | 140 | 0 |
| D | 0 | 140 | 0 |
| Mode M9 | |||
|---|---|---|---|
| Quadrant | BADHDUFLAG | Total packets | Discarded packets |
| A | 0 | 1 | 0 |
| B | 0 | 1 | 0 |
| C | 0 | 1 | 0 |
| D | 0 | 1 | 0 |
| Quadrant | Total seconds | Saturated seconds | Saturation percentage |
|---|---|---|---|
| A | 7017 | 10 | 0.142511% |
| B | 7017 | 33 | 0.470286% |
| C | 7017 | 35 | 0.498789% |
| D | 7017 | 500 | 7.125552% |
Noise dominated data is calculated using 1-second bins in cleaned event files. If a bin has >2000 counts, and if more than 50% of those come from <1% of pixels, then it is considered to be noise-dominated and hence unusable.
| Quadrant | # 1 sec bins | Bins with >0 counts | Bins with >2000 counts | High rate bins dominated by noise | Noise dominated (total time) | Noise dominated (detector-on time) | Marked lightcurve |
|---|---|---|---|---|---|---|---|
| A | 7042 | 7018 | 335 | 335 | 4.76% | 4.77% | 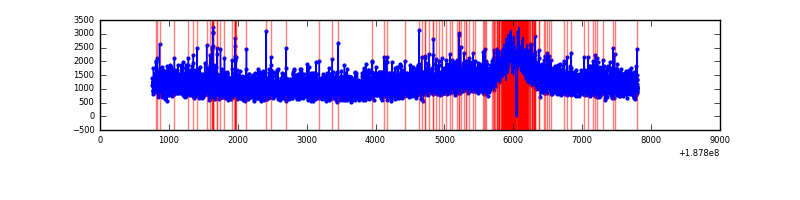 |
| B | 7042 | 7018 | 416 | 416 | 5.91% | 5.93% | 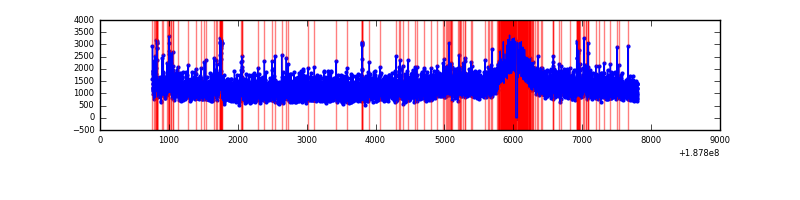 |
| C | 7042 | 7018 | 538 | 538 | 7.64% | 7.67% | 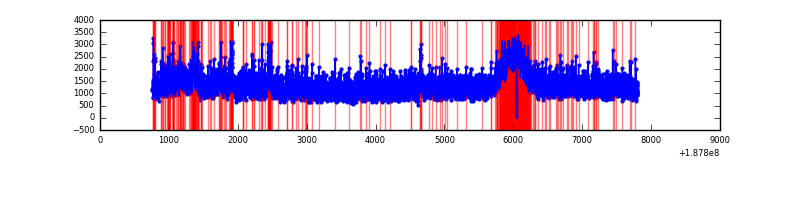 |
| D | 7042 | 7018 | 786 | 786 | 11.16% | 11.20% | 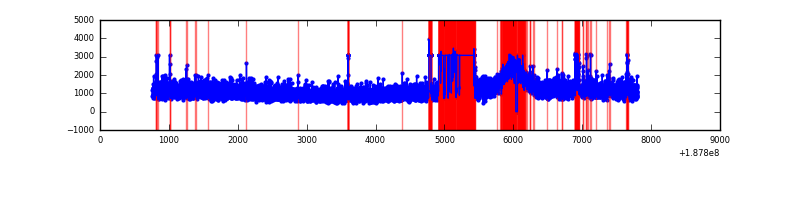 |
Top three noisy pixels from each quadrant. If the there are fewer than three noisy pixels in the level2.evt file, extra rows are filled as -1
| Pixel properties | Quadrant properties | ||||||
|---|---|---|---|---|---|---|---|
| Quadrant | DetID | PixID | Counts | Sigma | Mean | Median | Sigma |
| A | 14 | 5 | 70157 | 128.18 | 2195 | 2209 | 530.1 |
| A | 11 | 79 | 8780 | 12.39 | 2195 | 2209 | 530.1 |
| A | 12 | 243 | 7352 | 9.7 | 2195 | 2209 | 530.1 |
| B | 6 | 53 | 152658 | 278.71 | 2283 | 2292 | 539.5 |
| B | 15 | 22 | 53019 | 94.02 | 2283 | 2292 | 539.5 |
| B | 8 | 4 | 34480 | 59.66 | 2283 | 2292 | 539.5 |
| C | 12 | 206 | 655954 | 1103.62 | 2112 | 2186 | 592.4 |
| C | 15 | 241 | 337397 | 565.87 | 2112 | 2186 | 592.4 |
| C | 9 | 83 | 57276 | 93.0 | 2112 | 2186 | 592.4 |
| D | 2 | 16 | 1312341 | 2149.47 | 1967 | 2037 | 609.6 |
| D | 13 | 252 | 85402 | 136.75 | 1967 | 2037 | 609.6 |
| D | 2 | 107 | 82176 | 131.46 | 1967 | 2037 | 609.6 |
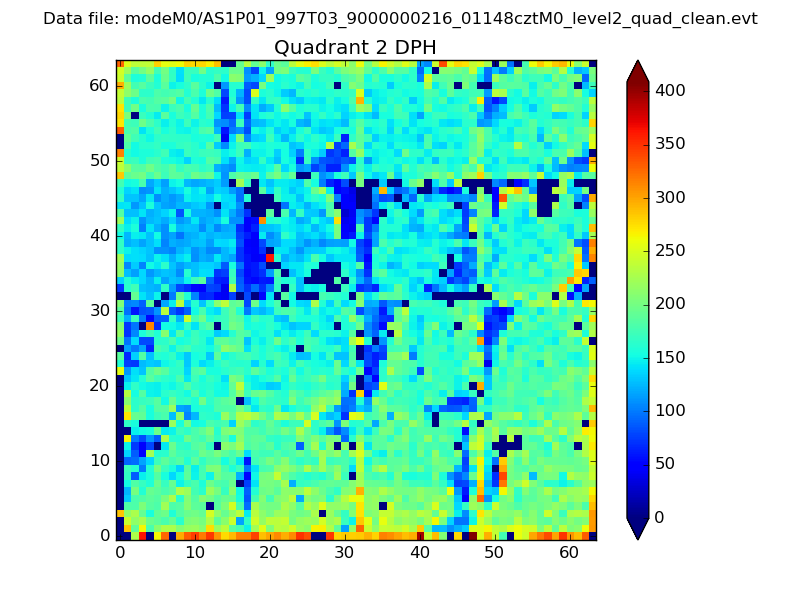
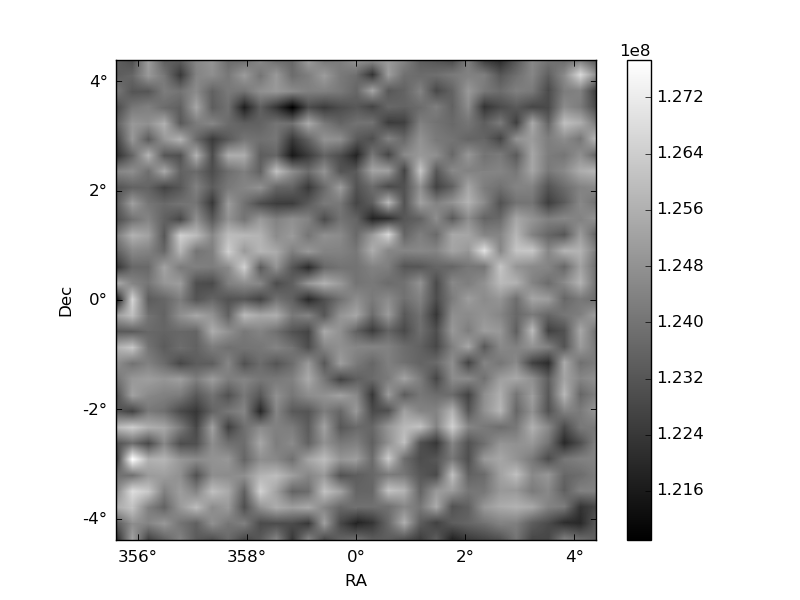
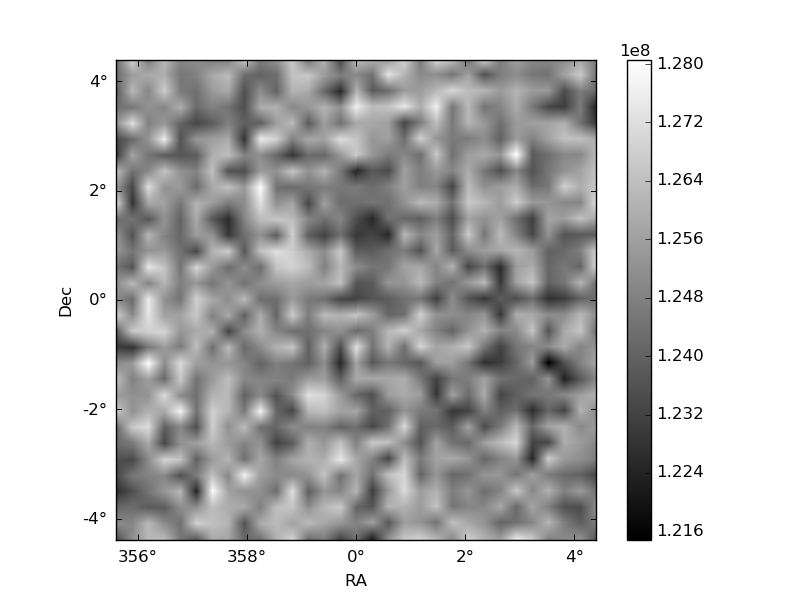
Histogram calculated using DETX and DETY for each event in the final _common_clean file
| Quadrant A | 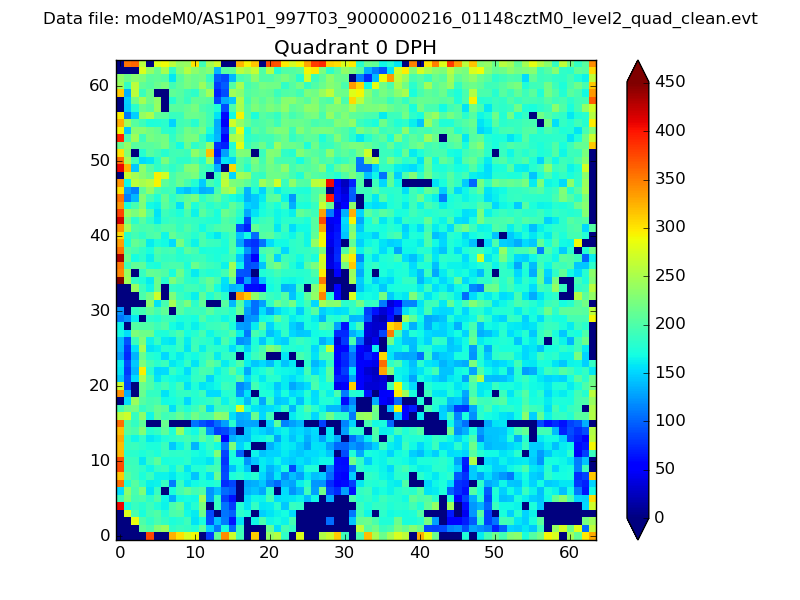 |
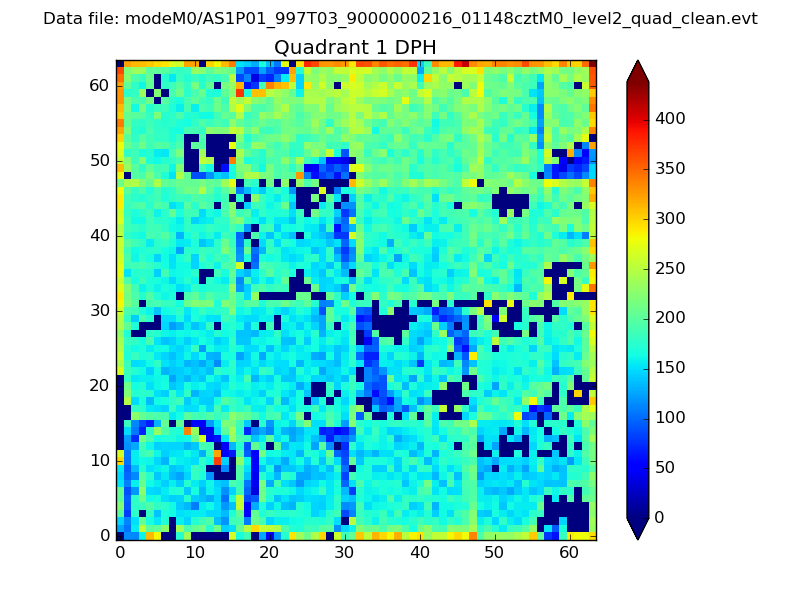 |
Quadrant B |
|---|---|---|---|
| Quadrant D | 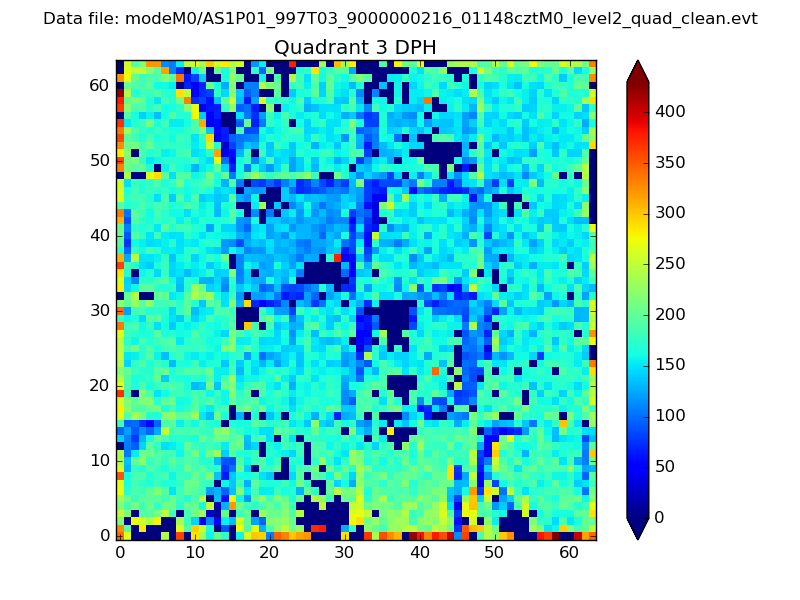 |
 |
Quadrant C |
| Plot type | Count rate plots | Images |
|---|---|---|
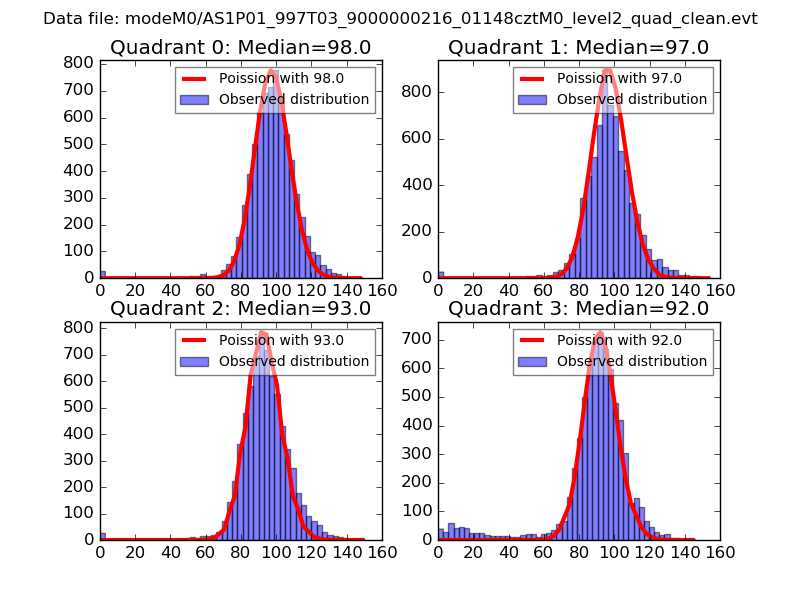
| Comparison with Poisson distribution Blue bars denote a histogram of data divided into 1 sec bins. Red curve is a Poisson curve with rate = median count rate of data. |
 |
 |
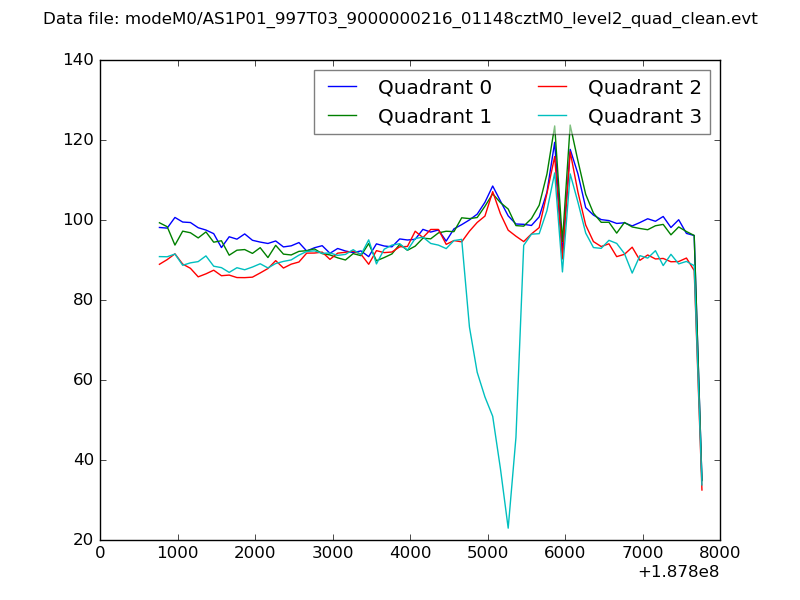
| Quadrant-wise count rates Data is divided into 100 sec bins |
 |
|
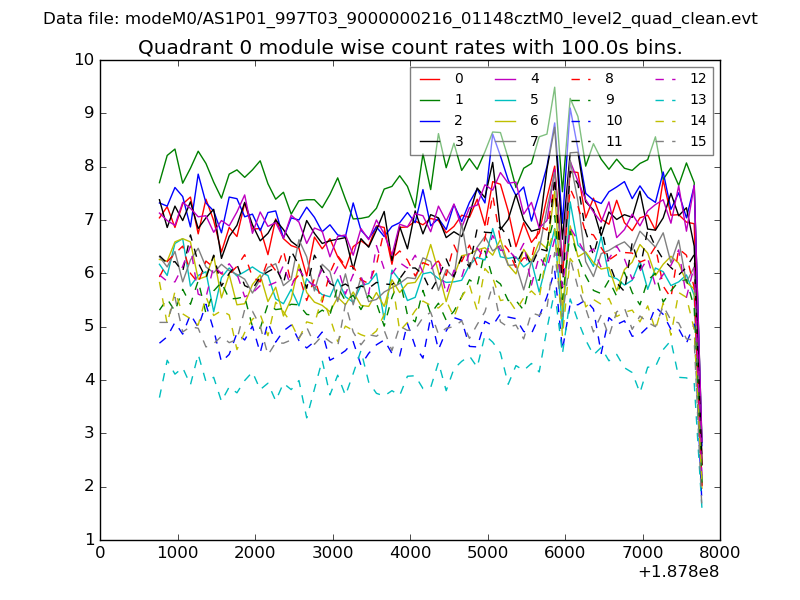
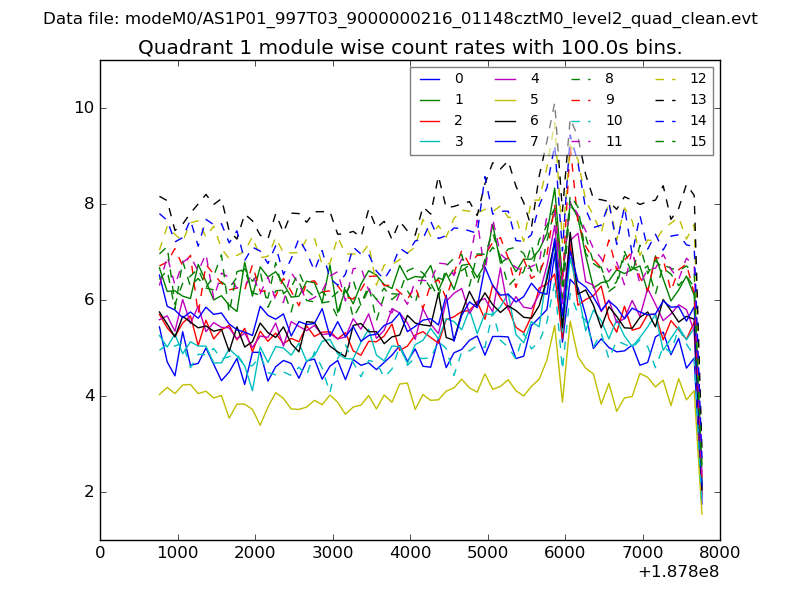
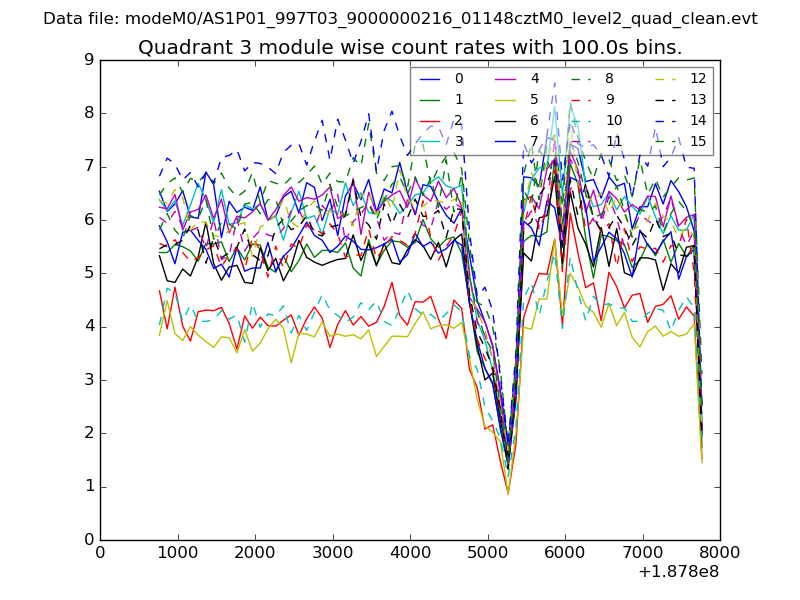
| Module-wise count rates for Quadrant A Data is divided into 100 sec bins |
 |
 |
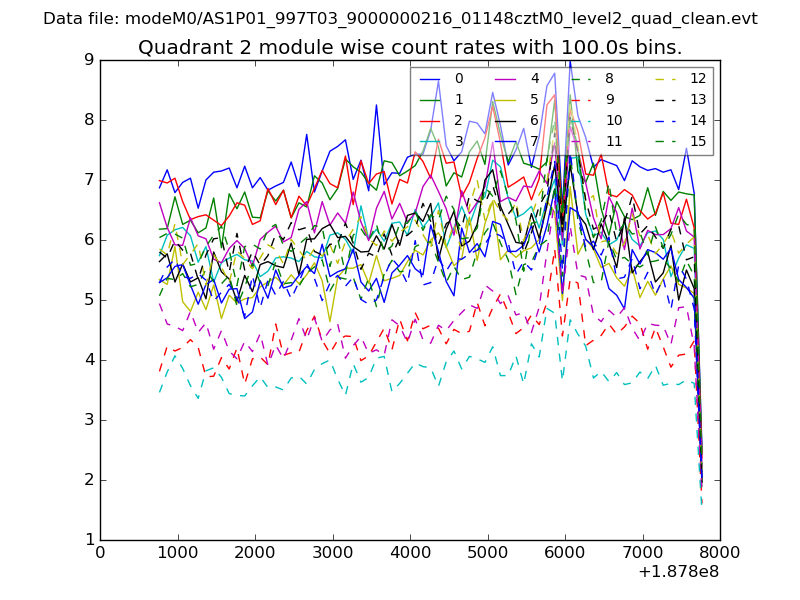
| Module-wise count rates for Quadrant B Data is divided into 100 sec bins |
 |
 |
| Module-wise count rates for Quadrant C Data is divided into 100 sec bins |
 |
 |
| Module-wise count rates for Quadrant D Data is divided into 100 sec bins |
 |
 |
| Parameter | Plot |
|---|---|
| CZT HV Monitor | 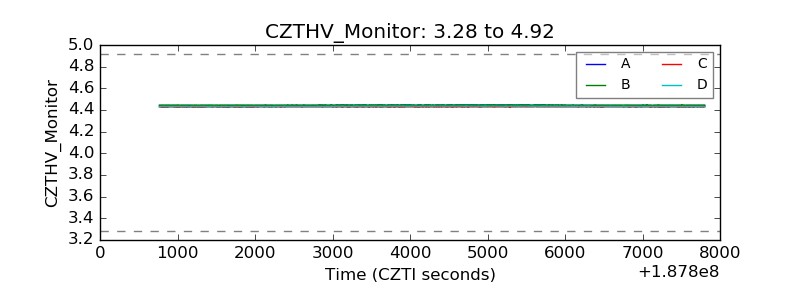 |
| D_VDD | 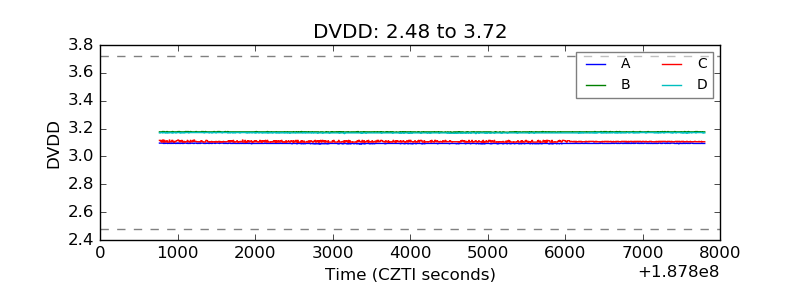 |
| Temperature 1 | 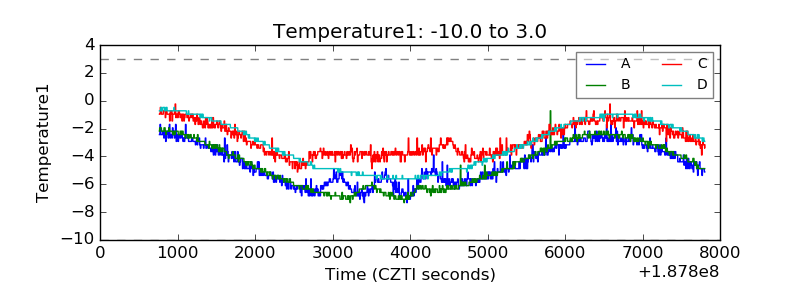 |
| Veto HV Monitor | 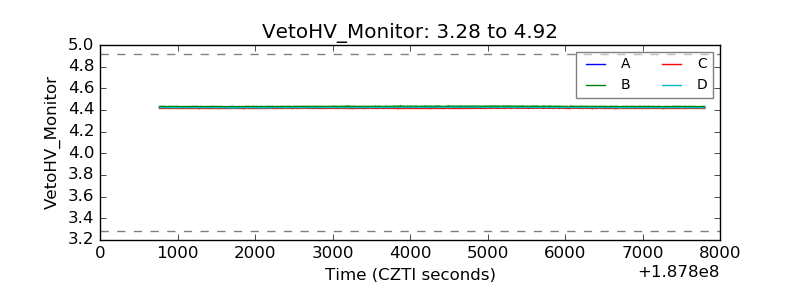 |
| Veto LLD | 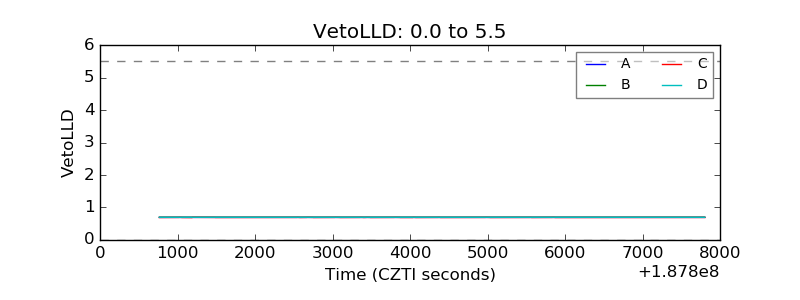 |
| Alpha Counter | 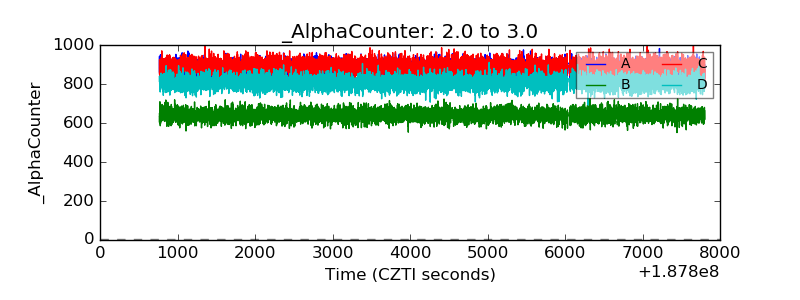 |
| _CPM_Rate | 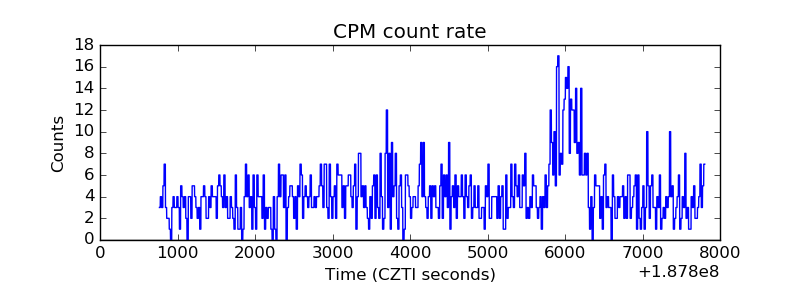 |
| CZT Counter | 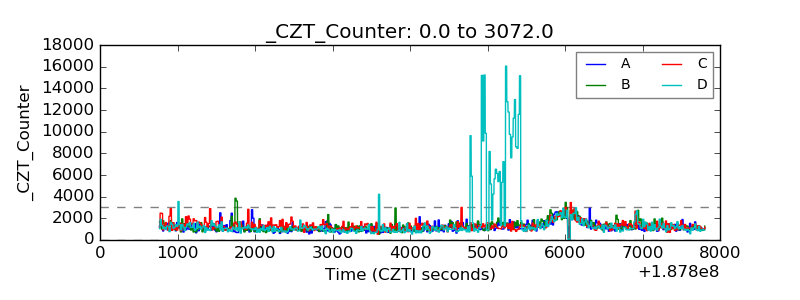 |
| +2.5 Volts monitor | 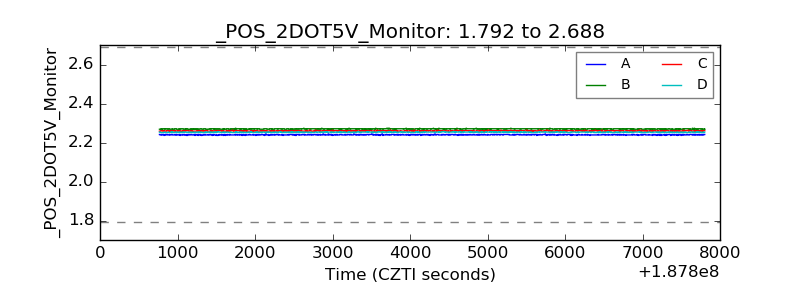 |
| +5 Volts monitor | 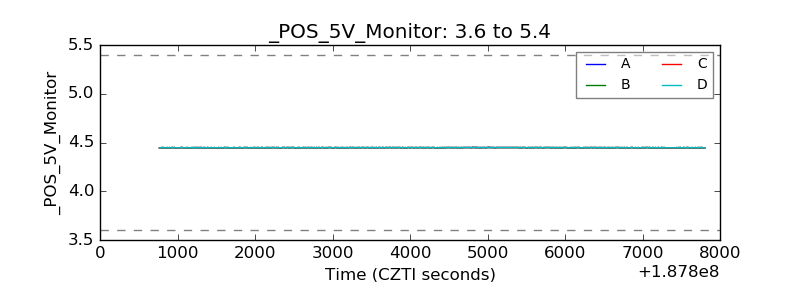 |
| _ROLL_ROT | 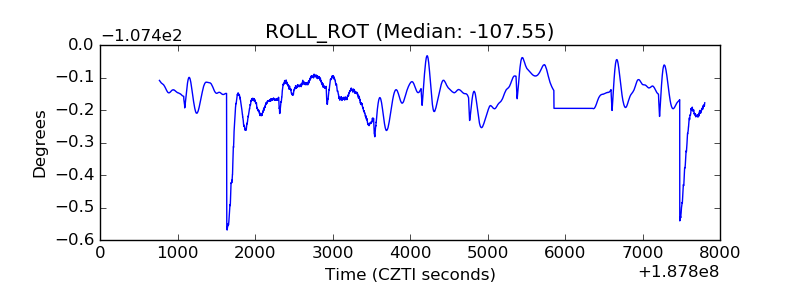 |
| _Roll_DEC | 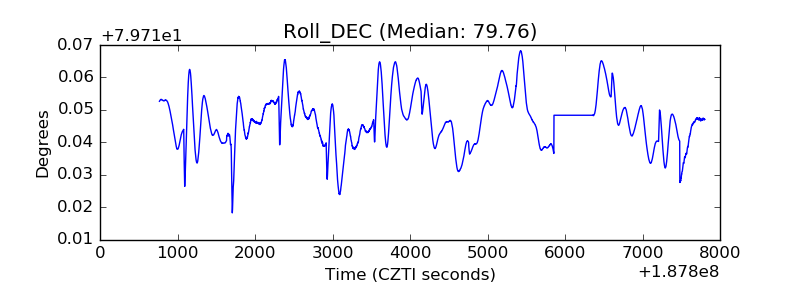 |
| _Roll_RA | 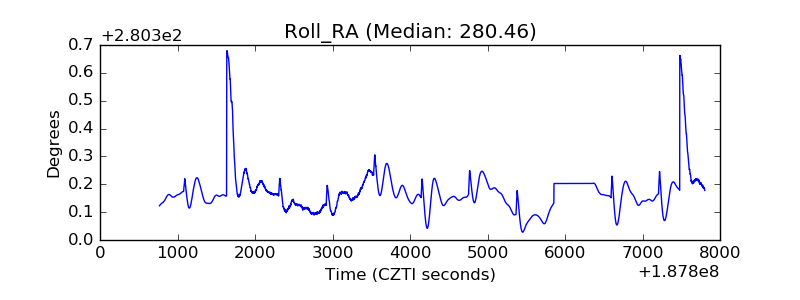 |
| Veto Counter | 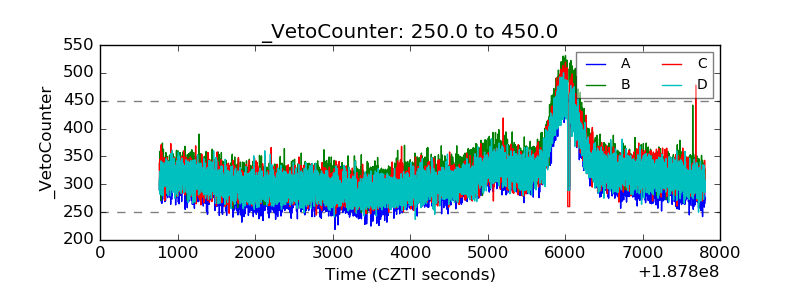 |