| Param | Original file | Final file |
|---|---|---|
| Filename | modeM0/AS1P01_997T03_9000000216_01150cztM0_level2.evt | modeM0/AS1P01_997T03_9000000216_01150cztM0_level2_quad_clean.evt |
| Size (bytes) | 1,143,486,720 | 104,509,440 |
| Size | 1.1 GB | 99.7 MB |
| Events in quadrant A | 8,190,616 | 685,528 |
| Events in quadrant B | 8,662,666 | 680,486 |
| Events in quadrant C | 9,762,096 | 652,444 |
| Events in quadrant D | 7,550,414 | 657,811 |
| Mode M0 | |||
|---|---|---|---|
| Quadrant | BADHDUFLAG | Total packets | Discarded packets |
| A | 0 | 29347 | 2 |
| B | 0 | 30713 | 1 |
| C | 0 | 33964 | 1 |
| D | 0 | 27474 | 1 |
| Mode SS | |||
|---|---|---|---|
| Quadrant | BADHDUFLAG | Total packets | Discarded packets |
| A | 0 | 144 | 0 |
| B | 0 | 144 | 0 |
| C | 0 | 144 | 0 |
| D | 0 | 144 | 0 |
| Mode M9 | |||
|---|---|---|---|
| Quadrant | BADHDUFLAG | Total packets | Discarded packets |
| A | 0 | 5 | 0 |
| B | 0 | 5 | 0 |
| C | 0 | 5 | 0 |
| D | 0 | 5 | 0 |
| Quadrant | Total seconds | Saturated seconds | Saturation percentage |
|---|---|---|---|
| A | 7011 | 2 | 0.028527% |
| B | 7011 | 15 | 0.213950% |
| C | 7011 | 151 | 2.153758% |
| D | 7011 | 13 | 0.185423% |
Noise dominated data is calculated using 1-second bins in cleaned event files. If a bin has >2000 counts, and if more than 50% of those come from <1% of pixels, then it is considered to be noise-dominated and hence unusable.
| Quadrant | # 1 sec bins | Bins with >0 counts | Bins with >2000 counts | High rate bins dominated by noise | Noise dominated (total time) | Noise dominated (detector-on time) | Marked lightcurve |
|---|---|---|---|---|---|---|---|
| A | 7546 | 7012 | 131 | 131 | 1.74% | 1.87% |  |
| B | 7546 | 7012 | 196 | 196 | 2.60% | 2.80% | 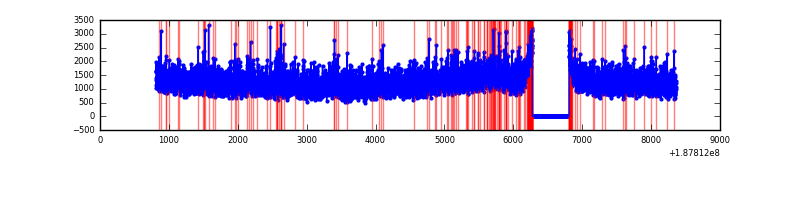 |
| C | 7546 | 7011 | 654 | 654 | 8.67% | 9.33% | 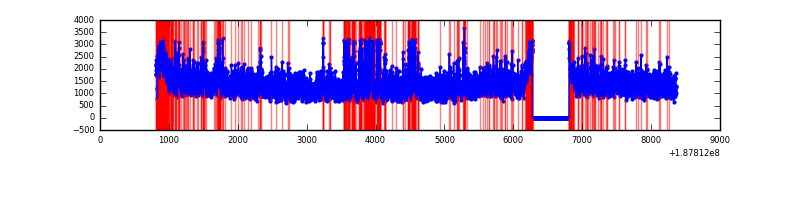 |
| D | 7546 | 7012 | 108 | 108 | 1.43% | 1.54% | 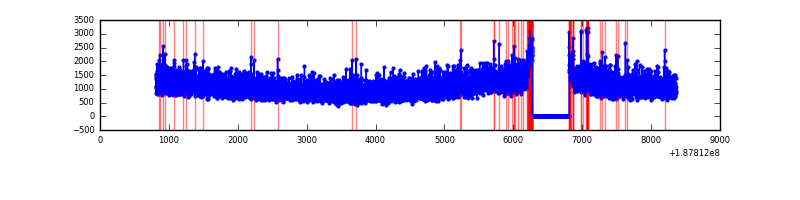 |
Top three noisy pixels from each quadrant. If the there are fewer than three noisy pixels in the level2.evt file, extra rows are filled as -1
| Pixel properties | Quadrant properties | ||||||
|---|---|---|---|---|---|---|---|
| Quadrant | DetID | PixID | Counts | Sigma | Mean | Median | Sigma |
| A | 12 | 243 | 9260 | 13.91 | 2133 | 2146 | 511.3 |
| A | 3 | 111 | 6875 | 9.25 | 2133 | 2146 | 511.3 |
| A | 11 | 79 | 6743 | 8.99 | 2133 | 2146 | 511.3 |
| B | 10 | 252 | 77094 | 142.71 | 2228 | 2238 | 524.5 |
| B | 5 | 249 | 20779 | 35.35 | 2228 | 2238 | 524.5 |
| B | 15 | 22 | 19801 | 33.48 | 2228 | 2238 | 524.5 |
| C | 12 | 206 | 1212219 | 2107.92 | 2054 | 2129 | 574.1 |
| C | 15 | 241 | 322572 | 558.2 | 2054 | 2129 | 574.1 |
| C | 9 | 52 | 127235 | 217.93 | 2054 | 2129 | 574.1 |
| D | 13 | 138 | 33810 | 51.66 | 1988 | 2060 | 614.6 |
| D | 13 | 252 | 26253 | 39.36 | 1988 | 2060 | 614.6 |
| D | 10 | 125 | 23193 | 34.38 | 1988 | 2060 | 614.6 |
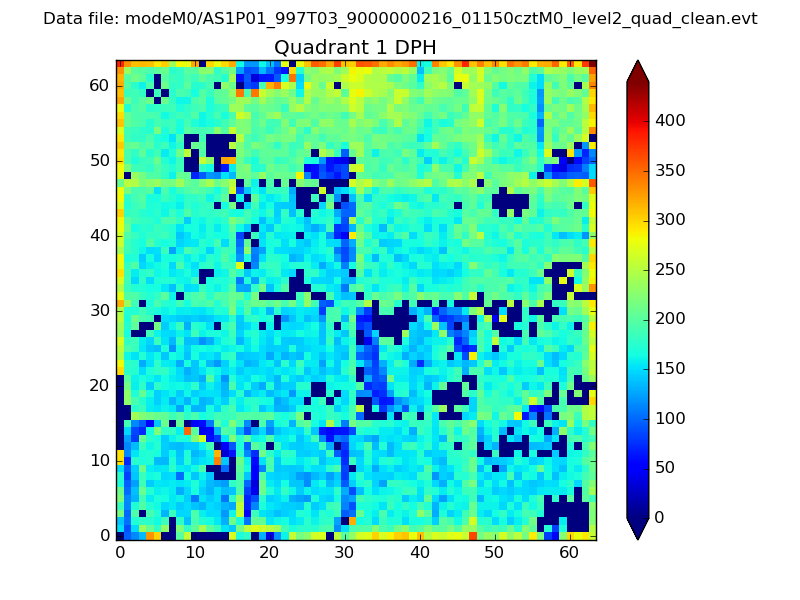
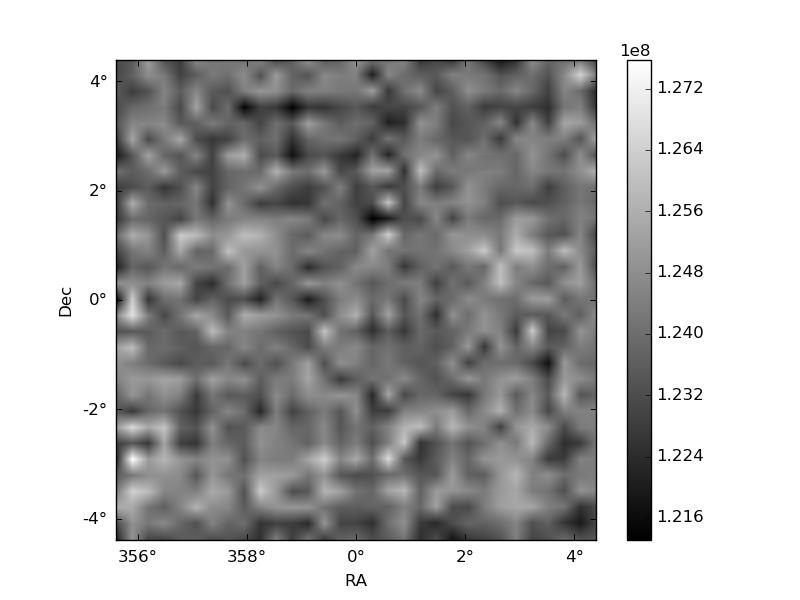
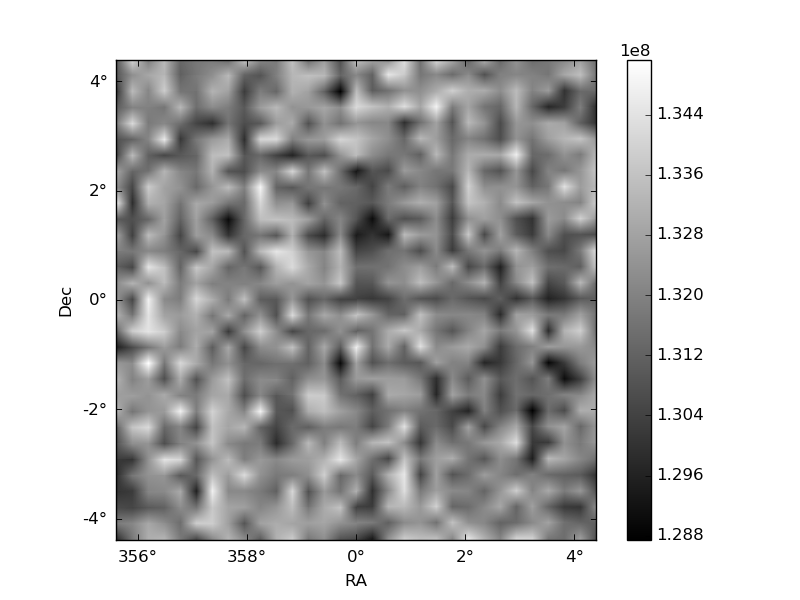
Histogram calculated using DETX and DETY for each event in the final _common_clean file
| Quadrant A | 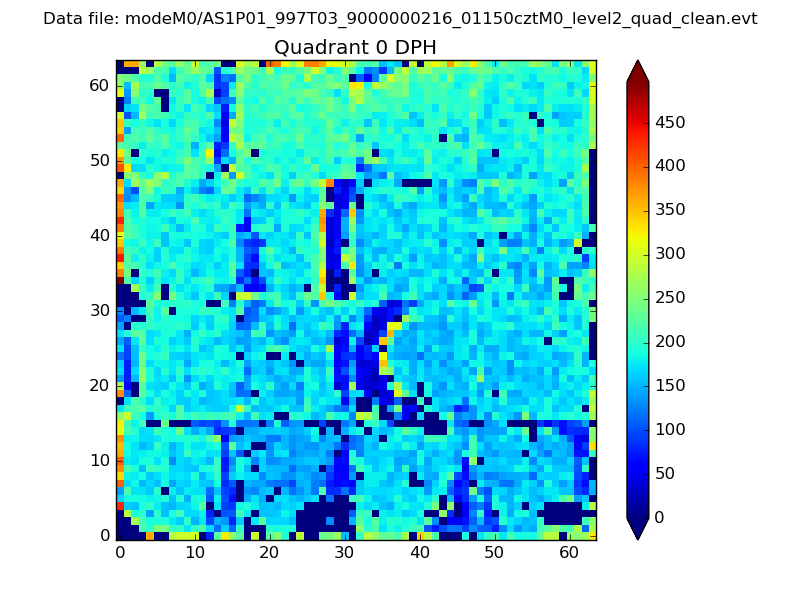 |
 |
Quadrant B |
|---|---|---|---|
| Quadrant D | 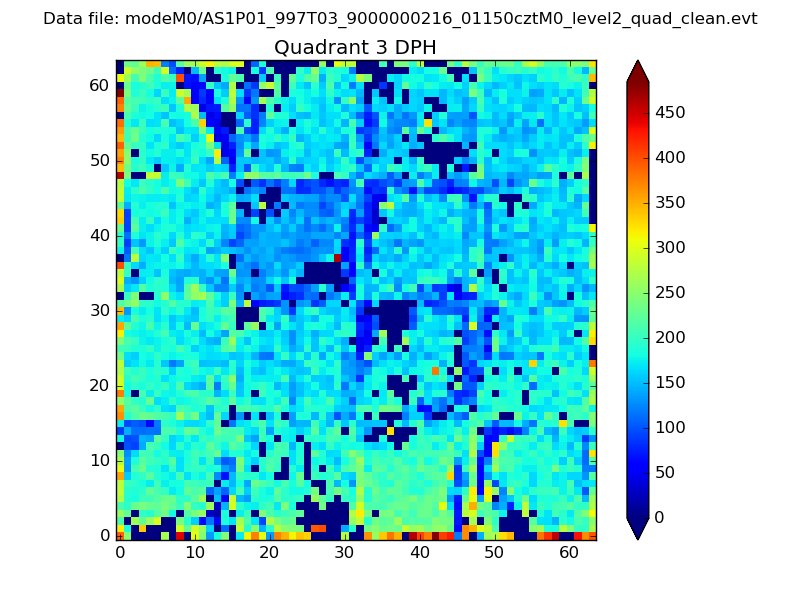 |
 |
Quadrant C |
| Plot type | Count rate plots | Images |
|---|---|---|
| Comparison with Poisson distribution Blue bars denote a histogram of data divided into 1 sec bins. Red curve is a Poisson curve with rate = median count rate of data. |
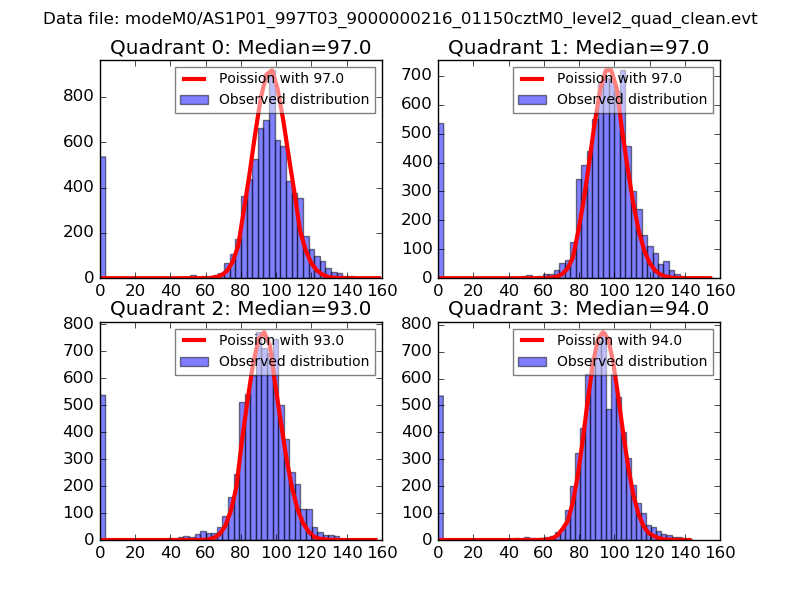 |
 |
| Quadrant-wise count rates Data is divided into 100 sec bins |
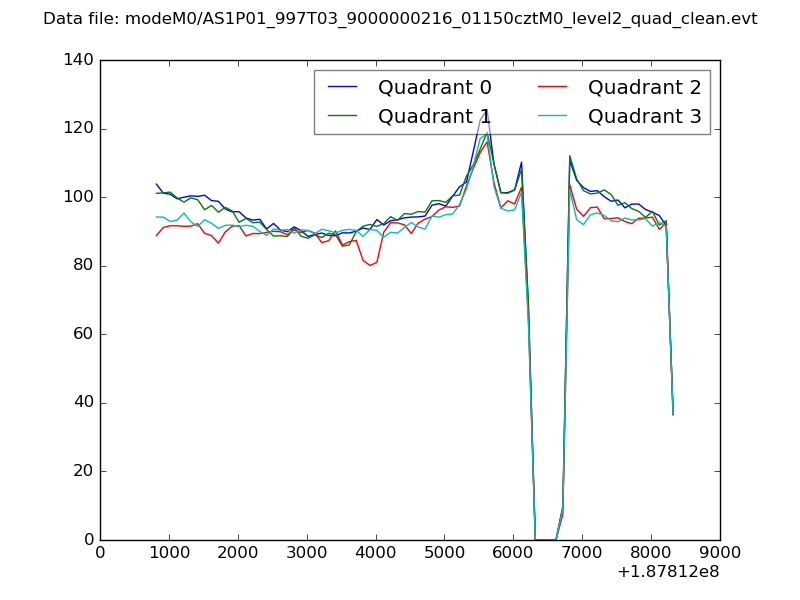 |
|
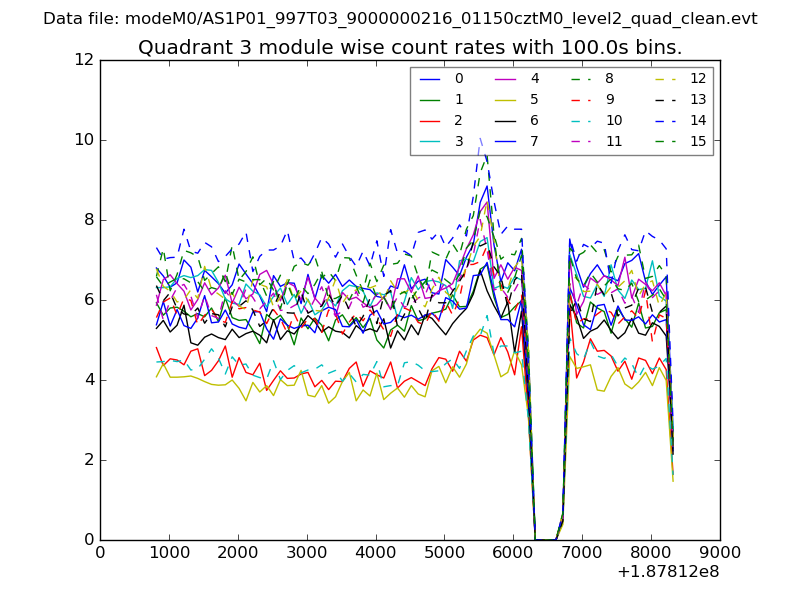
| Module-wise count rates for Quadrant A Data is divided into 100 sec bins |
 |
 |
| Module-wise count rates for Quadrant B Data is divided into 100 sec bins |
 |
 |
| Module-wise count rates for Quadrant C Data is divided into 100 sec bins |
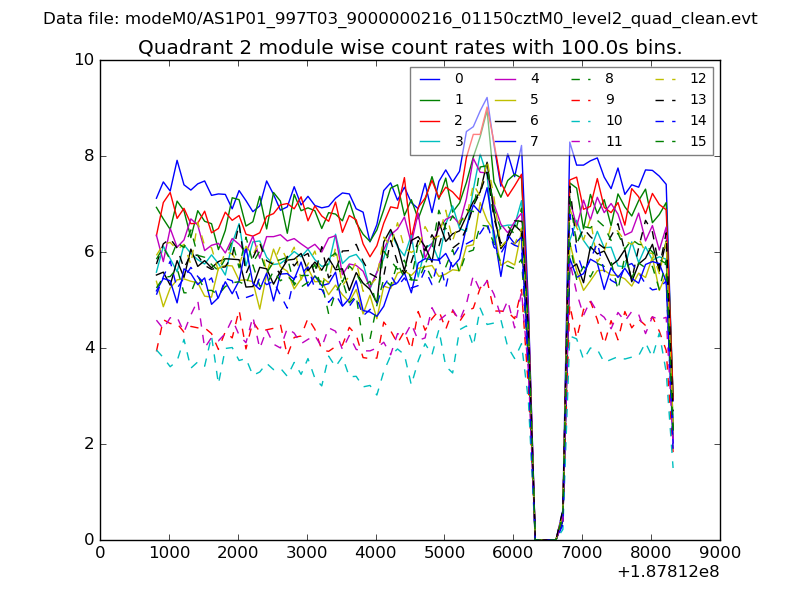 |
 |
| Module-wise count rates for Quadrant D Data is divided into 100 sec bins |
 |
 |
| Parameter | Plot |
|---|---|
| CZT HV Monitor | 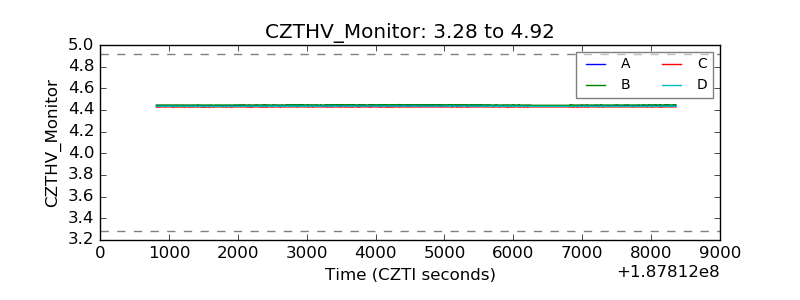 |
| D_VDD | 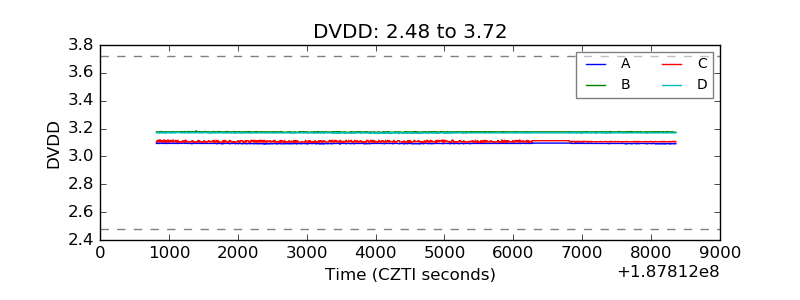 |
| Temperature 1 | 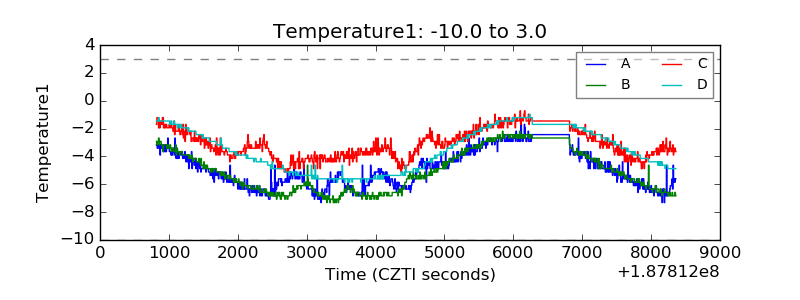 |
| Veto HV Monitor | 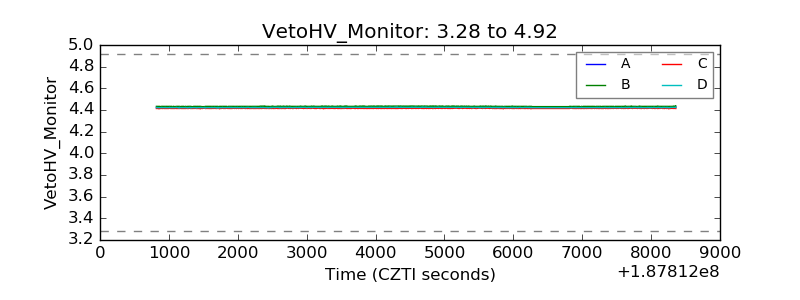 |
| Veto LLD | 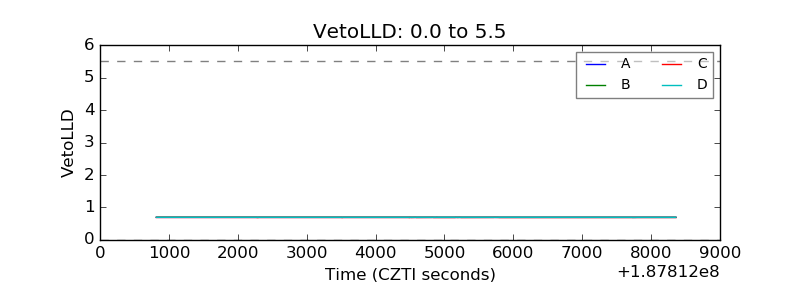 |
| Alpha Counter | 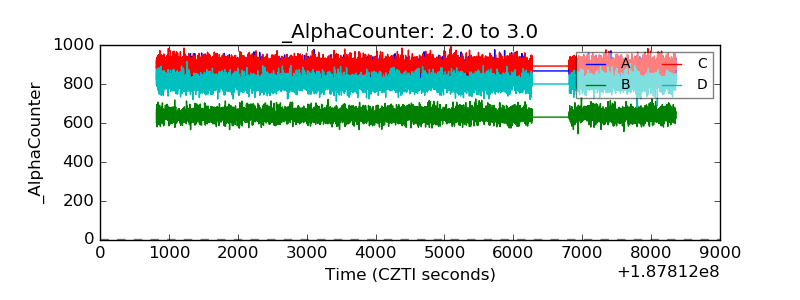 |
| _CPM_Rate | 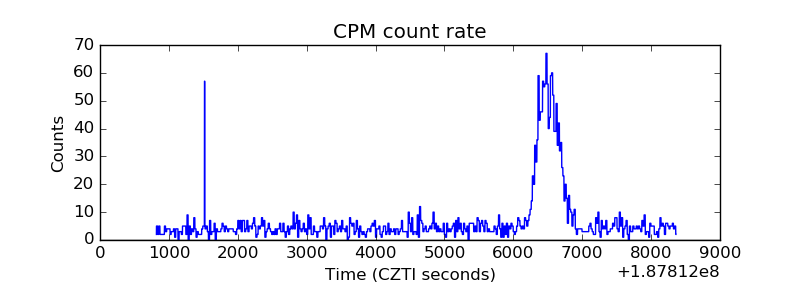 |
| CZT Counter | 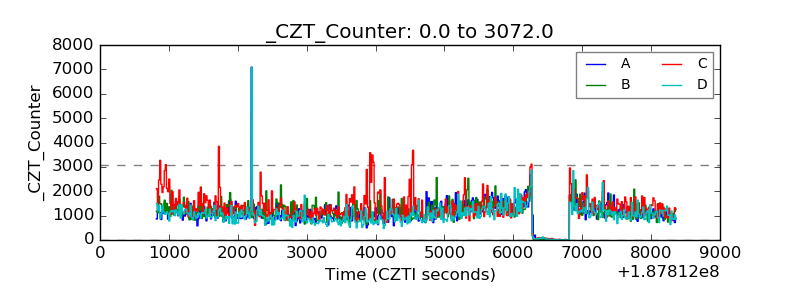 |
| +2.5 Volts monitor |  |
| +5 Volts monitor |  |
| _ROLL_ROT | 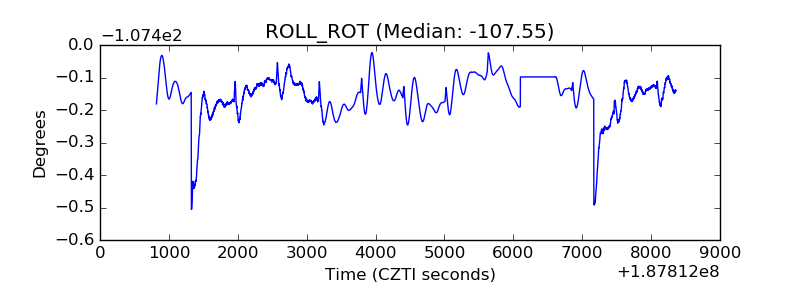 |
| _Roll_DEC | 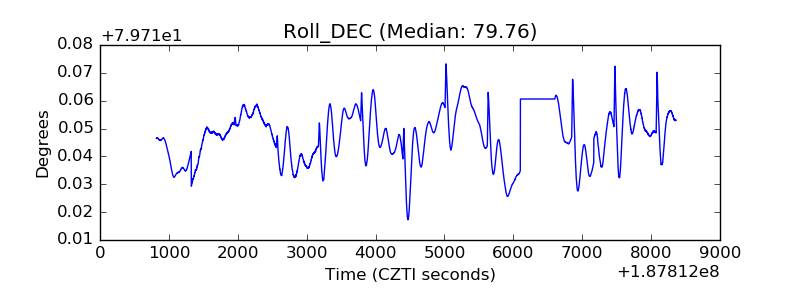 |
| _Roll_RA | 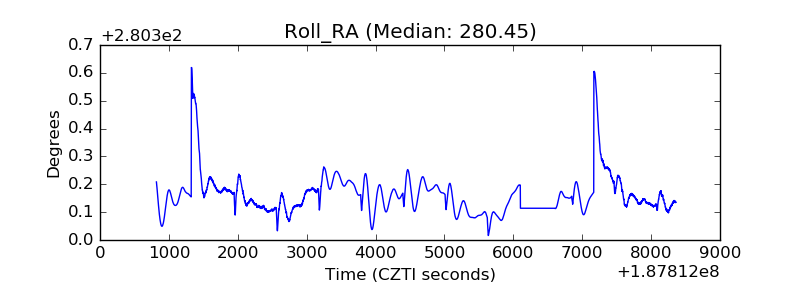 |
| Veto Counter | 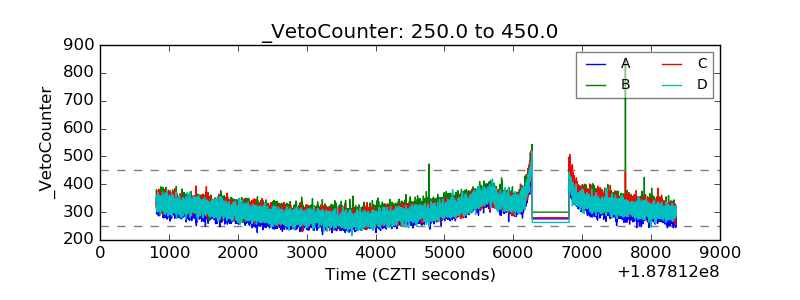 |