| Param | Original file | Final file |
|---|---|---|
| Filename | modeM0/AS1P01_997T03_9000000216_01152cztM0_level2.evt | modeM0/AS1P01_997T03_9000000216_01152cztM0_level2_quad_clean.evt |
| Size (bytes) | 1,106,305,920 | 109,368,000 |
| Size | 1.0 GB | 104.3 MB |
| Events in quadrant A | 8,160,148 | 719,401 |
| Events in quadrant B | 8,703,805 | 708,500 |
| Events in quadrant C | 8,749,179 | 695,730 |
| Events in quadrant D | 7,426,575 | 700,478 |
| Mode M0 | |||
|---|---|---|---|
| Quadrant | BADHDUFLAG | Total packets | Discarded packets |
| A | 0 | 29201 | 3 |
| B | 0 | 30856 | 2 |
| C | 0 | 30943 | 2 |
| D | 0 | 27089 | 2 |
| Mode SS | |||
|---|---|---|---|
| Quadrant | BADHDUFLAG | Total packets | Discarded packets |
| A | 0 | 146 | 0 |
| B | 0 | 146 | 0 |
| C | 0 | 146 | 0 |
| D | 0 | 146 | 0 |
| Mode M9 | |||
|---|---|---|---|
| Quadrant | BADHDUFLAG | Total packets | Discarded packets |
| A | 0 | 16 | 0 |
| B | 0 | 16 | 0 |
| C | 0 | 16 | 0 |
| D | 0 | 16 | 0 |
| Quadrant | Total seconds | Saturated seconds | Saturation percentage |
|---|---|---|---|
| A | 7004 | 4 | 0.057110% |
| B | 7004 | 11 | 0.157053% |
| C | 7004 | 18 | 0.256996% |
| D | 7004 | 3 | 0.042833% |
Noise dominated data is calculated using 1-second bins in cleaned event files. If a bin has >2000 counts, and if more than 50% of those come from <1% of pixels, then it is considered to be noise-dominated and hence unusable.
| Quadrant | # 1 sec bins | Bins with >0 counts | Bins with >2000 counts | High rate bins dominated by noise | Noise dominated (total time) | Noise dominated (detector-on time) | Marked lightcurve |
|---|---|---|---|---|---|---|---|
| A | 8644 | 7006 | 142 | 142 | 1.64% | 2.03% |  |
| B | 8644 | 7006 | 252 | 252 | 2.92% | 3.60% | 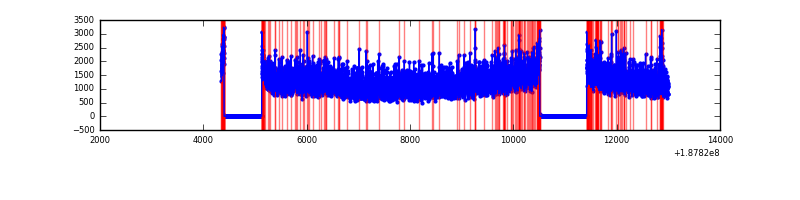 |
| C | 8644 | 7006 | 288 | 288 | 3.33% | 4.11% | 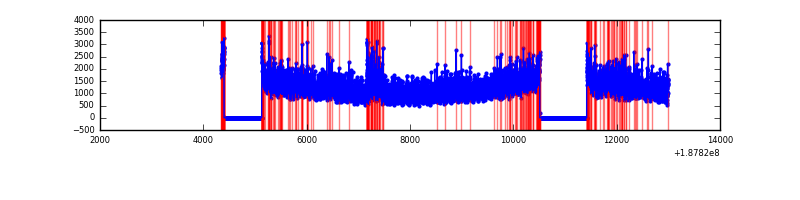 |
| D | 8644 | 7006 | 100 | 100 | 1.16% | 1.43% | 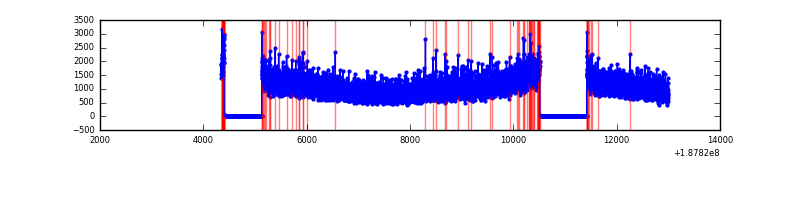 |
Top three noisy pixels from each quadrant. If the there are fewer than three noisy pixels in the level2.evt file, extra rows are filled as -1
| Pixel properties | Quadrant properties | ||||||
|---|---|---|---|---|---|---|---|
| Quadrant | DetID | PixID | Counts | Sigma | Mean | Median | Sigma |
| A | 11 | 79 | 10152 | 15.78 | 2125 | 2144 | 507.4 |
| A | 3 | 111 | 7102 | 9.77 | 2125 | 2144 | 507.4 |
| A | 13 | 9 | 6336 | 8.26 | 2125 | 2144 | 507.4 |
| B | 8 | 4 | 85781 | 160.67 | 2233 | 2249 | 519.9 |
| B | 0 | 220 | 38772 | 70.25 | 2233 | 2249 | 519.9 |
| B | 15 | 22 | 19713 | 33.59 | 2233 | 2249 | 519.9 |
| C | 15 | 241 | 317398 | 551.94 | 2047 | 2124 | 571.2 |
| C | 12 | 206 | 189510 | 328.05 | 2047 | 2124 | 571.2 |
| C | 9 | 83 | 157409 | 271.85 | 2047 | 2124 | 571.2 |
| D | 2 | 152 | 26960 | 40.7 | 1970 | 2045 | 612.2 |
| D | 13 | 252 | 19591 | 28.66 | 1970 | 2045 | 612.2 |
| D | 13 | 189 | 13954 | 19.45 | 1970 | 2045 | 612.2 |
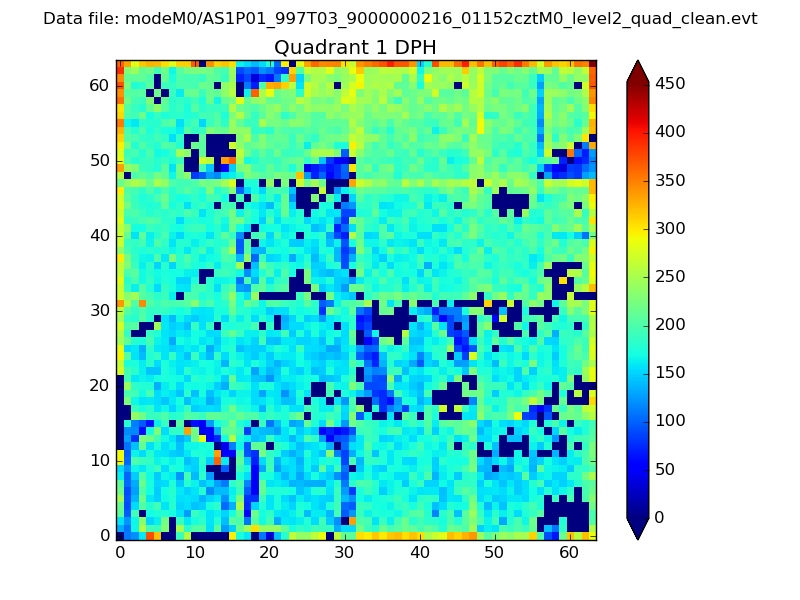
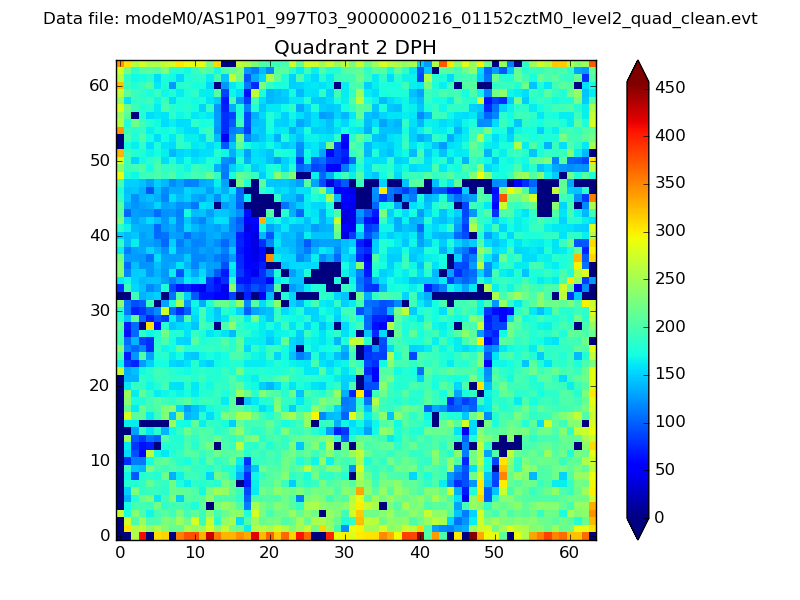
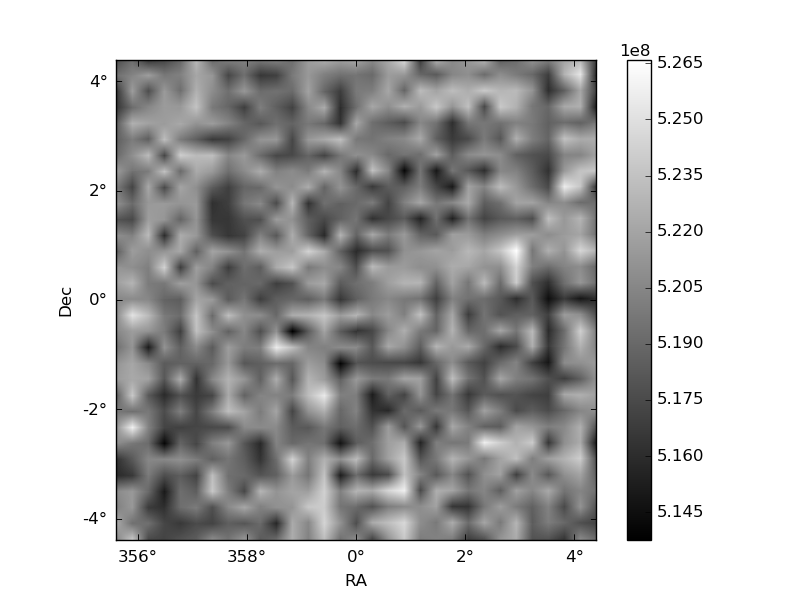
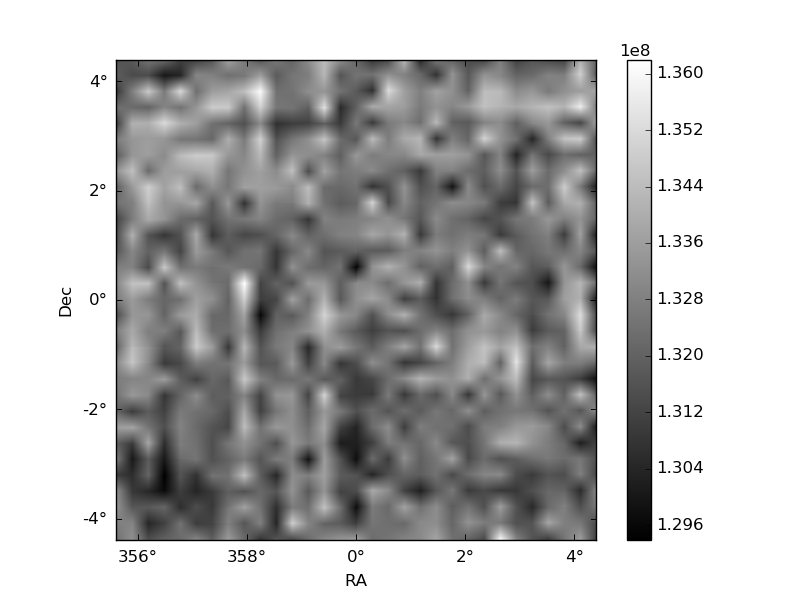
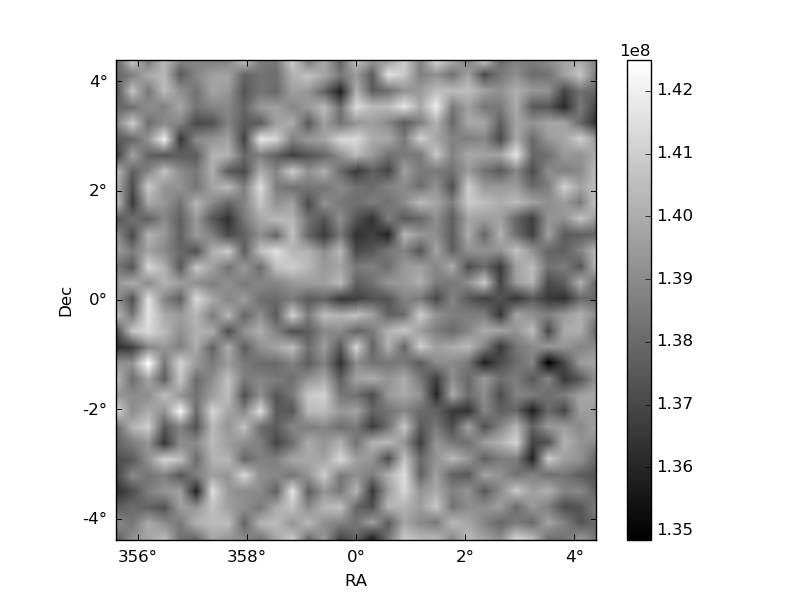
Histogram calculated using DETX and DETY for each event in the final _common_clean file
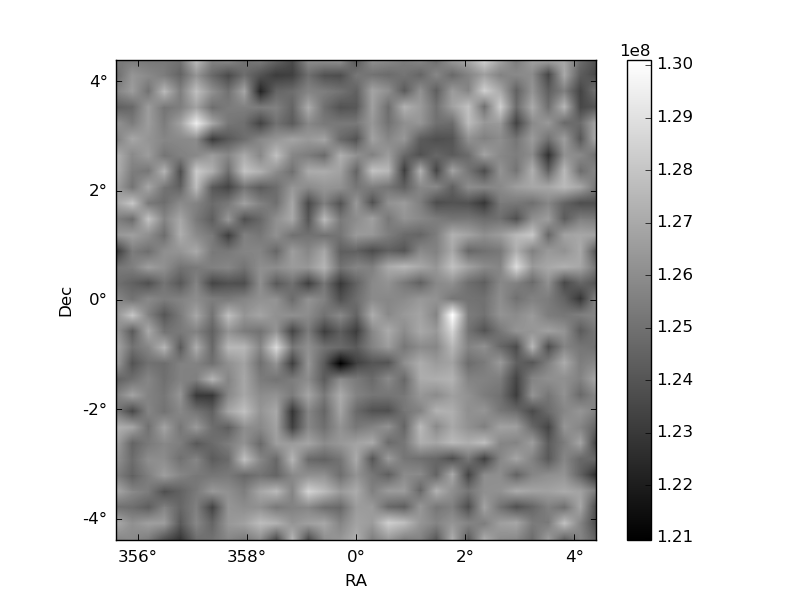
| Quadrant A | 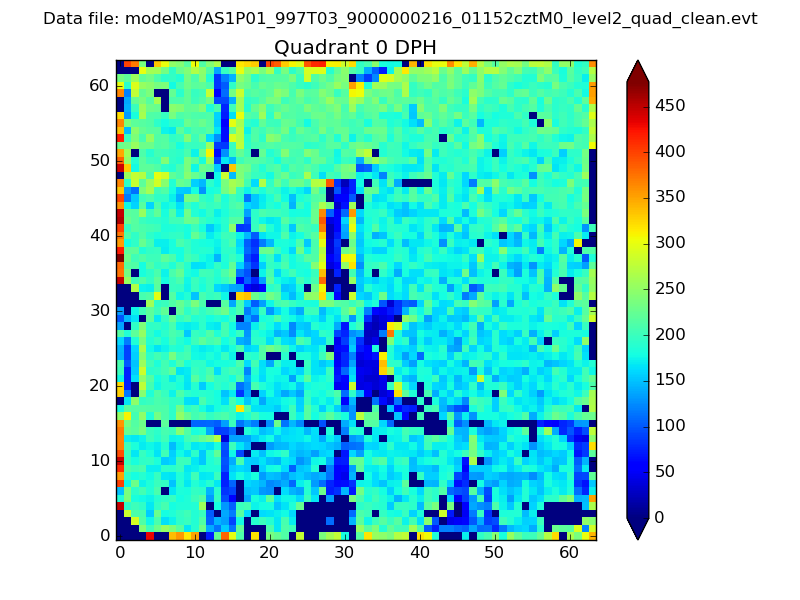 |
 |
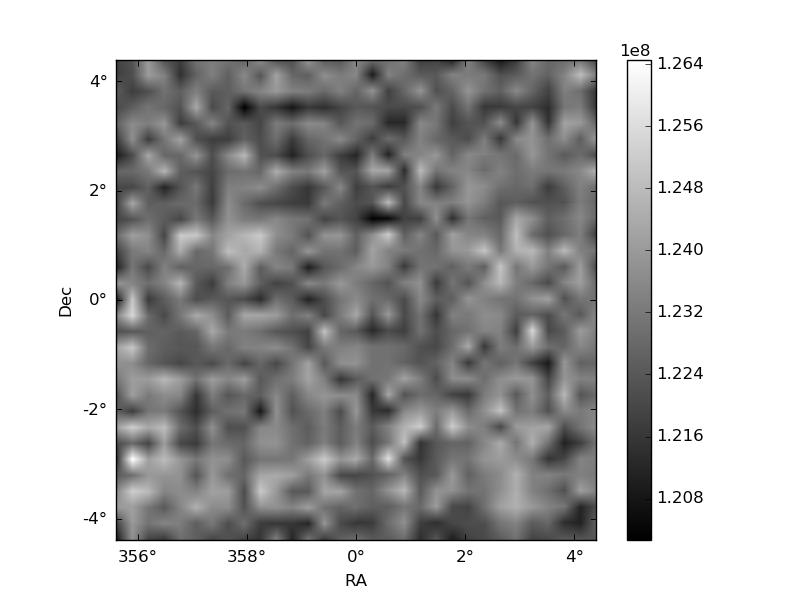
Quadrant B |
|---|---|---|---|
| Quadrant D | 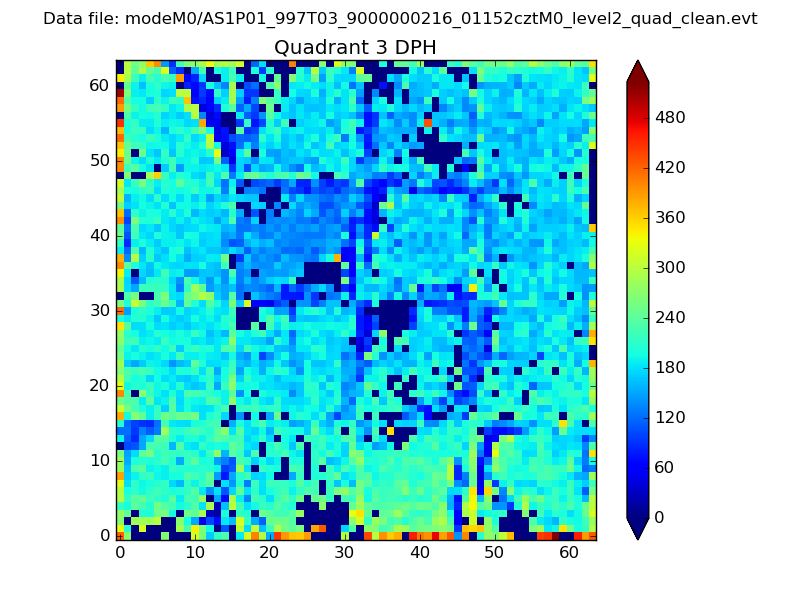 |
 |
Quadrant C |
| Plot type | Count rate plots | Images |
|---|---|---|
| Comparison with Poisson distribution Blue bars denote a histogram of data divided into 1 sec bins. Red curve is a Poisson curve with rate = median count rate of data. |
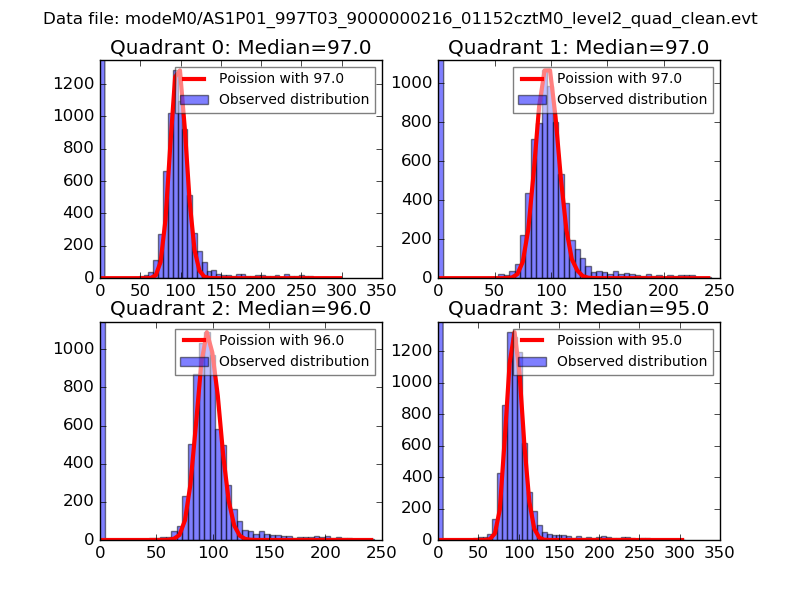 |
 |
| Quadrant-wise count rates Data is divided into 100 sec bins |
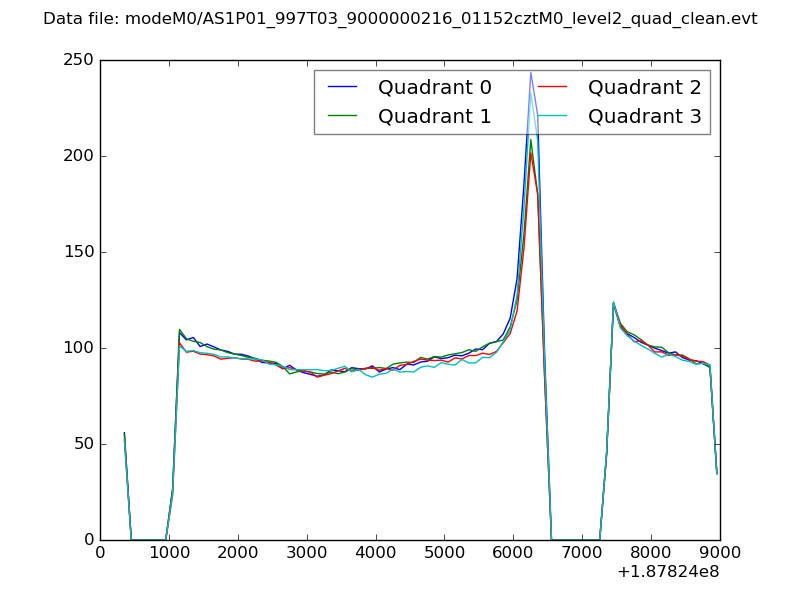 |
|
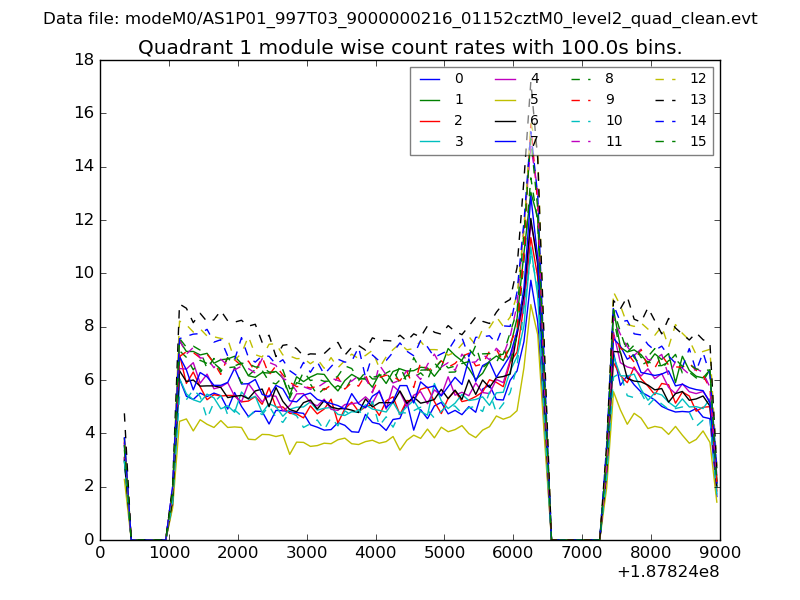
| Module-wise count rates for Quadrant A Data is divided into 100 sec bins |
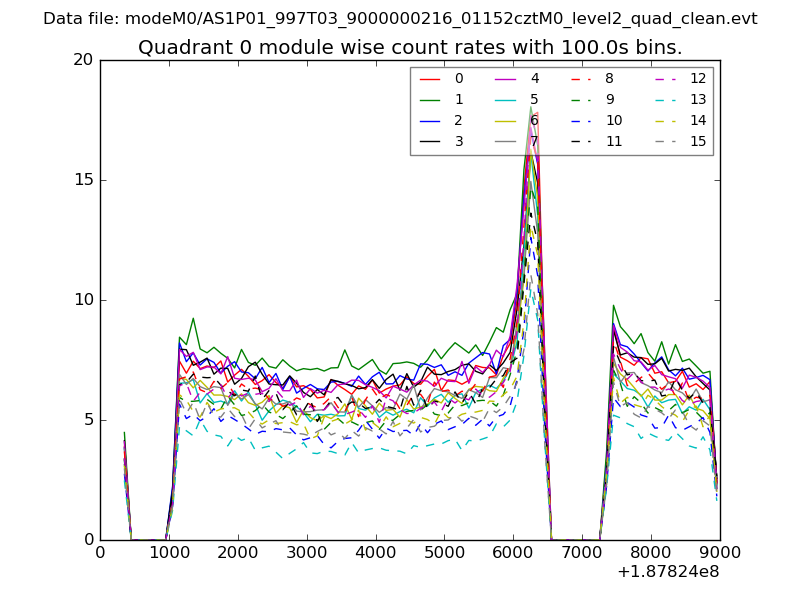 |
 |
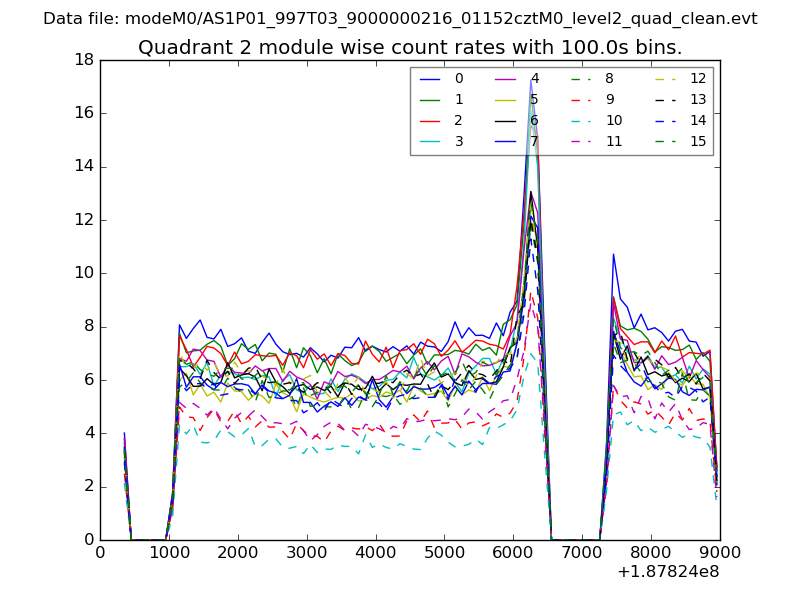
| Module-wise count rates for Quadrant B Data is divided into 100 sec bins |
 |
 |
| Module-wise count rates for Quadrant C Data is divided into 100 sec bins |
 |
 |
| Module-wise count rates for Quadrant D Data is divided into 100 sec bins |
 |
 |
| Parameter | Plot |
|---|---|
| CZT HV Monitor | 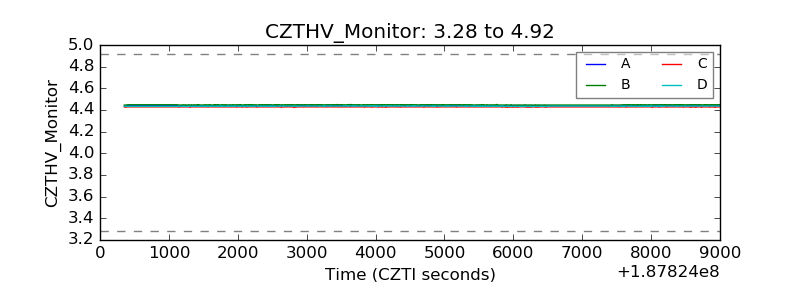 |
| D_VDD | 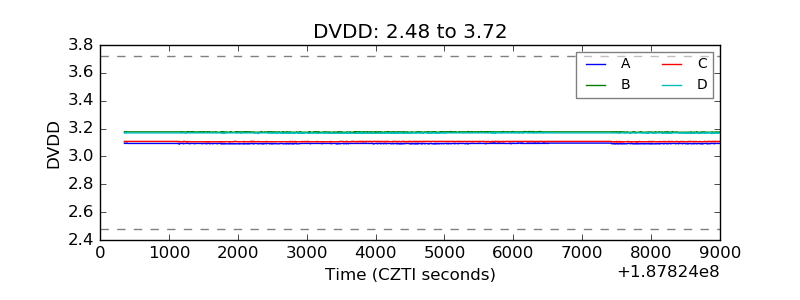 |
| Temperature 1 | 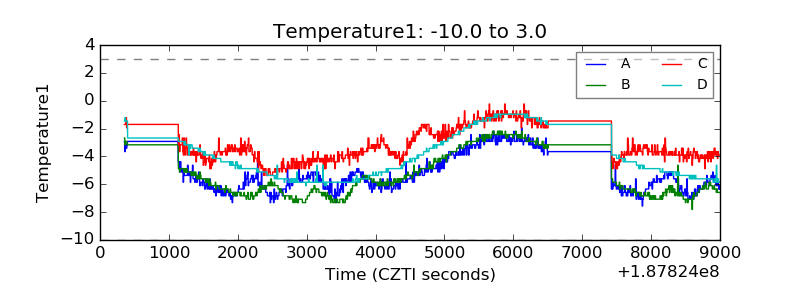 |
| Veto HV Monitor | 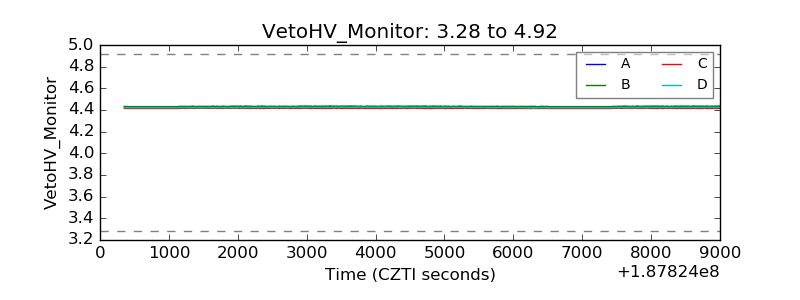 |
| Veto LLD | 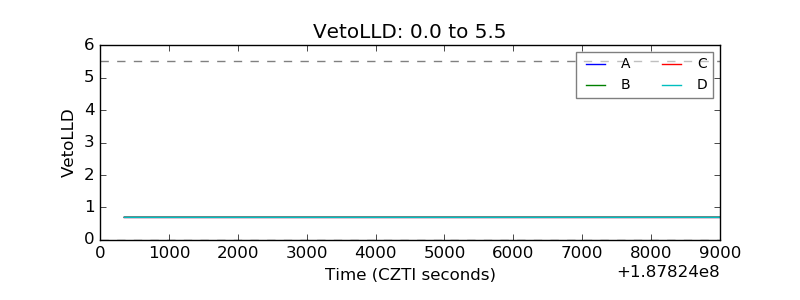 |
| Alpha Counter | 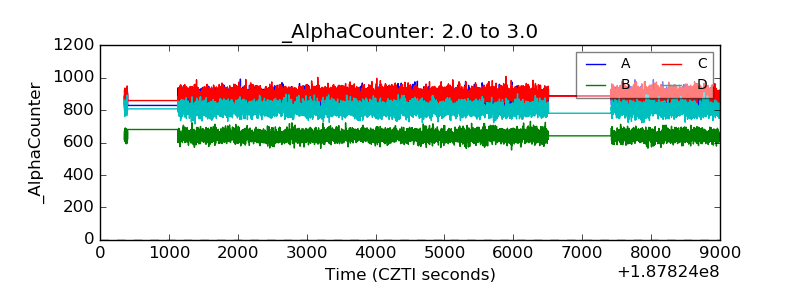 |
| _CPM_Rate | 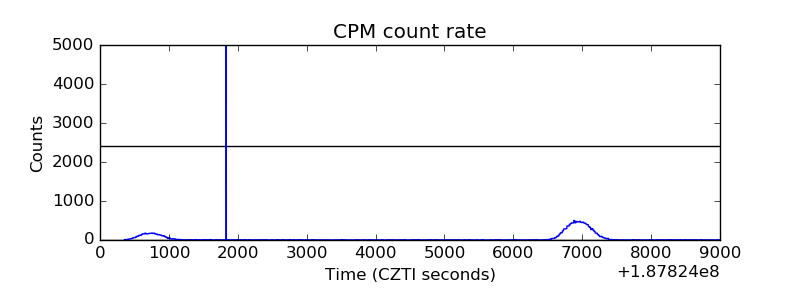 |
| CZT Counter | 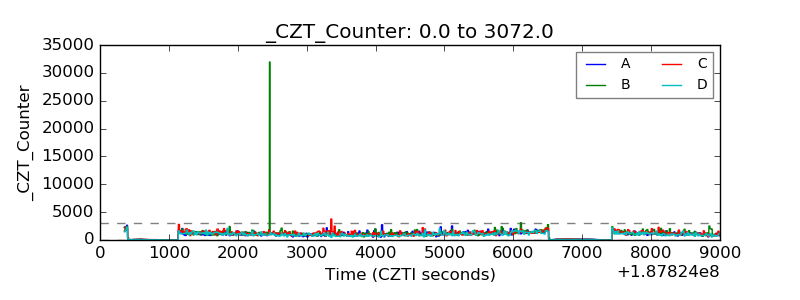 |
| +2.5 Volts monitor |  |
| +5 Volts monitor |  |
| _ROLL_ROT |  |
| _Roll_DEC |  |
| _Roll_RA | 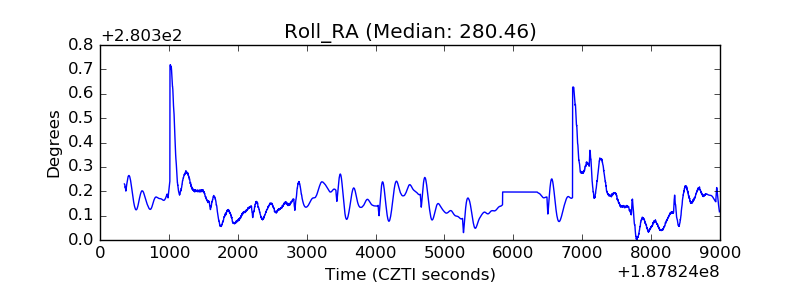 |
| Veto Counter | 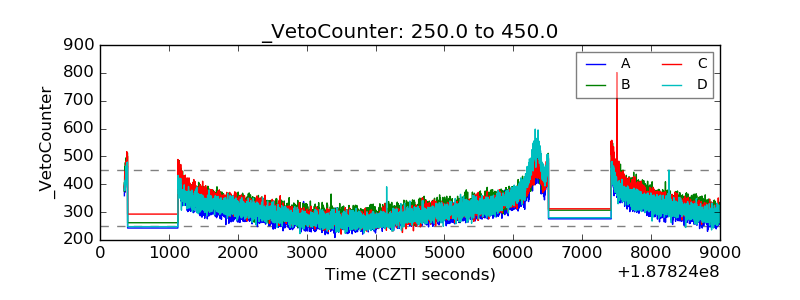 |