| Param | Original file | Final file |
|---|---|---|
| Filename | modeM0/AS1P01_997T03_9000000216_01155cztM0_level2.evt | modeM0/AS1P01_997T03_9000000216_01155cztM0_level2_quad_clean.evt |
| Size (bytes) | 1,006,179,840 | 103,610,880 |
| Size | 959.6 MB | 98.8 MB |
| Events in quadrant A | 7,684,421 | 676,057 |
| Events in quadrant B | 7,985,872 | 691,400 |
| Events in quadrant C | 7,585,244 | 667,382 |
| Events in quadrant D | 6,788,789 | 653,477 |
| Mode M0 | |||
|---|---|---|---|
| Quadrant | BADHDUFLAG | Total packets | Discarded packets |
| A | 0 | 27413 | 2 |
| B | 0 | 28323 | 1 |
| C | 0 | 27161 | 1 |
| D | 0 | 24794 | 1 |
| Mode SS | |||
|---|---|---|---|
| Quadrant | BADHDUFLAG | Total packets | Discarded packets |
| A | 0 | 130 | 0 |
| B | 0 | 130 | 0 |
| C | 0 | 130 | 0 |
| D | 0 | 130 | 0 |
| Mode M9 | |||
|---|---|---|---|
| Quadrant | BADHDUFLAG | Total packets | Discarded packets |
| A | 0 | 11 | 0 |
| B | 0 | 11 | 0 |
| C | 0 | 11 | 0 |
| D | 0 | 11 | 0 |
| Quadrant | Total seconds | Saturated seconds | Saturation percentage |
|---|---|---|---|
| A | 6448 | 87 | 1.349256% |
| B | 6448 | 48 | 0.744417% |
| C | 6448 | 63 | 0.977047% |
| D | 6448 | 76 | 1.178660% |
Noise dominated data is calculated using 1-second bins in cleaned event files. If a bin has >2000 counts, and if more than 50% of those come from <1% of pixels, then it is considered to be noise-dominated and hence unusable.
| Quadrant | # 1 sec bins | Bins with >0 counts | Bins with >2000 counts | High rate bins dominated by noise | Noise dominated (total time) | Noise dominated (detector-on time) | Marked lightcurve |
|---|---|---|---|---|---|---|---|
| A | 7568 | 6448 | 265 | 265 | 3.50% | 4.11% | 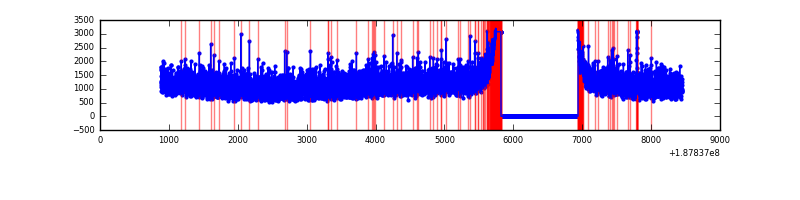 |
| B | 7568 | 6448 | 243 | 243 | 3.21% | 3.77% | 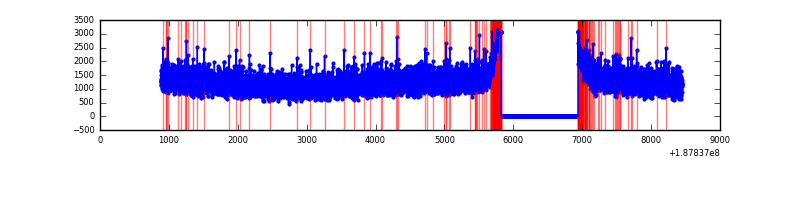 |
| C | 7568 | 6448 | 228 | 228 | 3.01% | 3.54% | 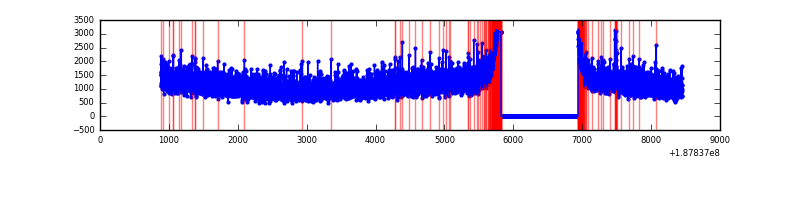 |
| D | 7568 | 6448 | 213 | 213 | 2.81% | 3.30% | 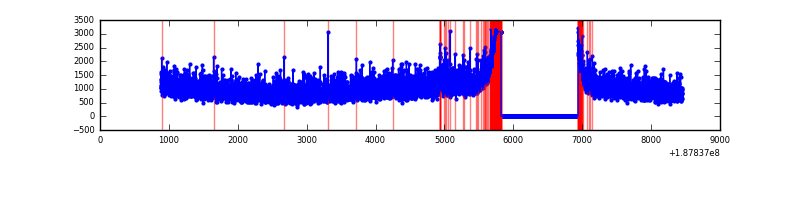 |
Top three noisy pixels from each quadrant. If the there are fewer than three noisy pixels in the level2.evt file, extra rows are filled as -1
| Pixel properties | Quadrant properties | ||||||
|---|---|---|---|---|---|---|---|
| Quadrant | DetID | PixID | Counts | Sigma | Mean | Median | Sigma |
| A | 14 | 218 | 18450 | 35.23 | 1997 | 2016 | 466.5 |
| A | 11 | 79 | 7002 | 10.69 | 1997 | 2016 | 466.5 |
| A | 14 | 203 | 6636 | 9.9 | 1997 | 2016 | 466.5 |
| B | 15 | 22 | 35426 | 69.38 | 2071 | 2086 | 480.5 |
| B | 6 | 53 | 32742 | 63.8 | 2071 | 2086 | 480.5 |
| B | 8 | 4 | 12684 | 22.06 | 2071 | 2086 | 480.5 |
| C | 15 | 241 | 288206 | 560.45 | 1851 | 1913 | 510.8 |
| C | 9 | 52 | 25902 | 46.96 | 1851 | 1913 | 510.8 |
| C | 3 | 111 | 20782 | 36.94 | 1851 | 1913 | 510.8 |
| D | 13 | 252 | 25212 | 42.65 | 1807 | 1877 | 547.1 |
| D | 10 | 125 | 8264 | 11.67 | 1807 | 1877 | 547.1 |
| D | 13 | 73 | 7706 | 10.65 | 1807 | 1877 | 547.1 |
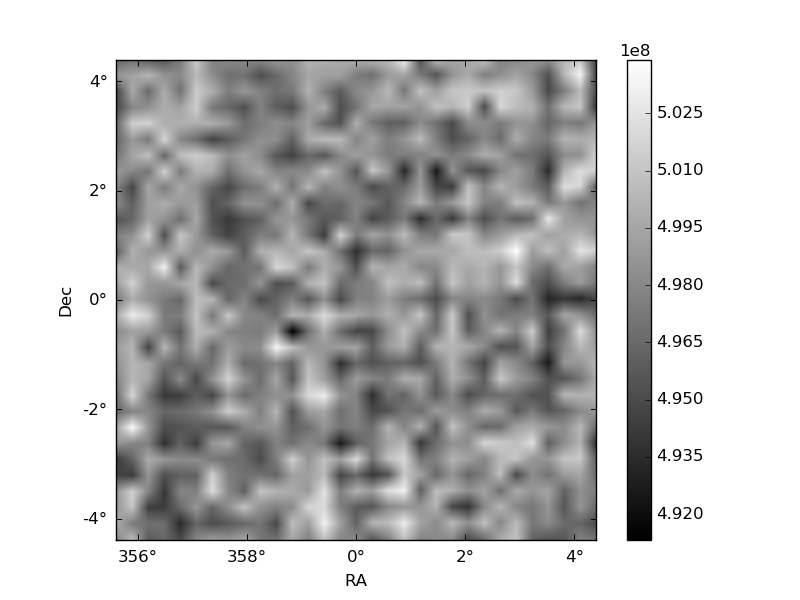
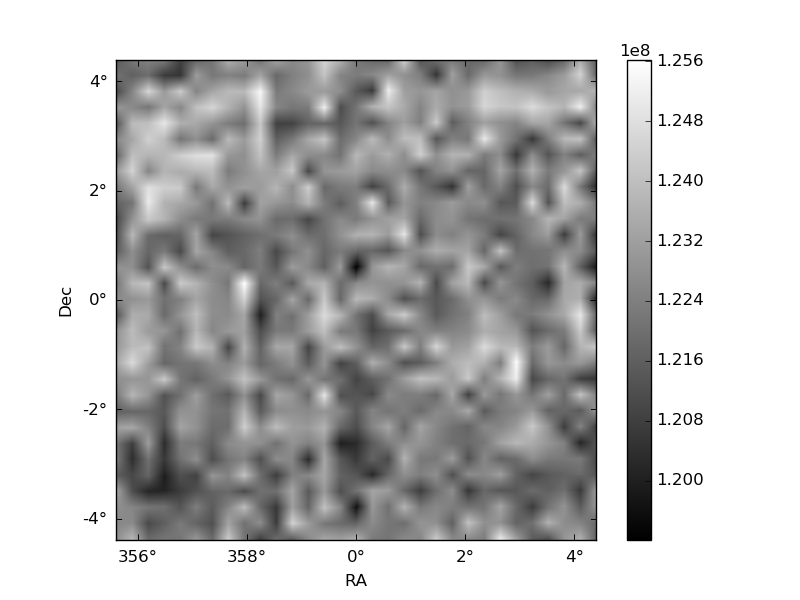
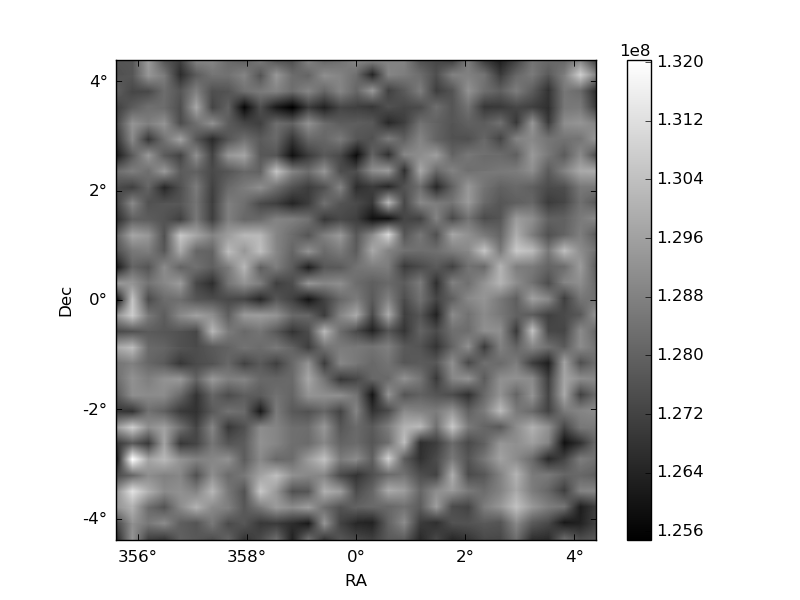
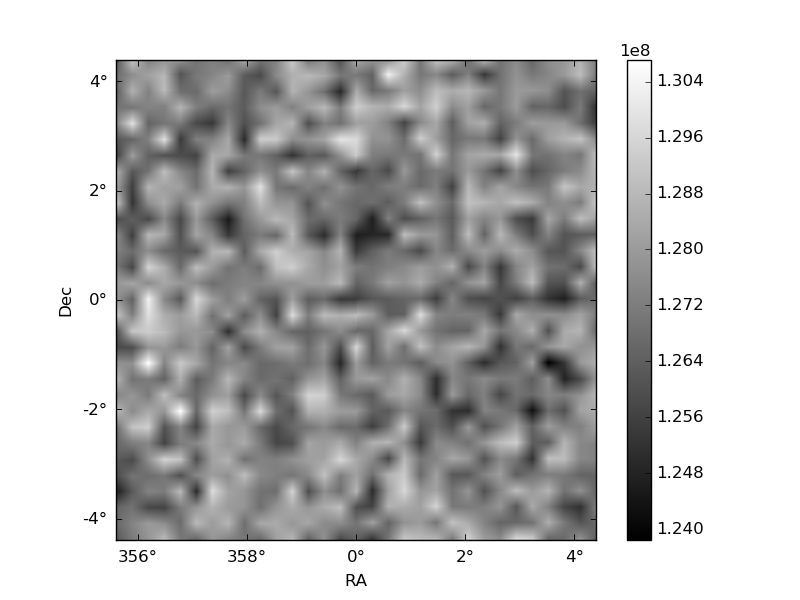
Histogram calculated using DETX and DETY for each event in the final _common_clean file
| Quadrant A | 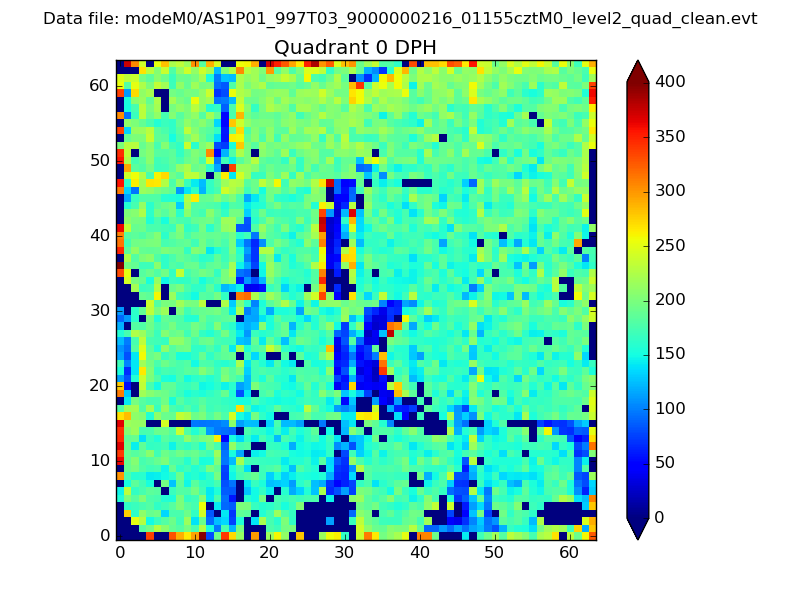 |
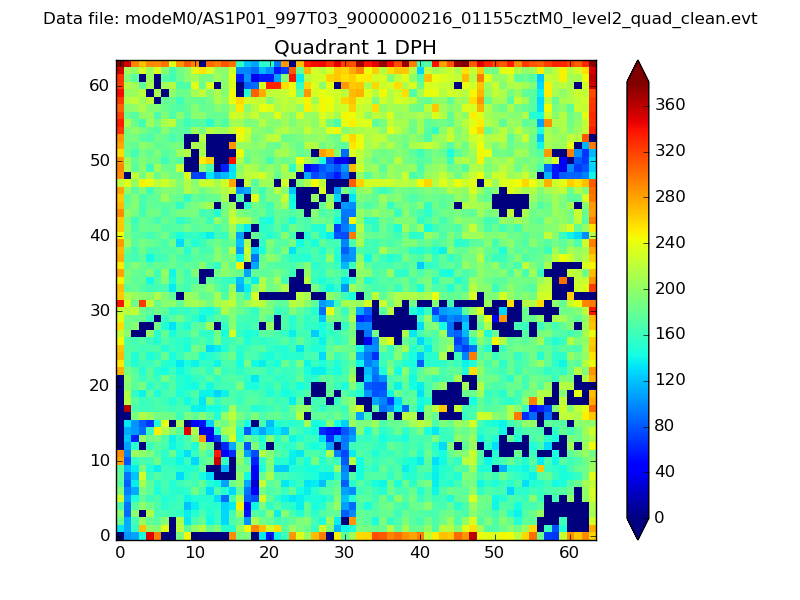 |
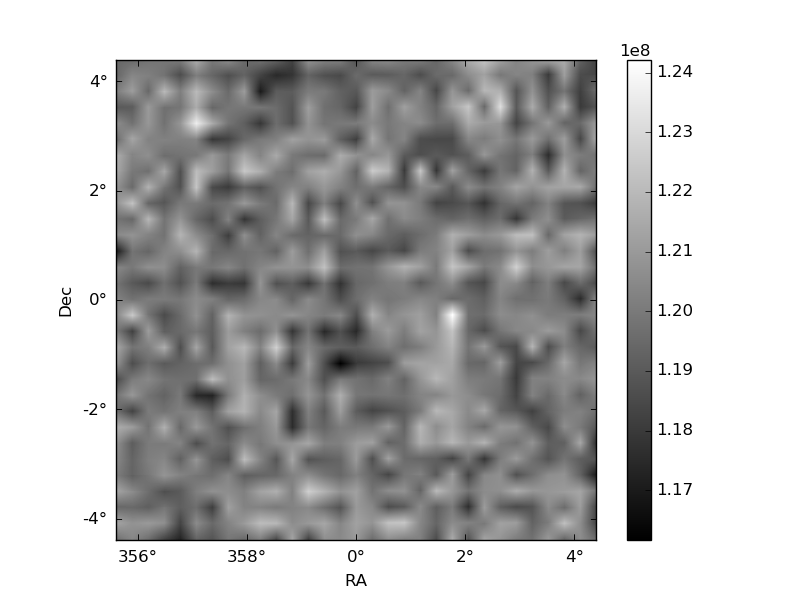
Quadrant B |
|---|---|---|---|
| Quadrant D | 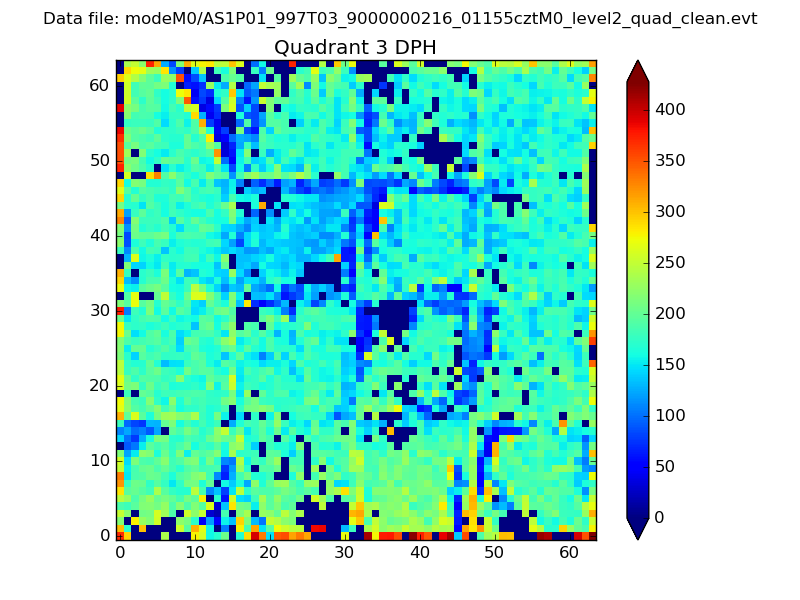 |
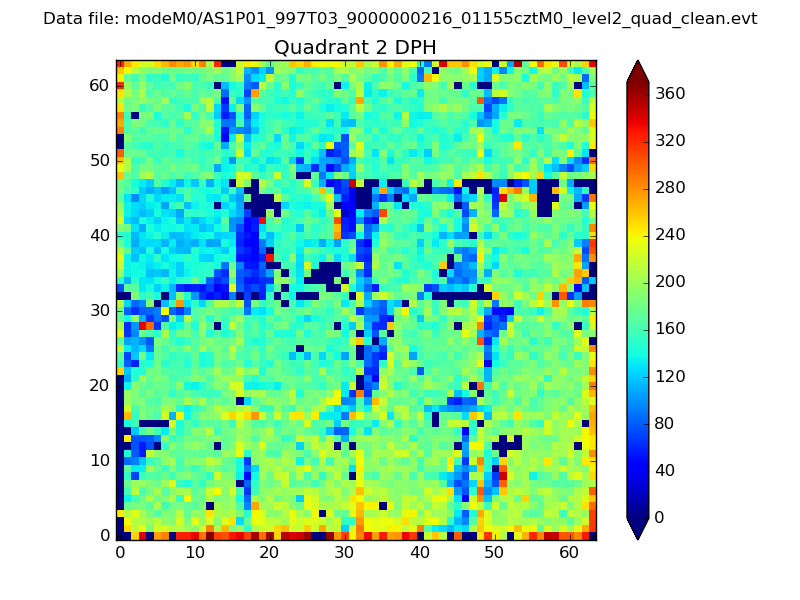 |
Quadrant C |
| Plot type | Count rate plots | Images |
|---|---|---|
| Comparison with Poisson distribution Blue bars denote a histogram of data divided into 1 sec bins. Red curve is a Poisson curve with rate = median count rate of data. |
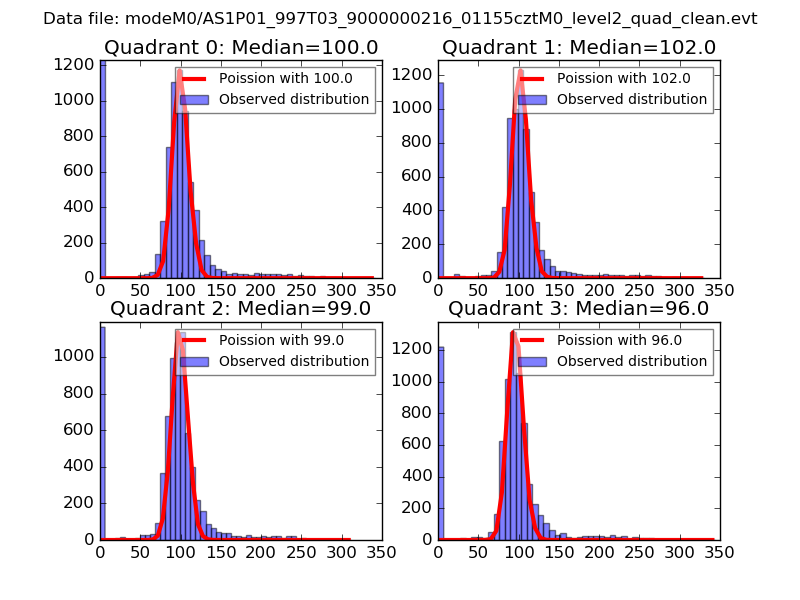 |
 |
| Quadrant-wise count rates Data is divided into 100 sec bins |
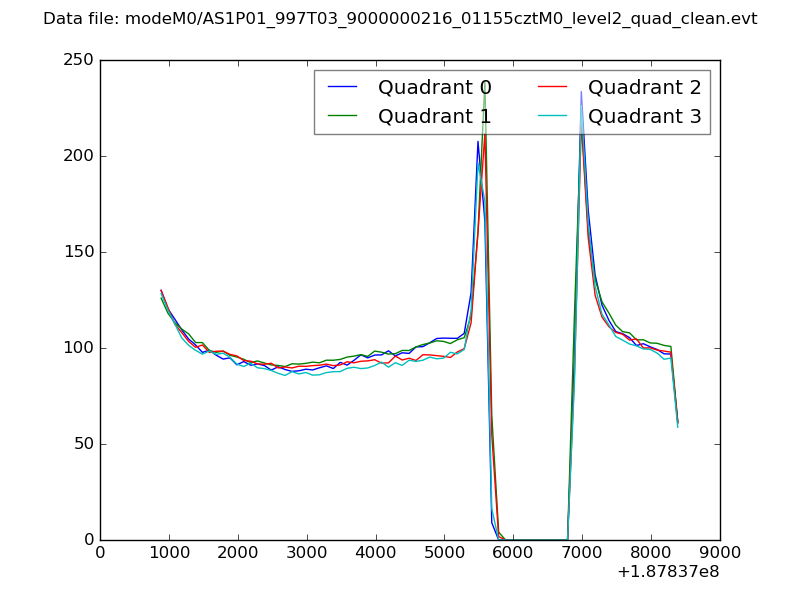 |
|
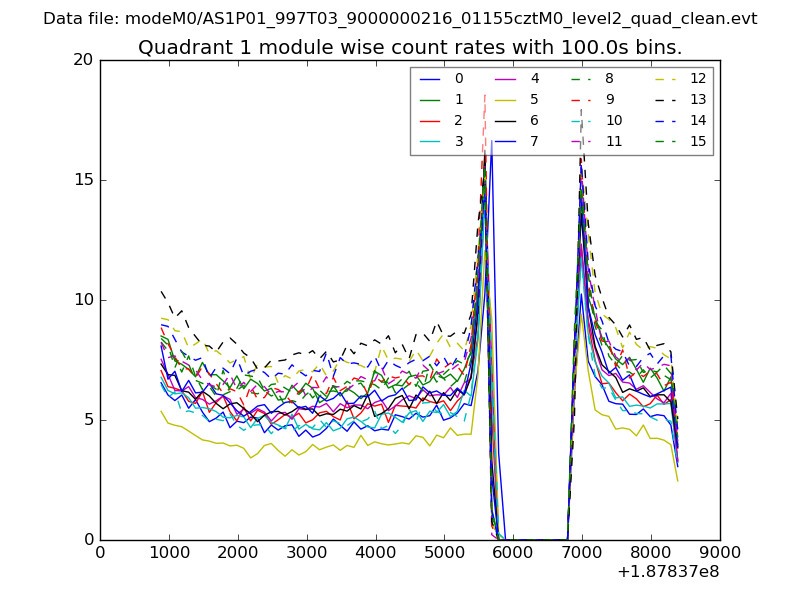
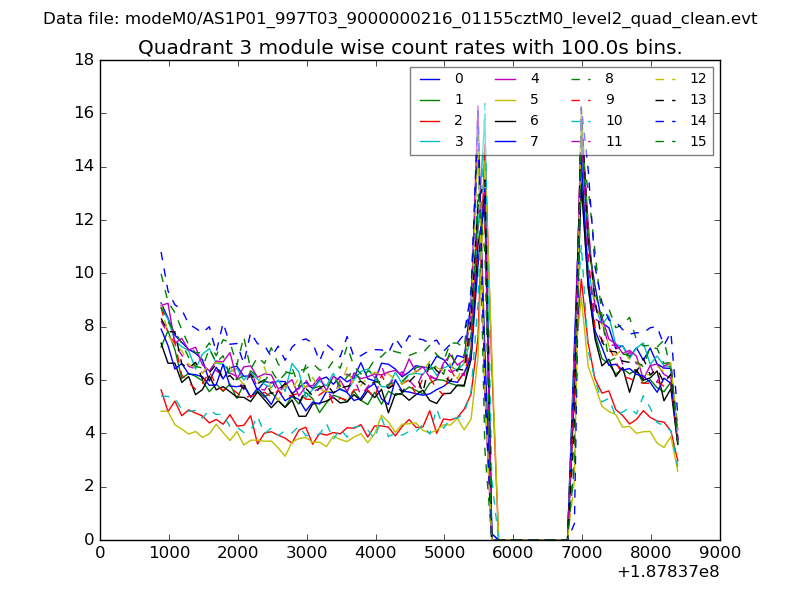
| Module-wise count rates for Quadrant A Data is divided into 100 sec bins |
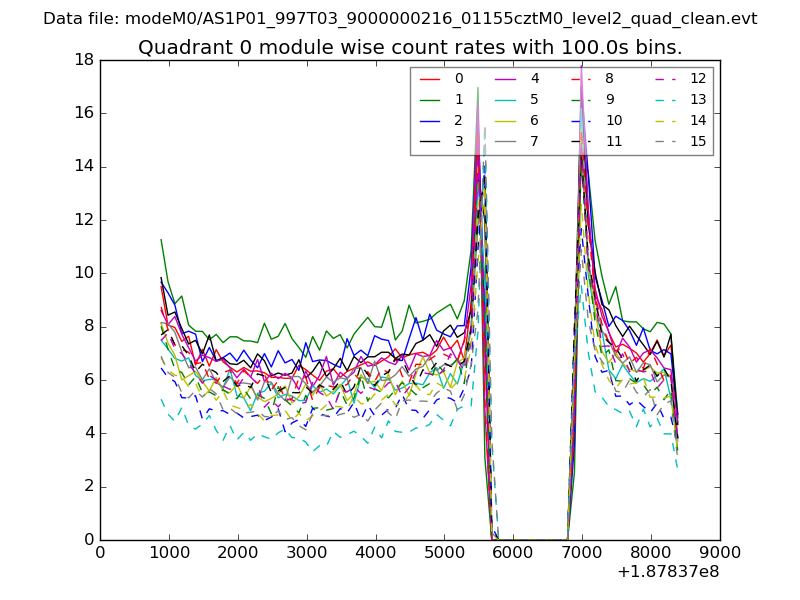 |
 |
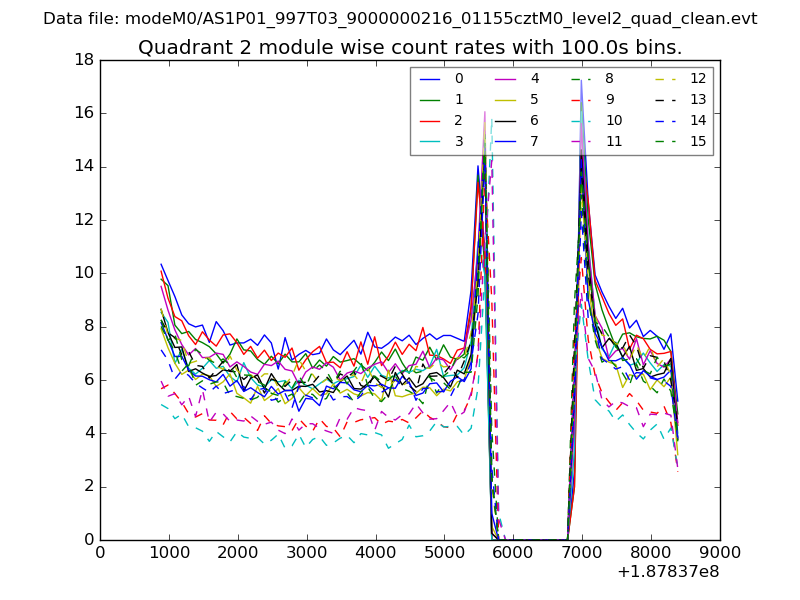
| Module-wise count rates for Quadrant B Data is divided into 100 sec bins |
 |
 |
| Module-wise count rates for Quadrant C Data is divided into 100 sec bins |
 |
 |
| Module-wise count rates for Quadrant D Data is divided into 100 sec bins |
 |
 |
| Parameter | Plot |
|---|---|
| CZT HV Monitor | 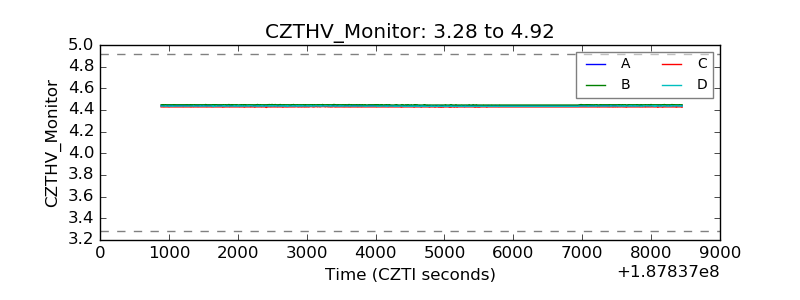 |
| D_VDD |  |
| Temperature 1 | 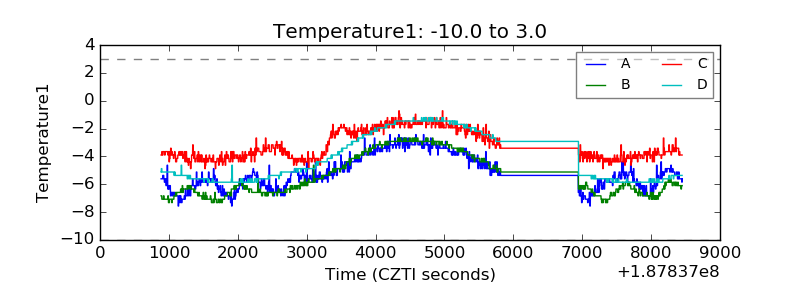 |
| Veto HV Monitor | 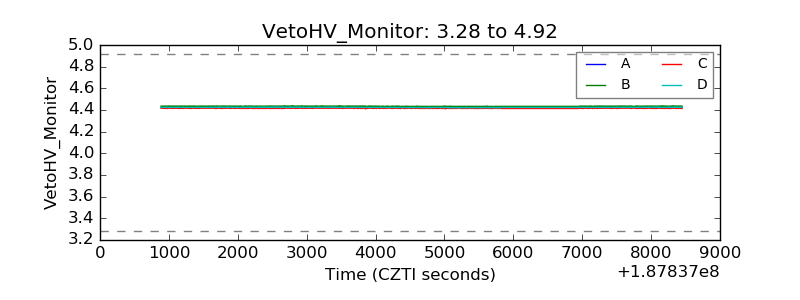 |
| Veto LLD | 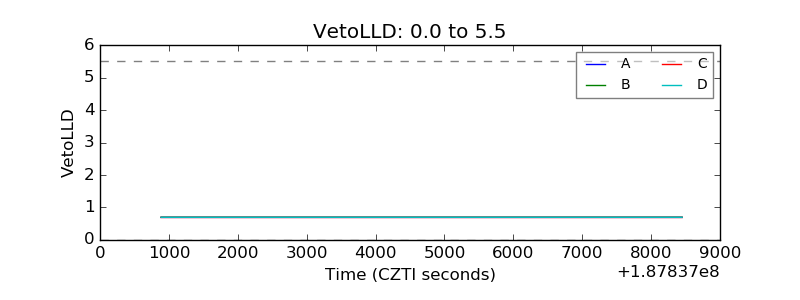 |
| Alpha Counter | 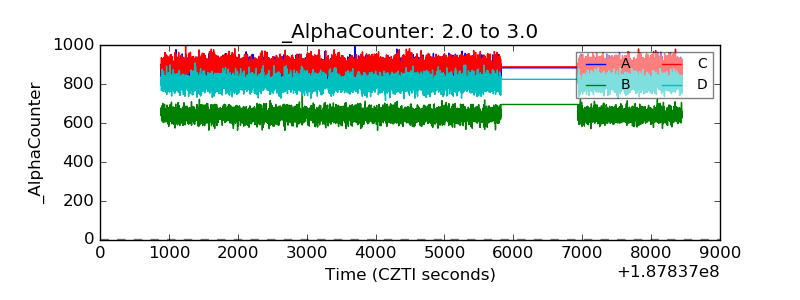 |
| _CPM_Rate | 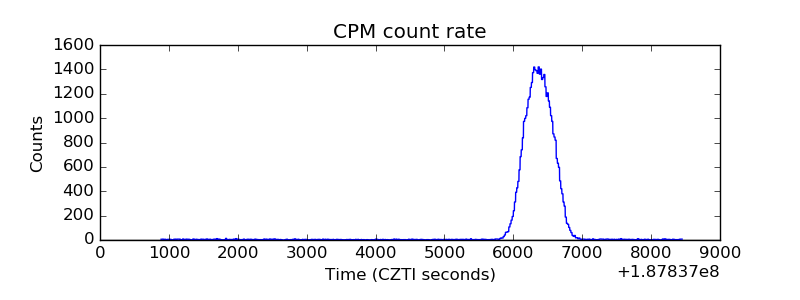 |
| CZT Counter | 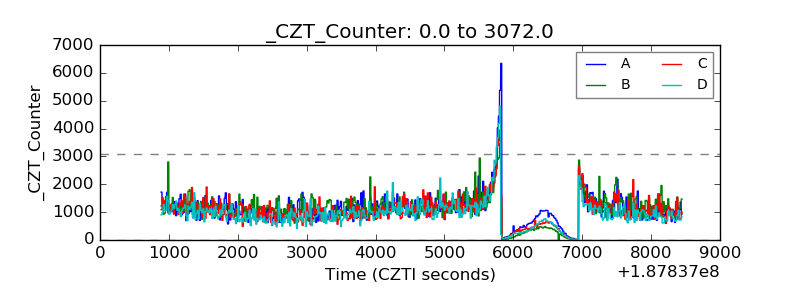 |
| +2.5 Volts monitor |  |
| +5 Volts monitor |  |
| _ROLL_ROT | 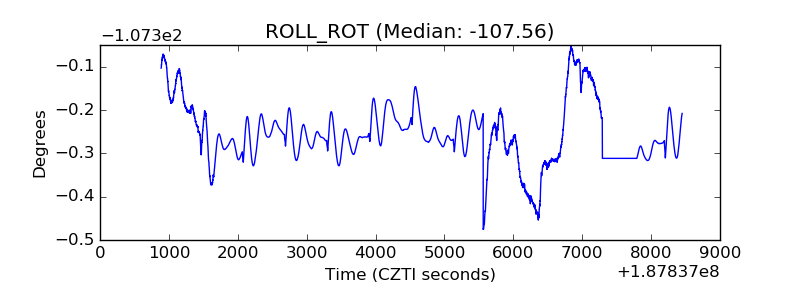 |
| _Roll_DEC | 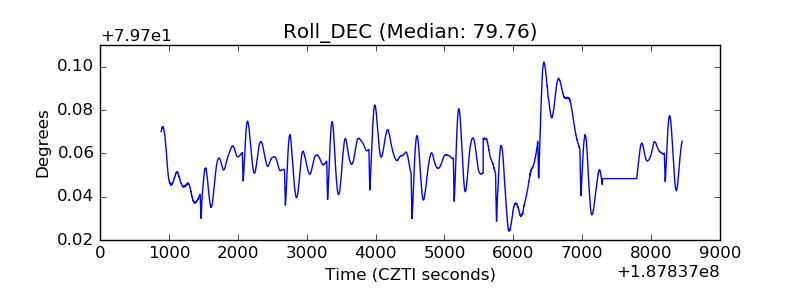 |
| _Roll_RA | 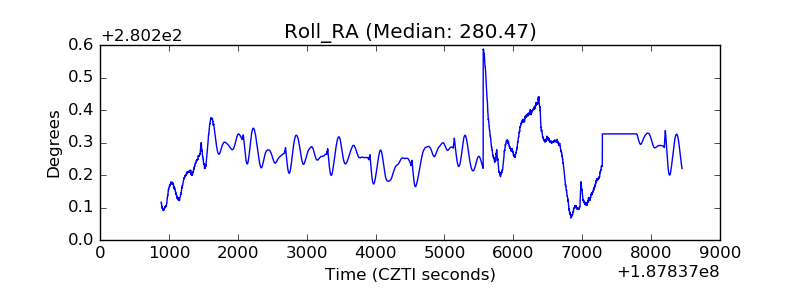 |
| Veto Counter | 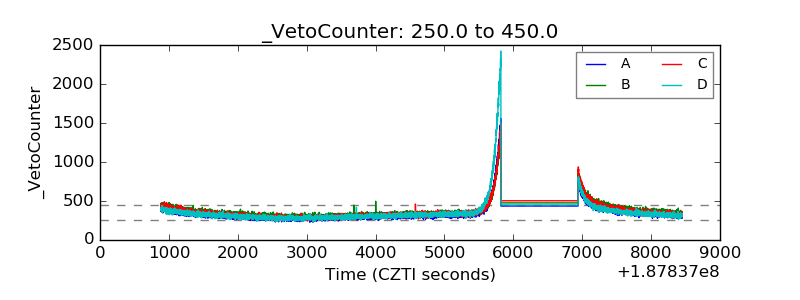 |