| Param | Original file | Final file |
|---|---|---|
| Filename | modeM0/AS1P01_997T03_9000000216_01157cztM0_level2.evt | modeM0/AS1P01_997T03_9000000216_01157cztM0_level2_quad_clean.evt |
| Size (bytes) | 910,935,360 | 94,144,320 |
| Size | 868.7 MB | 89.8 MB |
| Events in quadrant A | 6,991,717 | 625,949 |
| Events in quadrant B | 7,194,970 | 628,174 |
| Events in quadrant C | 6,871,031 | 595,991 |
| Events in quadrant D | 6,139,304 | 590,283 |
| Mode M0 | |||
|---|---|---|---|
| Quadrant | BADHDUFLAG | Total packets | Discarded packets |
| A | 0 | 24958 | 2 |
| B | 0 | 25551 | 1 |
| C | 0 | 24544 | 1 |
| D | 0 | 22469 | 5 |
| Mode SS | |||
|---|---|---|---|
| Quadrant | BADHDUFLAG | Total packets | Discarded packets |
| A | 0 | 120 | 0 |
| B | 0 | 120 | 0 |
| C | 0 | 120 | 0 |
| D | 0 | 120 | 0 |
| Mode M9 | |||
|---|---|---|---|
| Quadrant | BADHDUFLAG | Total packets | Discarded packets |
| A | 0 | 12 | 0 |
| B | 0 | 12 | 0 |
| C | 0 | 12 | 0 |
| D | 0 | 12 | 0 |
| Quadrant | Total seconds | Saturated seconds | Saturation percentage |
|---|---|---|---|
| A | 5876 | 25 | 0.425459% |
| B | 5876 | 24 | 0.408441% |
| C | 5876 | 6 | 0.102110% |
| D | 5875 | 13 | 0.221277% |
Noise dominated data is calculated using 1-second bins in cleaned event files. If a bin has >2000 counts, and if more than 50% of those come from <1% of pixels, then it is considered to be noise-dominated and hence unusable.
| Quadrant | # 1 sec bins | Bins with >0 counts | Bins with >2000 counts | High rate bins dominated by noise | Noise dominated (total time) | Noise dominated (detector-on time) | Marked lightcurve |
|---|---|---|---|---|---|---|---|
| A | 7106 | 5876 | 169 | 169 | 2.38% | 2.88% | 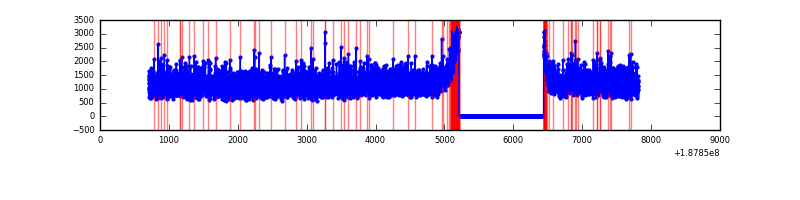 |
| B | 7106 | 5877 | 203 | 203 | 2.86% | 3.45% | 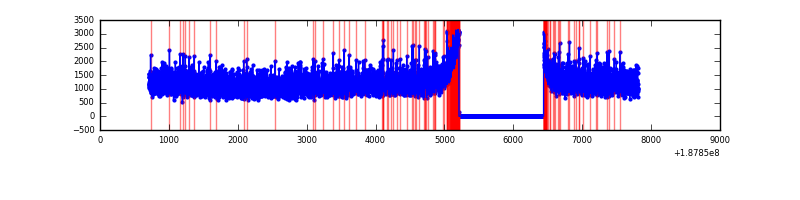 |
| C | 7106 | 5876 | 155 | 155 | 2.18% | 2.64% | 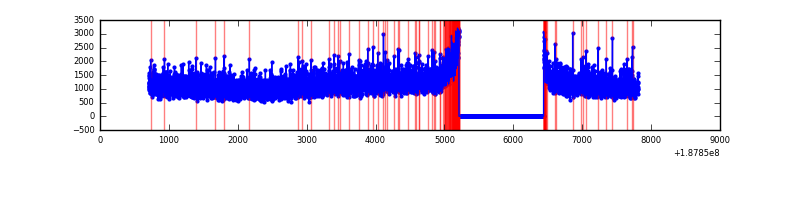 |
| D | 7106 | 5876 | 116 | 116 | 1.63% | 1.97% | 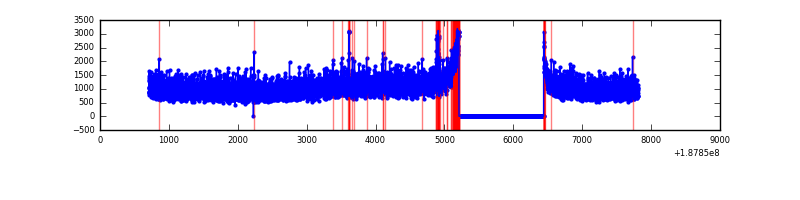 |
Top three noisy pixels from each quadrant. If the there are fewer than three noisy pixels in the level2.evt file, extra rows are filled as -1
| Pixel properties | Quadrant properties | ||||||
|---|---|---|---|---|---|---|---|
| Quadrant | DetID | PixID | Counts | Sigma | Mean | Median | Sigma |
| A | 4 | 32 | 29652 | 64.62 | 1810 | 1823 | 430.6 |
| A | 12 | 243 | 10348 | 19.8 | 1810 | 1823 | 430.6 |
| A | 13 | 164 | 9006 | 16.68 | 1810 | 1823 | 430.6 |
| B | 6 | 53 | 36392 | 78.13 | 1872 | 1881 | 441.7 |
| B | 15 | 22 | 19279 | 39.39 | 1872 | 1881 | 441.7 |
| B | 8 | 4 | 16143 | 32.29 | 1872 | 1881 | 441.7 |
| C | 15 | 241 | 257463 | 554.12 | 1663 | 1713 | 461.5 |
| C | 9 | 52 | 85785 | 182.15 | 1663 | 1713 | 461.5 |
| C | 3 | 111 | 18504 | 36.38 | 1663 | 1713 | 461.5 |
| D | 10 | 85 | 41573 | 79.69 | 1624 | 1679 | 500.6 |
| D | 2 | 152 | 20645 | 37.88 | 1624 | 1679 | 500.6 |
| D | 13 | 205 | 7129 | 10.89 | 1624 | 1679 | 500.6 |
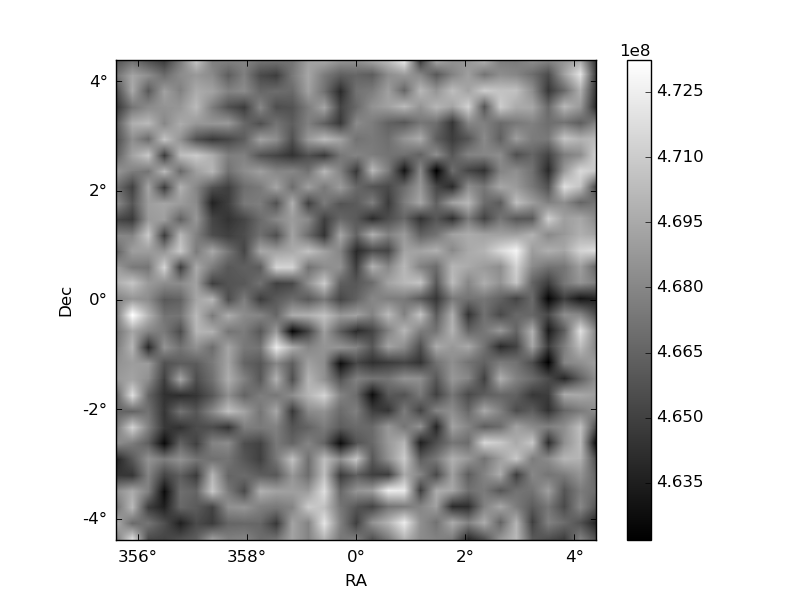
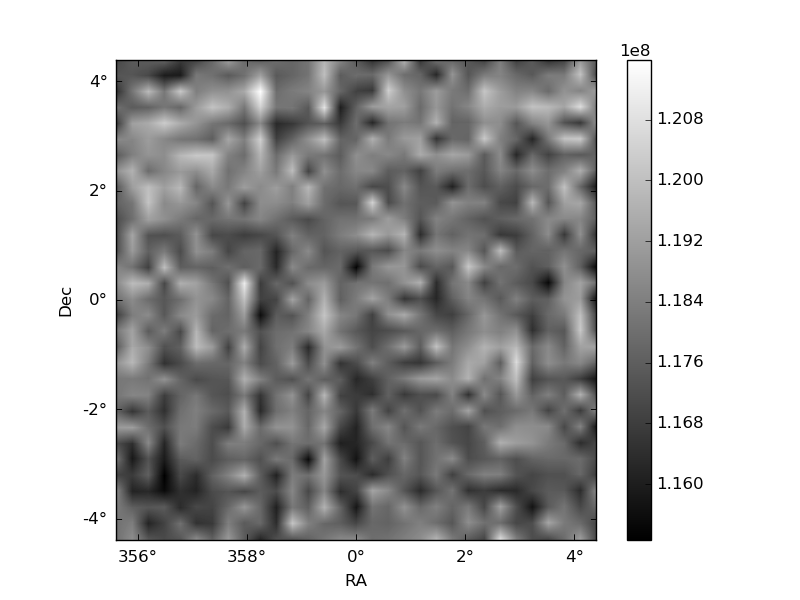
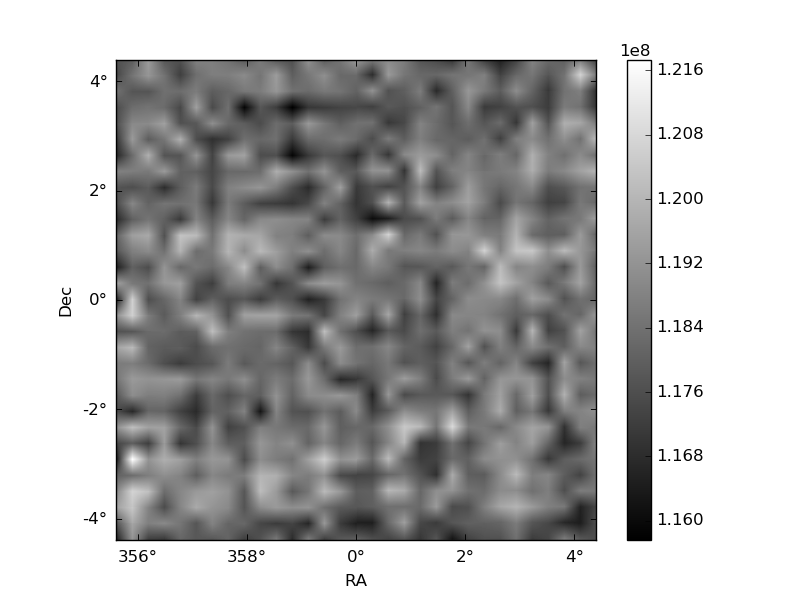
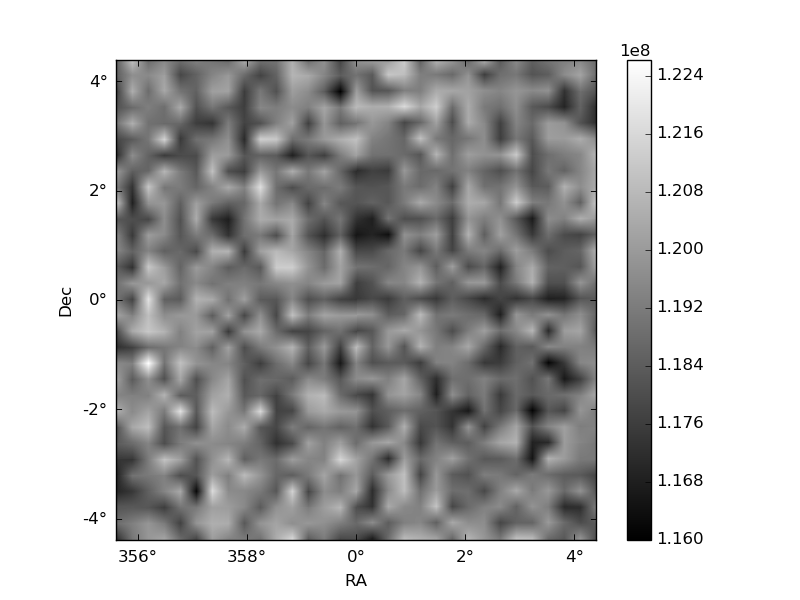
Histogram calculated using DETX and DETY for each event in the final _common_clean file
| Quadrant A | 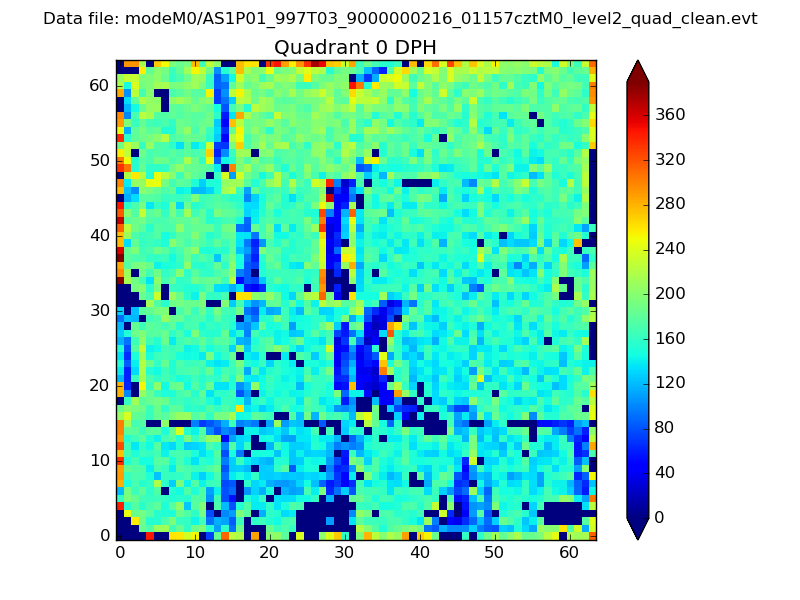 |
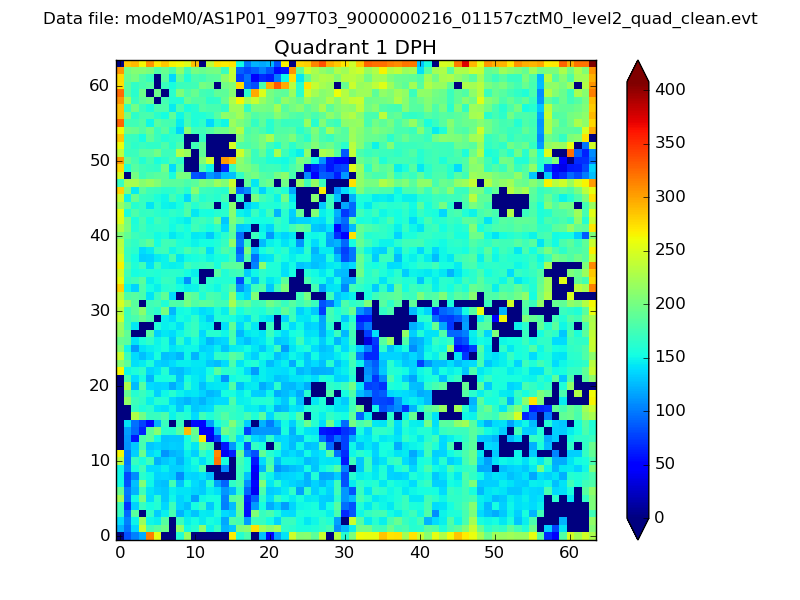 |
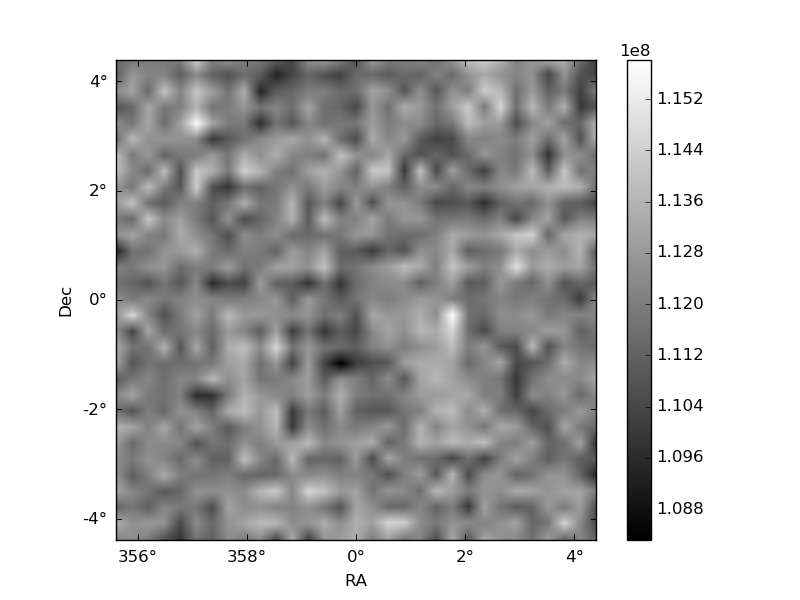
Quadrant B |
|---|---|---|---|
| Quadrant D | 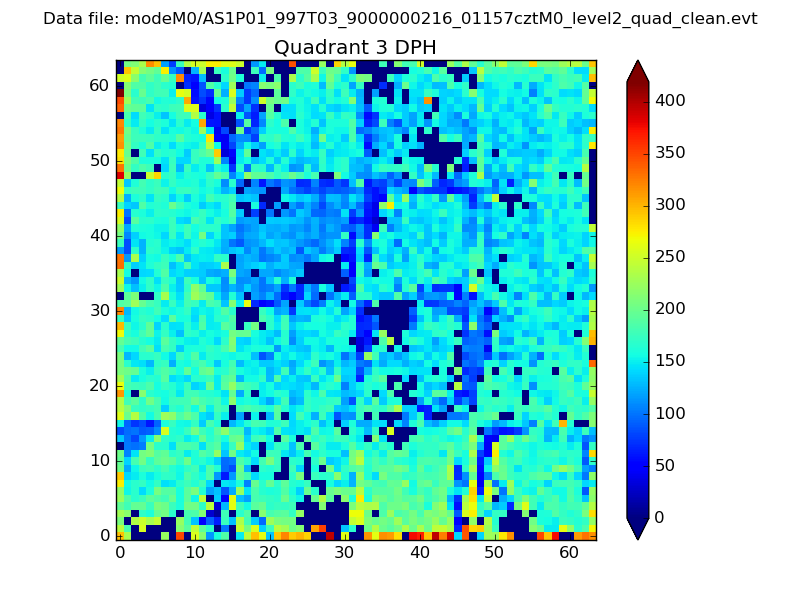 |
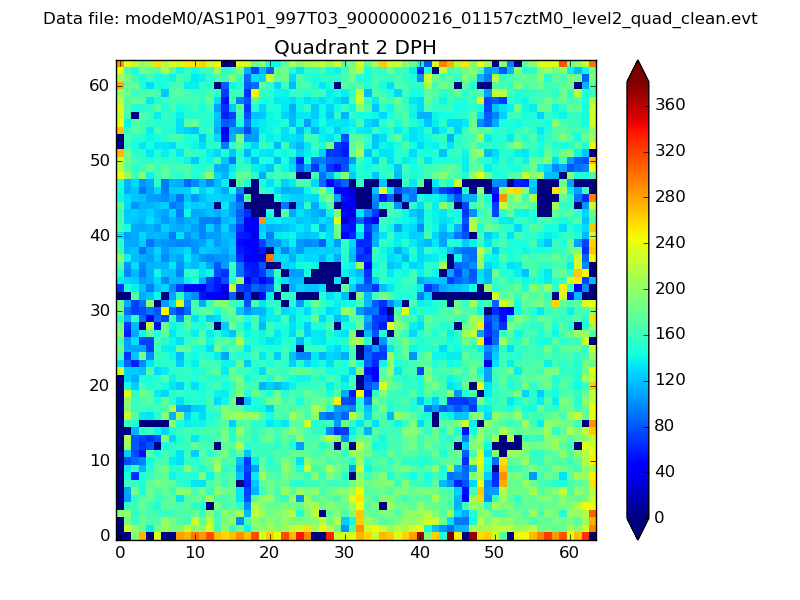 |
Quadrant C |
| Plot type | Count rate plots | Images |
|---|---|---|
| Comparison with Poisson distribution Blue bars denote a histogram of data divided into 1 sec bins. Red curve is a Poisson curve with rate = median count rate of data. |
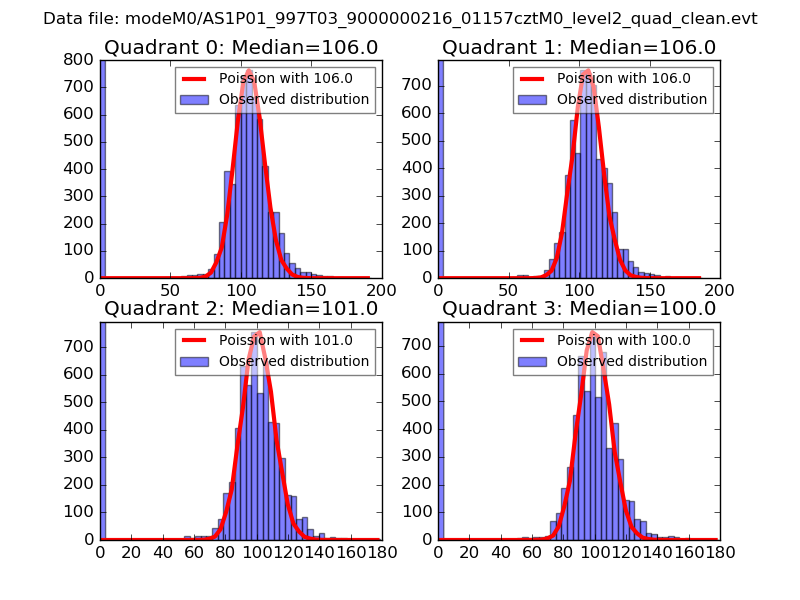 |
 |
| Quadrant-wise count rates Data is divided into 100 sec bins |
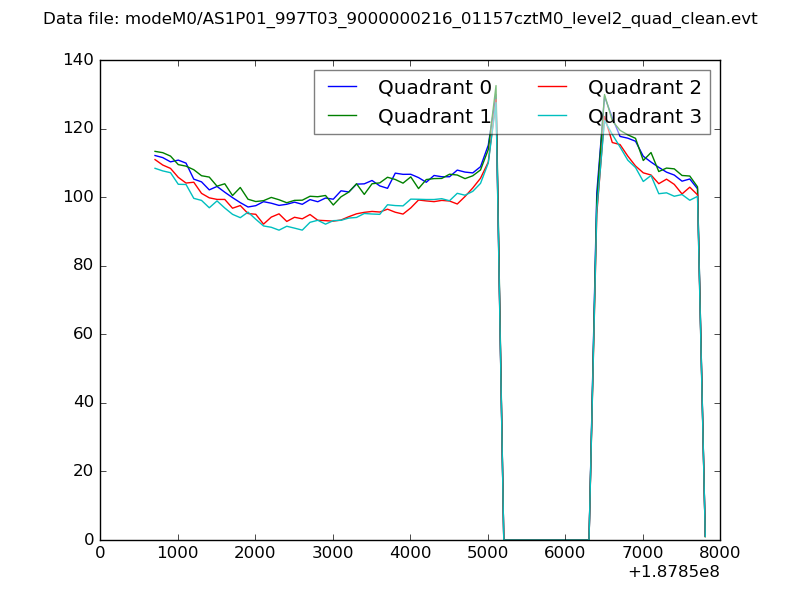 |
|
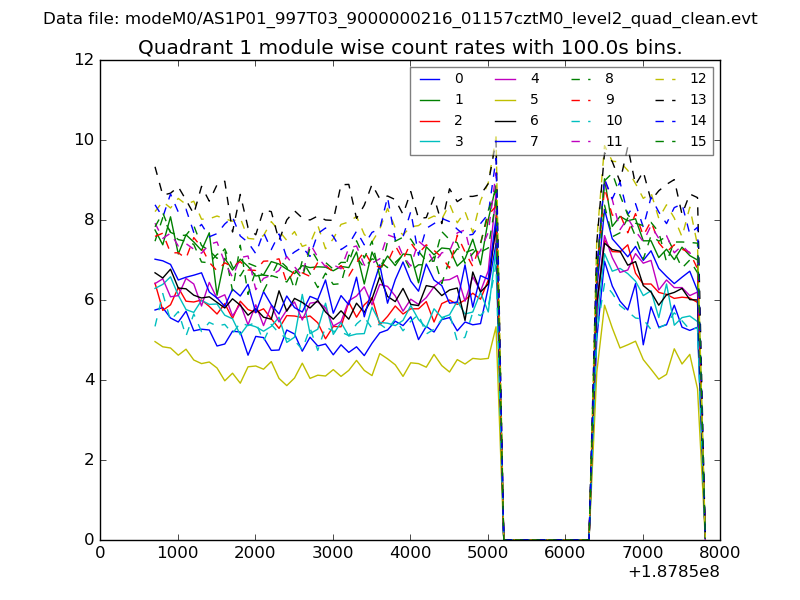
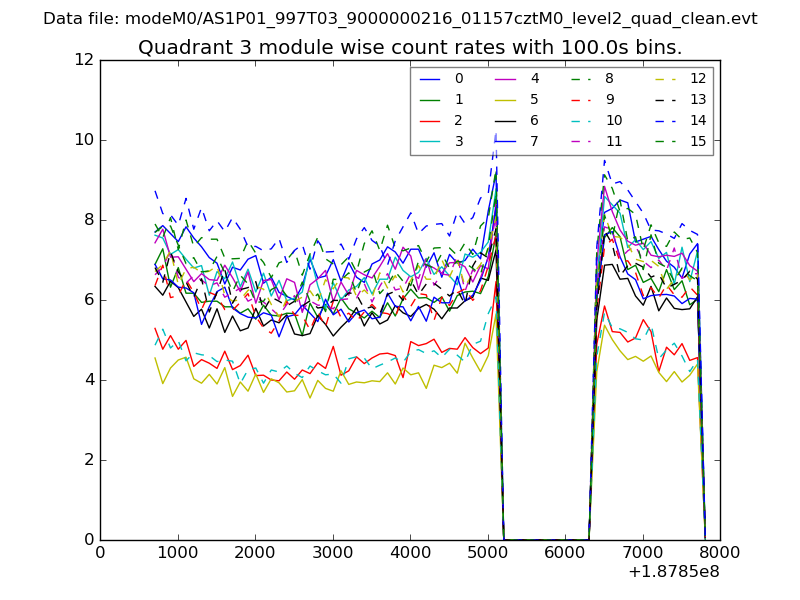
| Module-wise count rates for Quadrant A Data is divided into 100 sec bins |
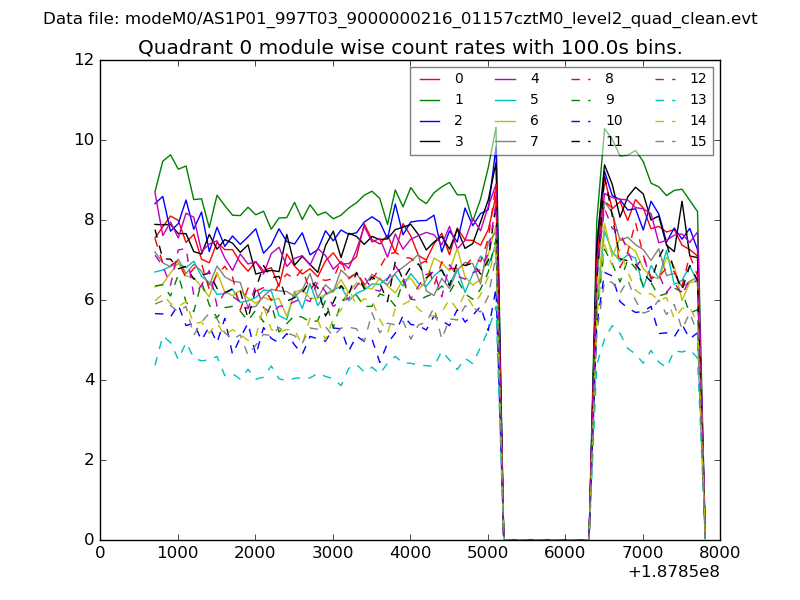 |
 |
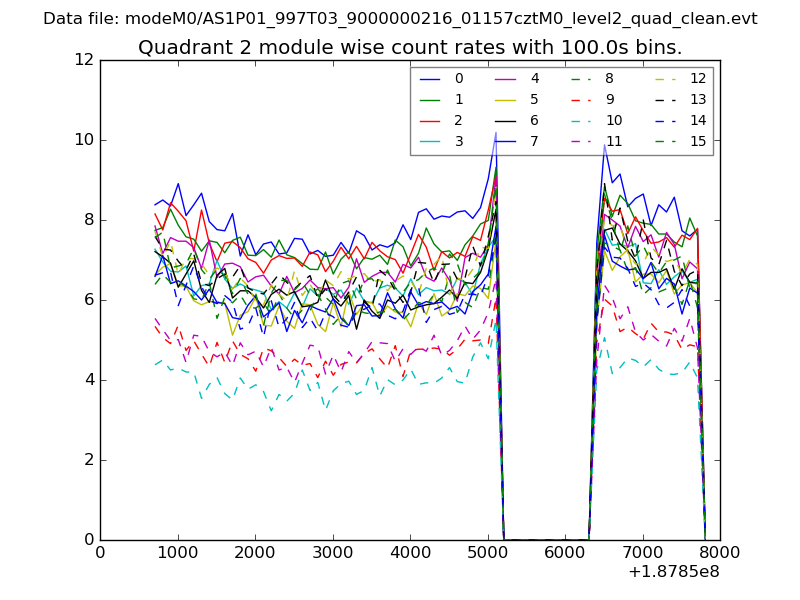
| Module-wise count rates for Quadrant B Data is divided into 100 sec bins |
 |
 |
| Module-wise count rates for Quadrant C Data is divided into 100 sec bins |
 |
 |
| Module-wise count rates for Quadrant D Data is divided into 100 sec bins |
 |
 |
| Parameter | Plot |
|---|---|
| CZT HV Monitor | 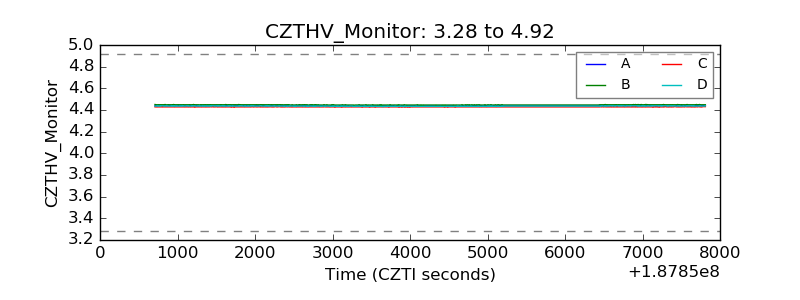 |
| D_VDD | 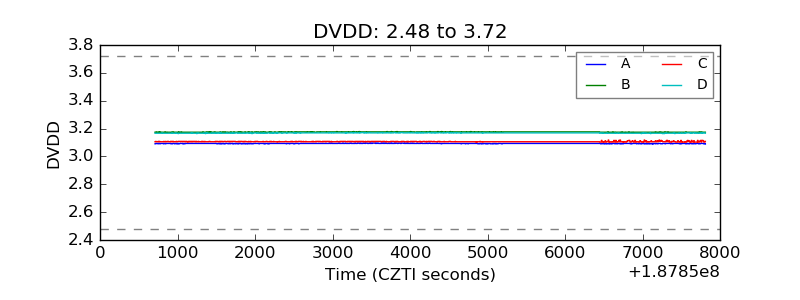 |
| Temperature 1 | 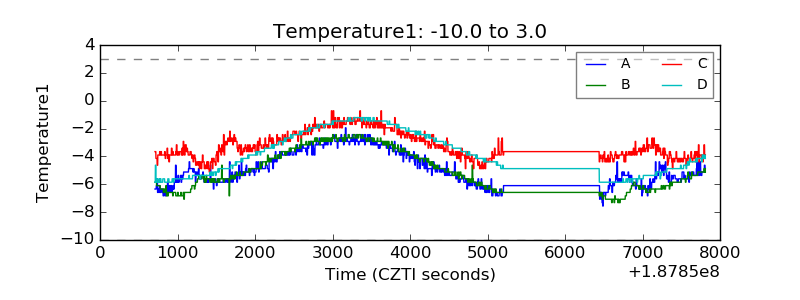 |
| Veto HV Monitor | 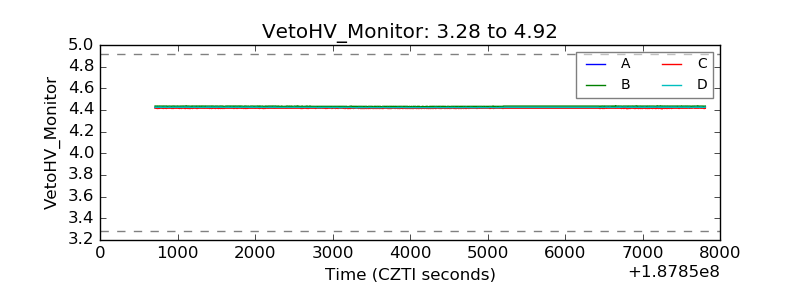 |
| Veto LLD | 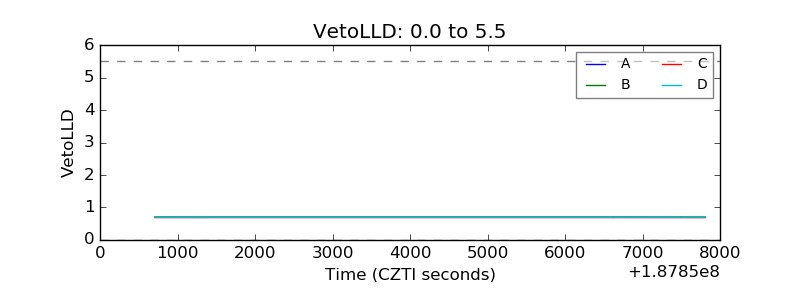 |
| Alpha Counter | 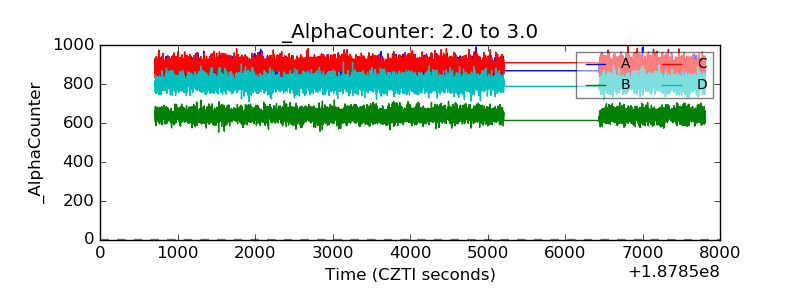 |
| _CPM_Rate | 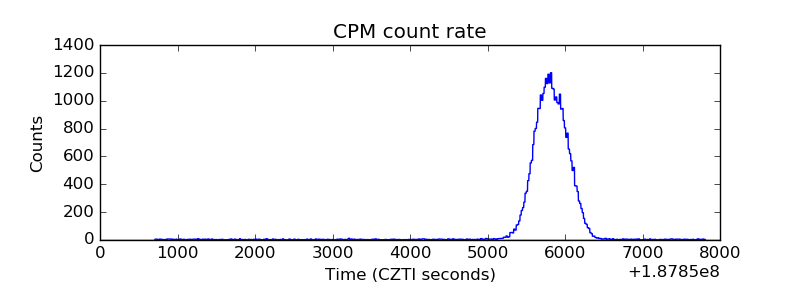 |
| CZT Counter | 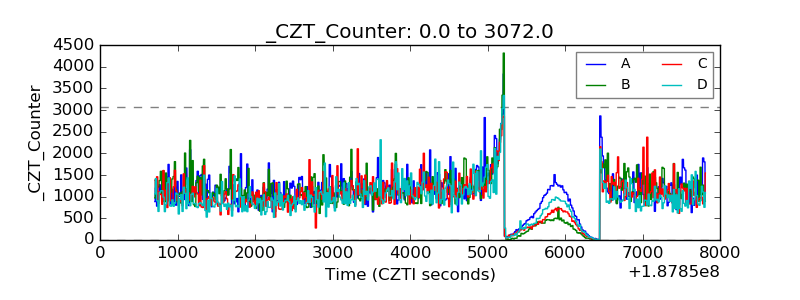 |
| +2.5 Volts monitor | 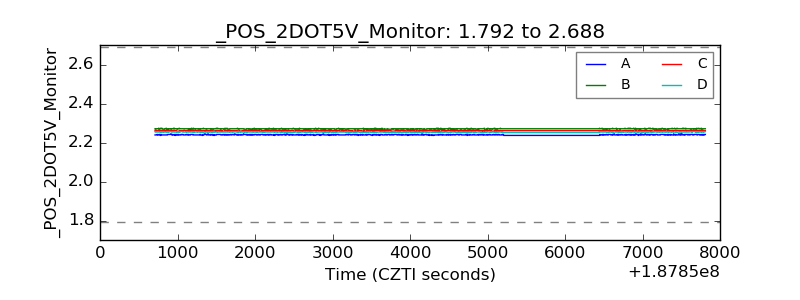 |
| +5 Volts monitor |  |
| _ROLL_ROT | 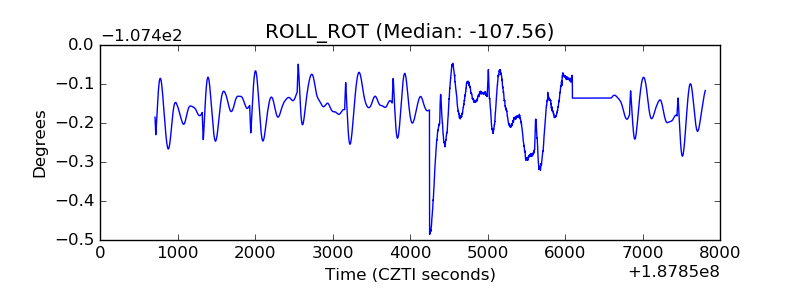 |
| _Roll_DEC | 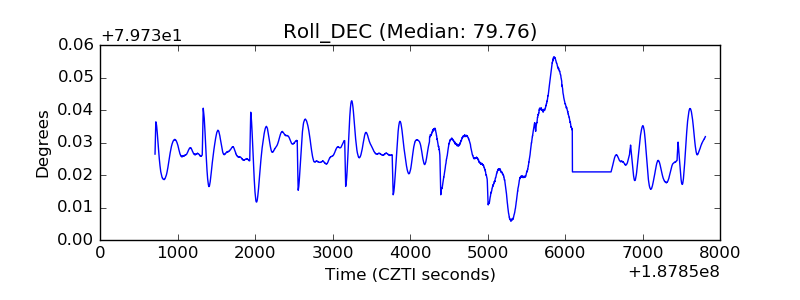 |
| _Roll_RA | 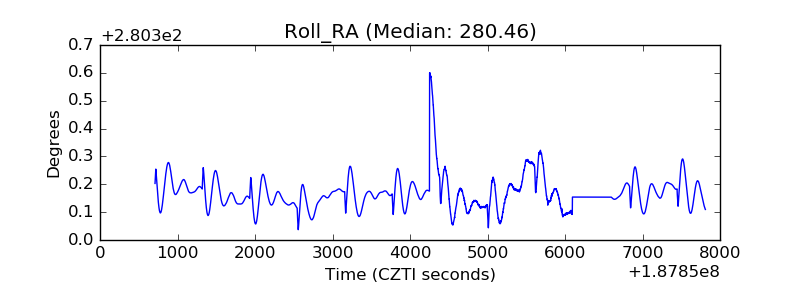 |
| Veto Counter | 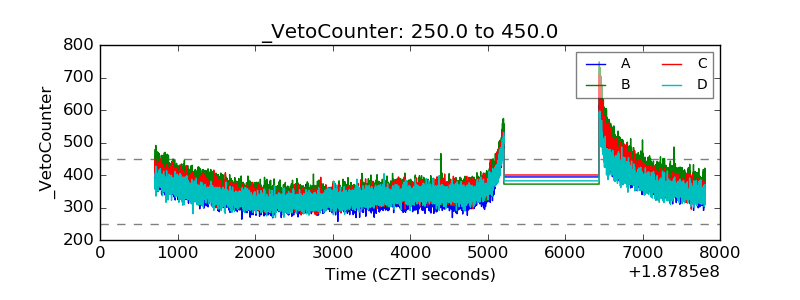 |