| Param | Original file | Final file |
|---|---|---|
| Filename | modeM0/AS1P01_997T03_9000000216_01158cztM0_level2.evt | modeM0/AS1P01_997T03_9000000216_01158cztM0_level2_quad_clean.evt |
| Size (bytes) | 982,863,360 | 98,789,760 |
| Size | 937.3 MB | 94.2 MB |
| Events in quadrant A | 7,445,315 | 659,646 |
| Events in quadrant B | 7,682,810 | 660,952 |
| Events in quadrant C | 7,738,098 | 615,804 |
| Events in quadrant D | 6,487,289 | 621,581 |
| Mode M0 | |||
|---|---|---|---|
| Quadrant | BADHDUFLAG | Total packets | Discarded packets |
| A | 0 | 26567 | 2 |
| B | 0 | 27199 | 1 |
| C | 0 | 27410 | 1 |
| D | 0 | 23714 | 1 |
| Mode SS | |||
|---|---|---|---|
| Quadrant | BADHDUFLAG | Total packets | Discarded packets |
| A | 0 | 126 | 0 |
| B | 0 | 126 | 0 |
| C | 0 | 126 | 0 |
| D | 0 | 126 | 0 |
| Mode M9 | |||
|---|---|---|---|
| Quadrant | BADHDUFLAG | Total packets | Discarded packets |
| A | 0 | 13 | 0 |
| B | 0 | 13 | 0 |
| C | 0 | 13 | 0 |
| D | 0 | 13 | 0 |
| Quadrant | Total seconds | Saturated seconds | Saturation percentage |
|---|---|---|---|
| A | 6215 | 6 | 0.096541% |
| B | 6215 | 8 | 0.128721% |
| C | 6215 | 251 | 4.038616% |
| D | 6215 | 6 | 0.096541% |
Noise dominated data is calculated using 1-second bins in cleaned event files. If a bin has >2000 counts, and if more than 50% of those come from <1% of pixels, then it is considered to be noise-dominated and hence unusable.
| Quadrant | # 1 sec bins | Bins with >0 counts | Bins with >2000 counts | High rate bins dominated by noise | Noise dominated (total time) | Noise dominated (detector-on time) | Marked lightcurve |
|---|---|---|---|---|---|---|---|
| A | 7460 | 6216 | 154 | 154 | 2.06% | 2.48% | 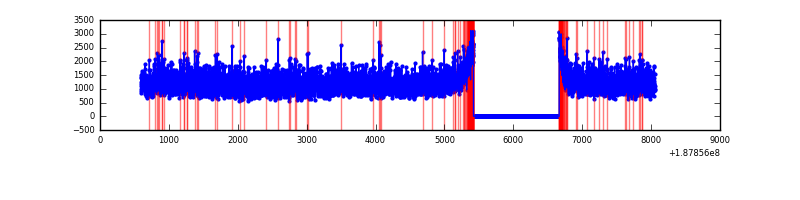 |
| B | 7460 | 6216 | 219 | 219 | 2.94% | 3.52% | 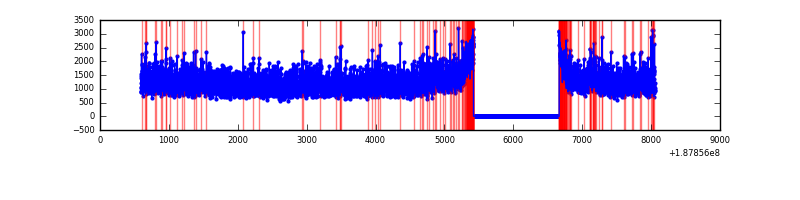 |
| C | 7460 | 6216 | 389 | 389 | 5.21% | 6.26% | 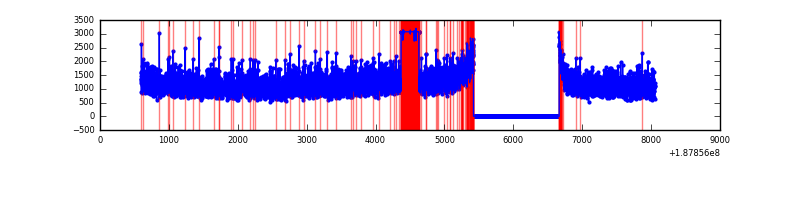 |
| D | 7460 | 6216 | 68 | 68 | 0.91% | 1.09% | 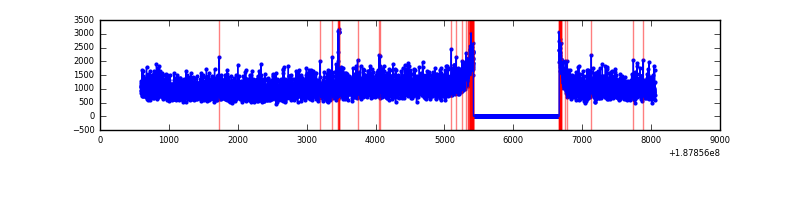 |
Top three noisy pixels from each quadrant. If the there are fewer than three noisy pixels in the level2.evt file, extra rows are filled as -1
| Pixel properties | Quadrant properties | ||||||
|---|---|---|---|---|---|---|---|
| Quadrant | DetID | PixID | Counts | Sigma | Mean | Median | Sigma |
| A | 4 | 32 | 127399 | 277.03 | 1905 | 1921 | 452.9 |
| A | 12 | 243 | 9350 | 16.4 | 1905 | 1921 | 452.9 |
| A | 11 | 79 | 8794 | 15.17 | 1905 | 1921 | 452.9 |
| B | 15 | 22 | 58599 | 122.31 | 1970 | 1984 | 462.9 |
| B | 8 | 4 | 43951 | 90.67 | 1970 | 1984 | 462.9 |
| B | 6 | 53 | 31176 | 63.07 | 1970 | 1984 | 462.9 |
| C | 9 | 52 | 673902 | 1398.13 | 1729 | 1779 | 480.7 |
| C | 15 | 241 | 271287 | 560.62 | 1729 | 1779 | 480.7 |
| C | 3 | 111 | 20310 | 38.55 | 1729 | 1779 | 480.7 |
| D | 10 | 125 | 44898 | 81.77 | 1714 | 1768 | 527.5 |
| D | 2 | 152 | 20094 | 34.74 | 1714 | 1768 | 527.5 |
| D | 10 | 215 | 13432 | 22.11 | 1714 | 1768 | 527.5 |
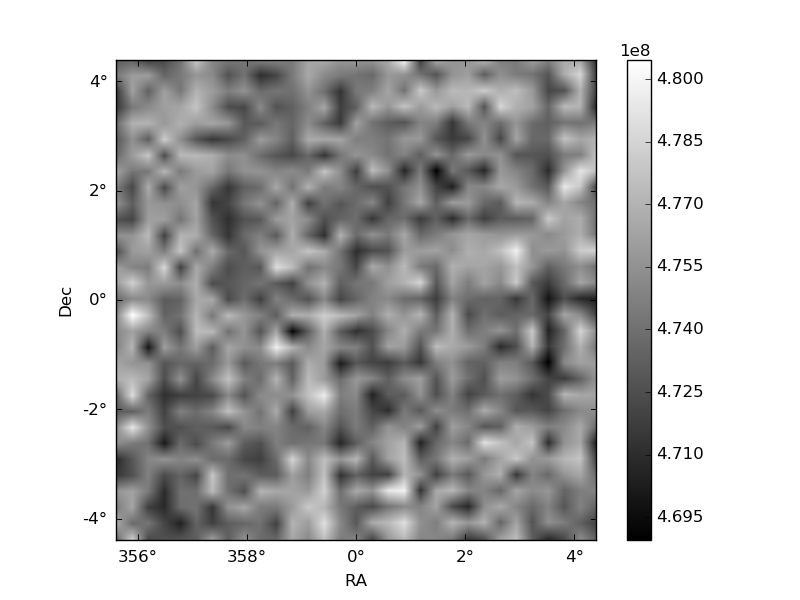
Histogram calculated using DETX and DETY for each event in the final _common_clean file
| Quadrant A | 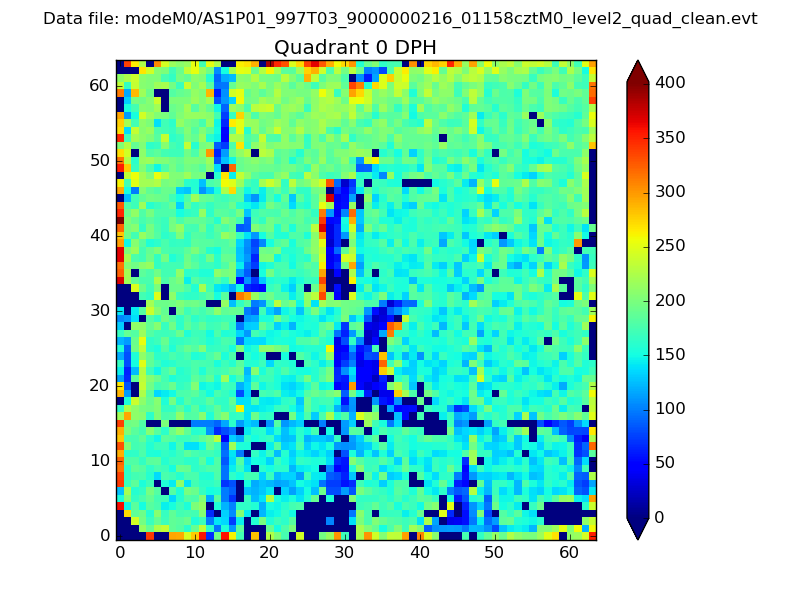 |
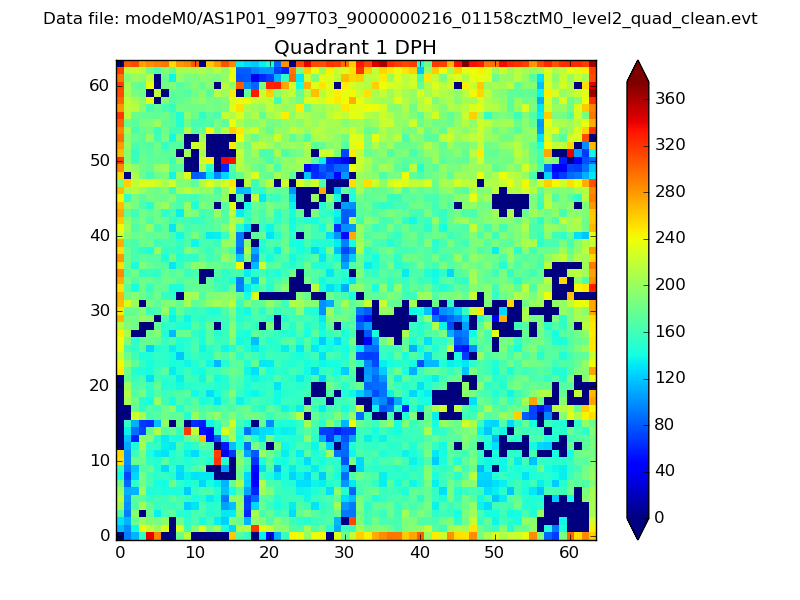 |
Quadrant B |
|---|---|---|---|
| Quadrant D | 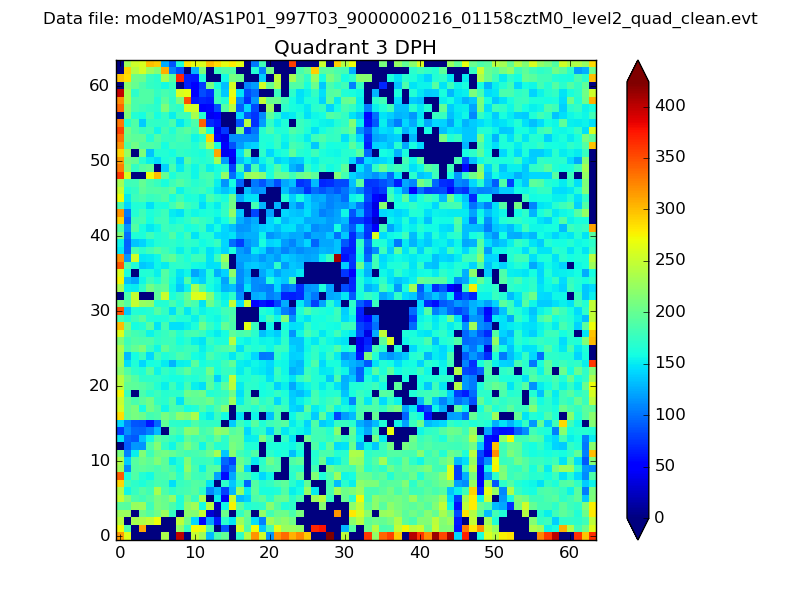 |
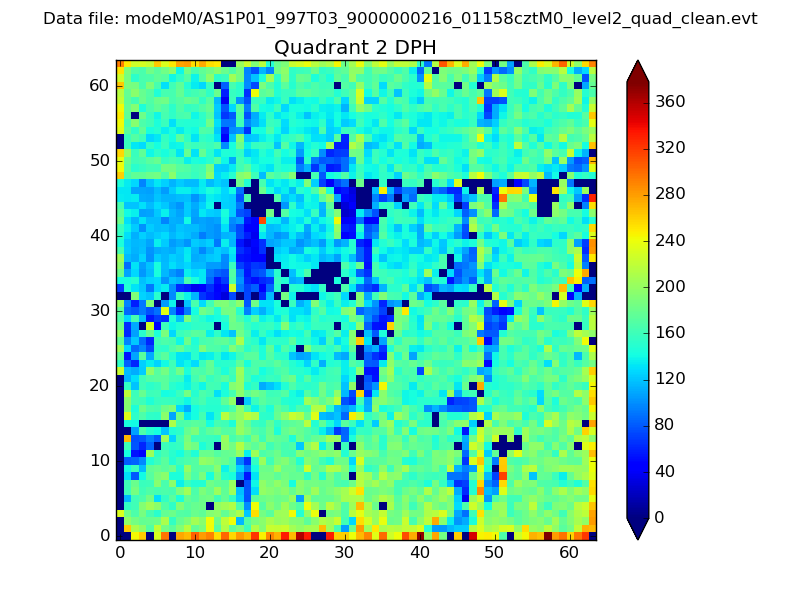 |
Quadrant C |
| Plot type | Count rate plots | Images |
|---|---|---|
| Comparison with Poisson distribution Blue bars denote a histogram of data divided into 1 sec bins. Red curve is a Poisson curve with rate = median count rate of data. |
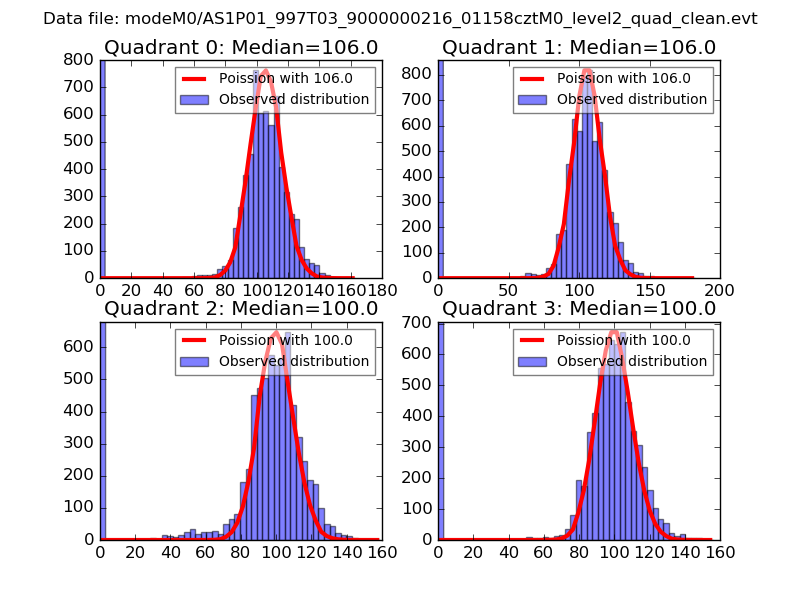 |
 |
| Quadrant-wise count rates Data is divided into 100 sec bins |
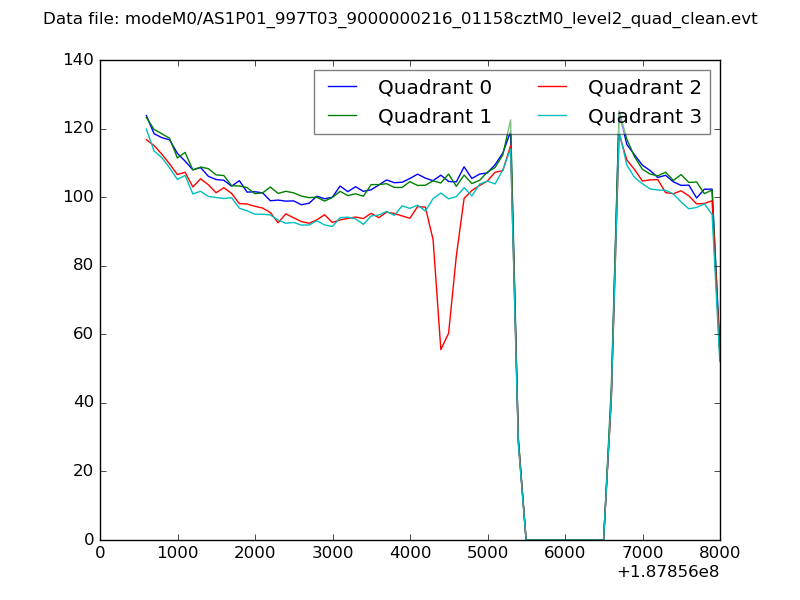 |
|
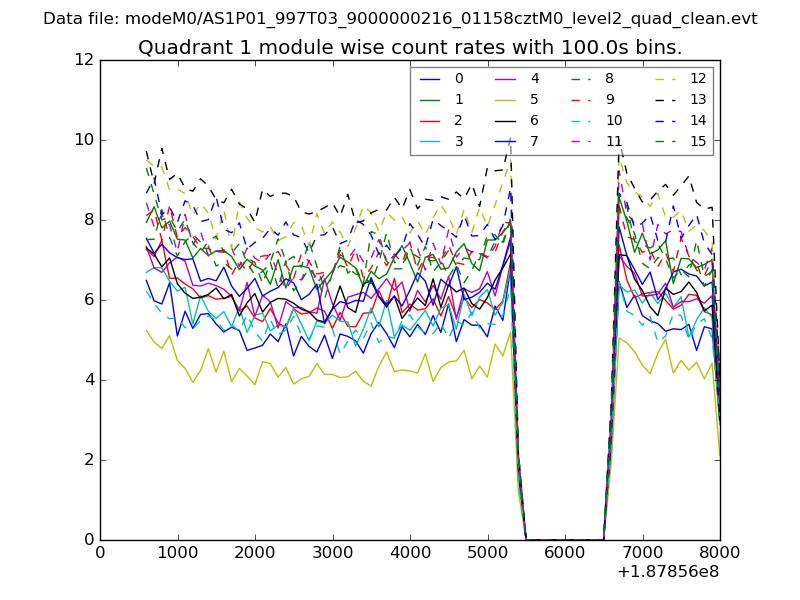
| Module-wise count rates for Quadrant A Data is divided into 100 sec bins |
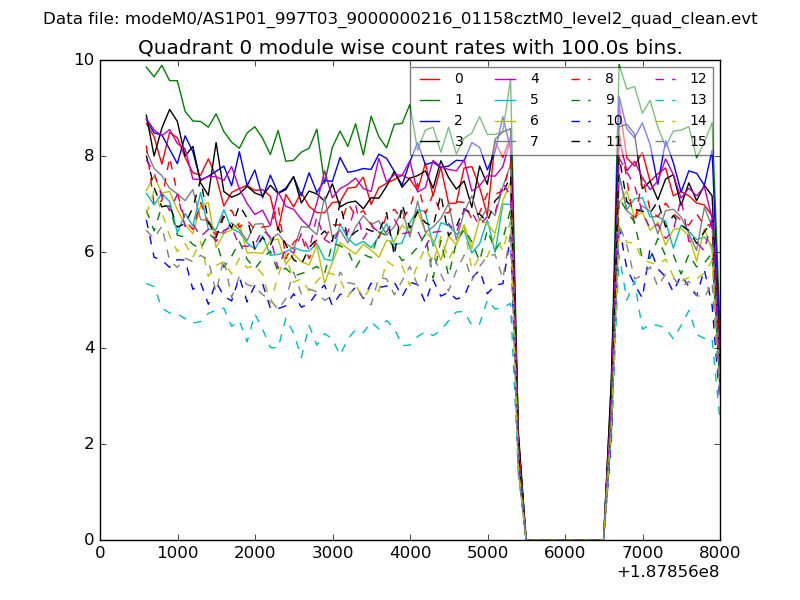 |
 |
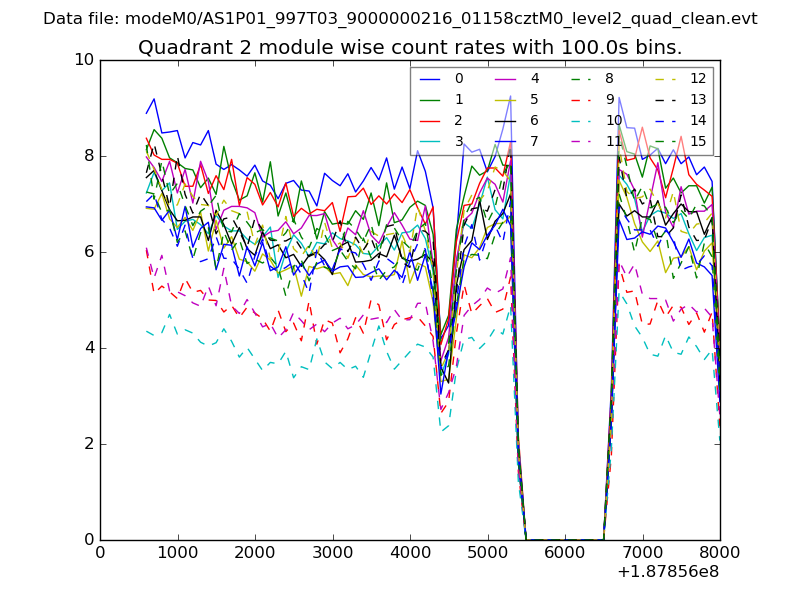
| Module-wise count rates for Quadrant B Data is divided into 100 sec bins |
 |
 |
| Module-wise count rates for Quadrant C Data is divided into 100 sec bins |
 |
 |
| Module-wise count rates for Quadrant D Data is divided into 100 sec bins |
 |
 |
| Parameter | Plot |
|---|---|
| CZT HV Monitor | 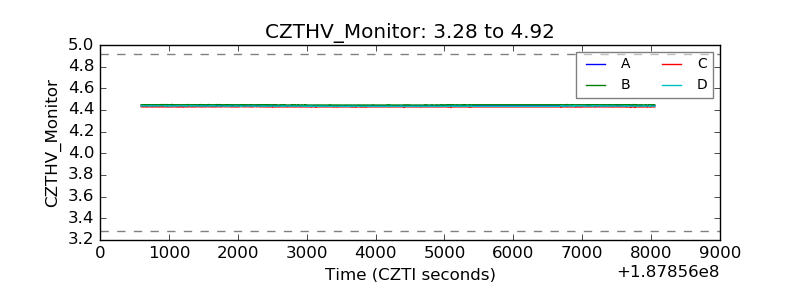 |
| D_VDD | 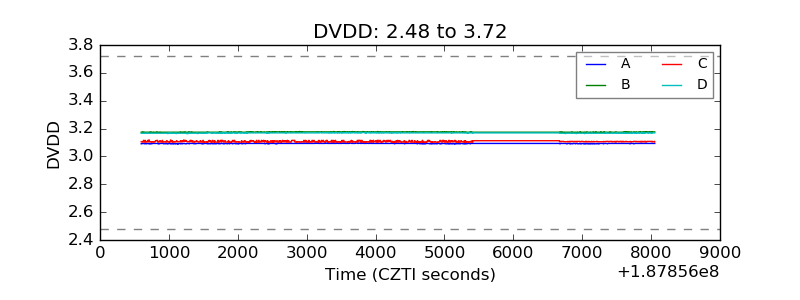 |
| Temperature 1 | 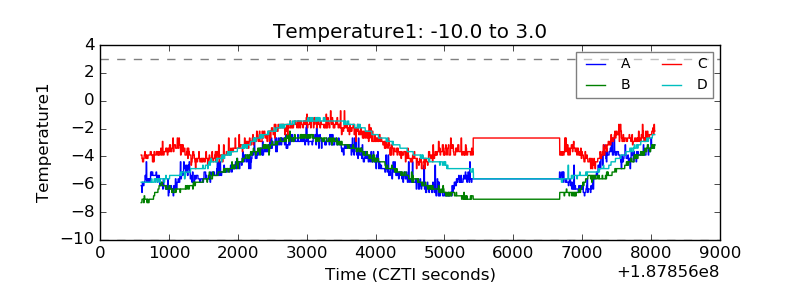 |
| Veto HV Monitor | 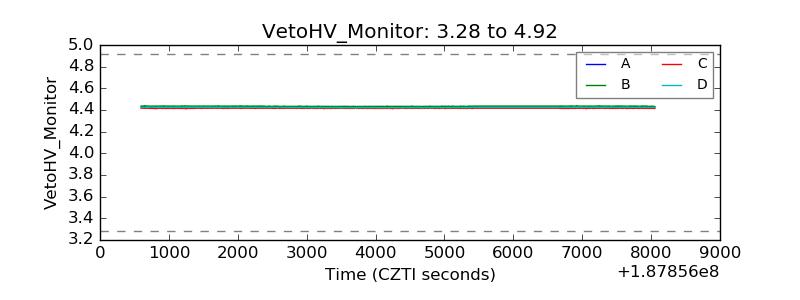 |
| Veto LLD | 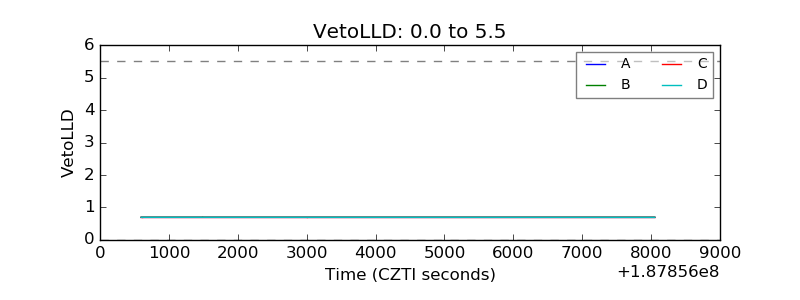 |
| Alpha Counter | 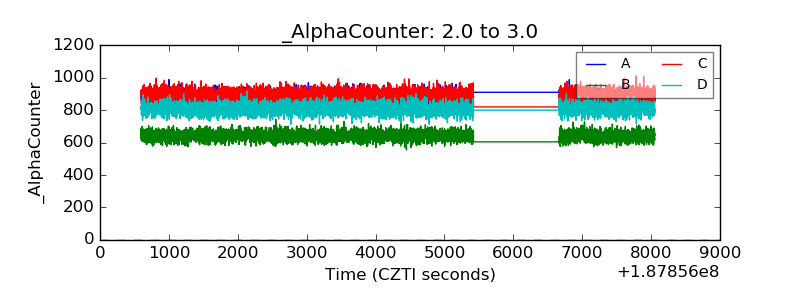 |
| _CPM_Rate | 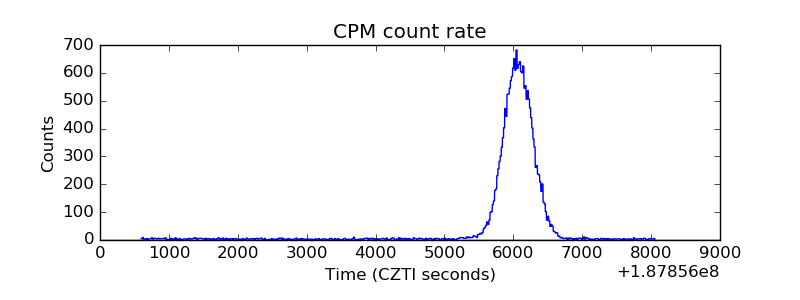 |
| CZT Counter | 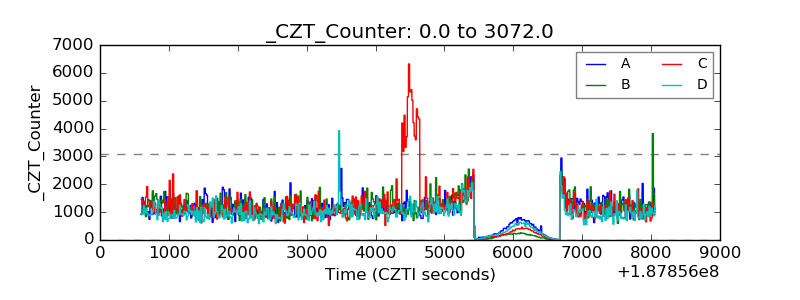 |
| +2.5 Volts monitor |  |
| +5 Volts monitor |  |
| _ROLL_ROT | 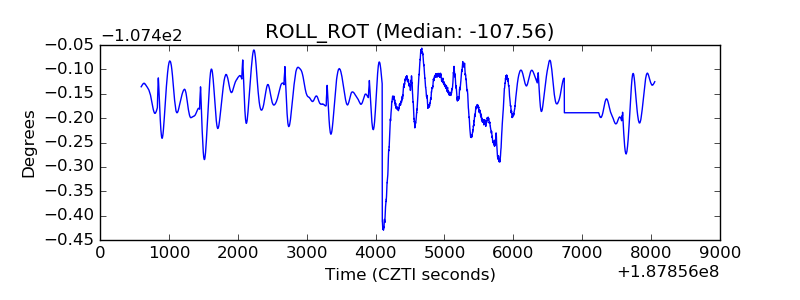 |
| _Roll_DEC | 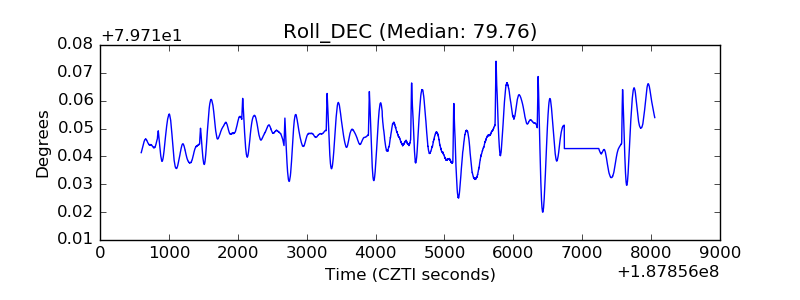 |
| _Roll_RA | 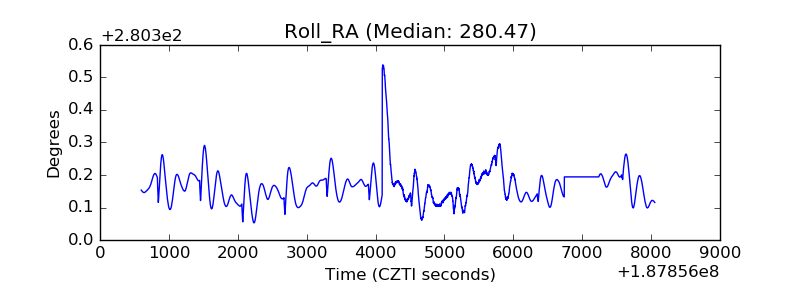 |
| Veto Counter | 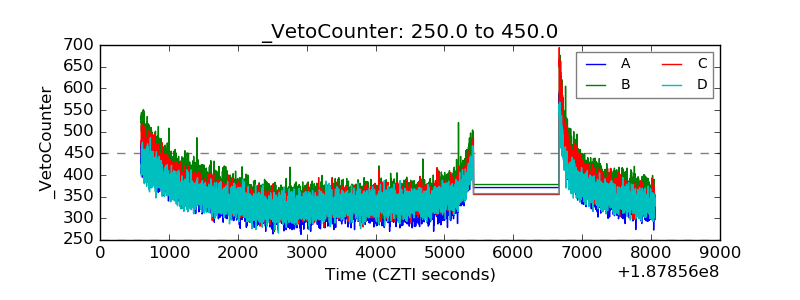 |