| Param | Original file | Final file |
|---|---|---|
| Filename | modeM0/AS1P01_997T03_9000000216_01159cztM0_level2.evt | modeM0/AS1P01_997T03_9000000216_01159cztM0_level2_quad_clean.evt |
| Size (bytes) | 941,587,200 | 92,960,640 |
| Size | 898.0 MB | 88.7 MB |
| Events in quadrant A | 7,170,016 | 612,807 |
| Events in quadrant B | 7,412,559 | 615,360 |
| Events in quadrant C | 6,965,798 | 587,384 |
| Events in quadrant D | 6,569,317 | 580,863 |
| Mode M0 | |||
|---|---|---|---|
| Quadrant | BADHDUFLAG | Total packets | Discarded packets |
| A | 0 | 25592 | 2 |
| B | 0 | 26297 | 1 |
| C | 0 | 24917 | 1 |
| D | 0 | 23752 | 1 |
| Mode SS | |||
|---|---|---|---|
| Quadrant | BADHDUFLAG | Total packets | Discarded packets |
| A | 0 | 122 | 0 |
| B | 0 | 122 | 0 |
| C | 0 | 122 | 0 |
| D | 0 | 122 | 0 |
| Mode M9 | |||
|---|---|---|---|
| Quadrant | BADHDUFLAG | Total packets | Discarded packets |
| A | 0 | 11 | 0 |
| B | 0 | 11 | 0 |
| C | 0 | 11 | 0 |
| D | 0 | 11 | 0 |
| Quadrant | Total seconds | Saturated seconds | Saturation percentage |
|---|---|---|---|
| A | 5997 | 29 | 0.483575% |
| B | 5997 | 11 | 0.183425% |
| C | 5997 | 5 | 0.083375% |
| D | 5997 | 14 | 0.233450% |
Noise dominated data is calculated using 1-second bins in cleaned event files. If a bin has >2000 counts, and if more than 50% of those come from <1% of pixels, then it is considered to be noise-dominated and hence unusable.
| Quadrant | # 1 sec bins | Bins with >0 counts | Bins with >2000 counts | High rate bins dominated by noise | Noise dominated (total time) | Noise dominated (detector-on time) | Marked lightcurve |
|---|---|---|---|---|---|---|---|
| A | 7062 | 5997 | 200 | 200 | 2.83% | 3.34% | 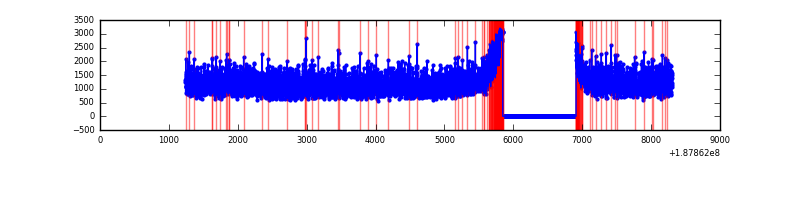 |
| B | 7062 | 5998 | 241 | 241 | 3.41% | 4.02% | 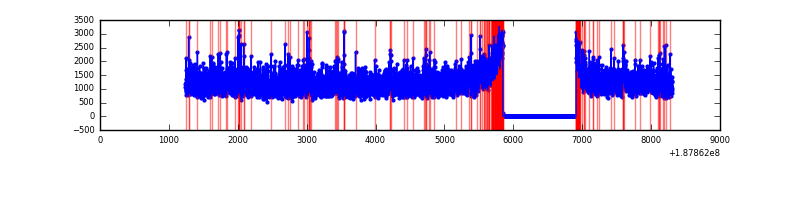 |
| C | 7062 | 5997 | 140 | 140 | 1.98% | 2.33% | 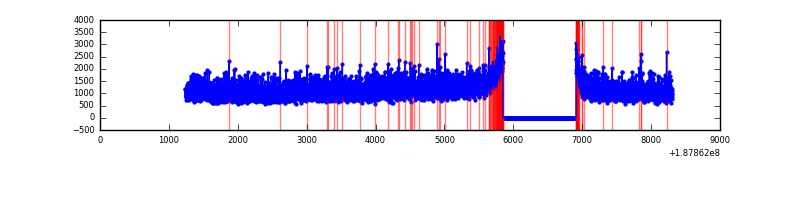 |
| D | 7062 | 5997 | 144 | 144 | 2.04% | 2.40% | 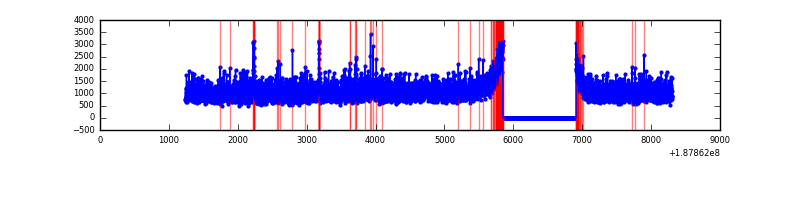 |
Top three noisy pixels from each quadrant. If the there are fewer than three noisy pixels in the level2.evt file, extra rows are filled as -1
| Pixel properties | Quadrant properties | ||||||
|---|---|---|---|---|---|---|---|
| Quadrant | DetID | PixID | Counts | Sigma | Mean | Median | Sigma |
| A | 12 | 243 | 30684 | 64.78 | 1855 | 1868 | 444.8 |
| A | 4 | 32 | 17888 | 36.01 | 1855 | 1868 | 444.8 |
| A | 11 | 79 | 7520 | 12.71 | 1855 | 1868 | 444.8 |
| B | 15 | 22 | 89163 | 194.03 | 1892 | 1899 | 449.7 |
| B | 6 | 53 | 34096 | 71.59 | 1892 | 1899 | 449.7 |
| B | 0 | 190 | 29370 | 61.08 | 1892 | 1899 | 449.7 |
| C | 15 | 241 | 267349 | 557.01 | 1703 | 1761 | 476.8 |
| C | 3 | 111 | 20629 | 39.57 | 1703 | 1761 | 476.8 |
| C | 3 | 79 | 18017 | 34.09 | 1703 | 1761 | 476.8 |
| D | 10 | 125 | 155789 | 295.61 | 1691 | 1746 | 521.1 |
| D | 2 | 152 | 36188 | 66.1 | 1691 | 1746 | 521.1 |
| D | 13 | 169 | 28151 | 50.67 | 1691 | 1746 | 521.1 |
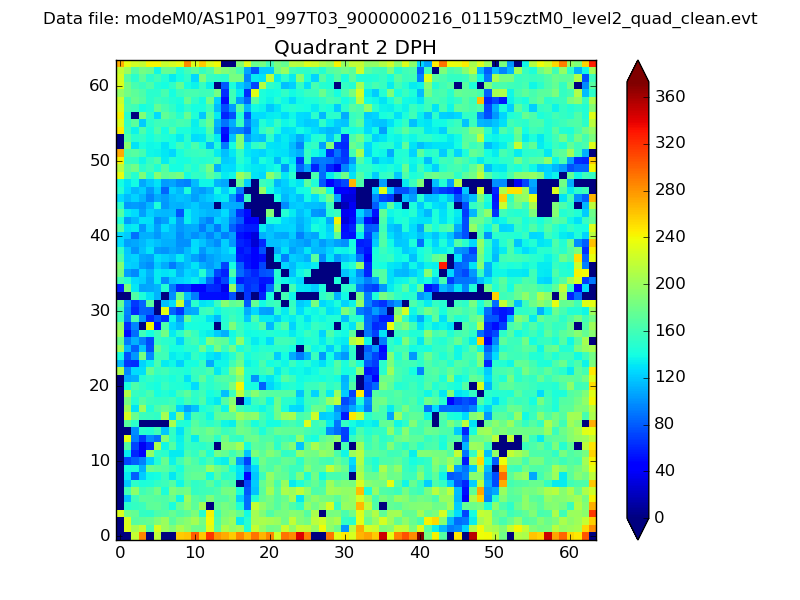
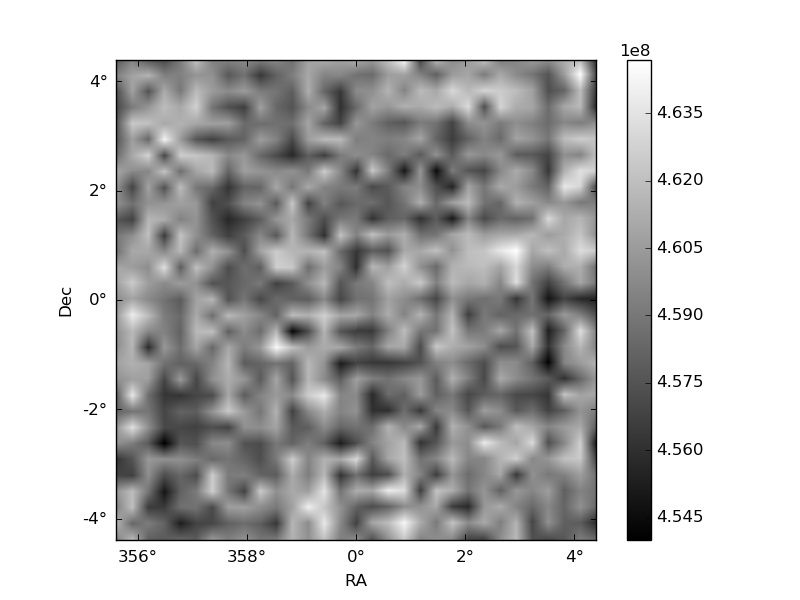
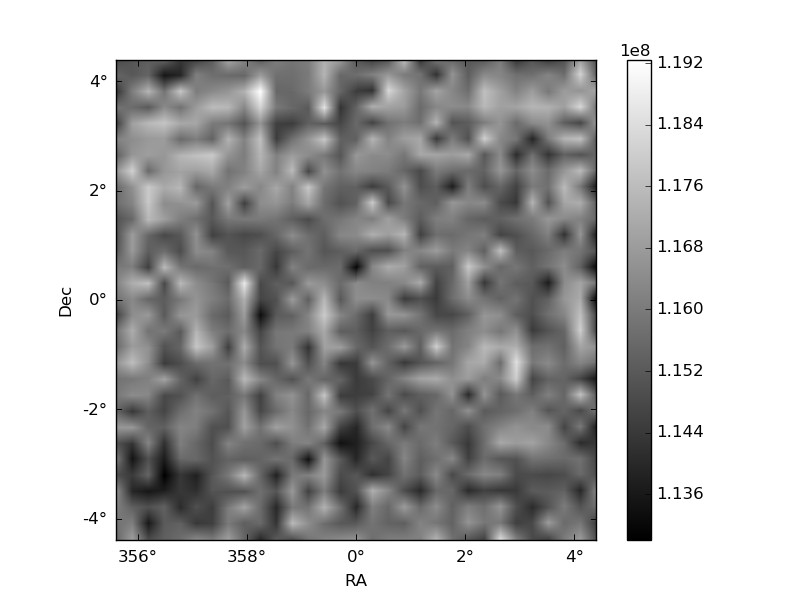
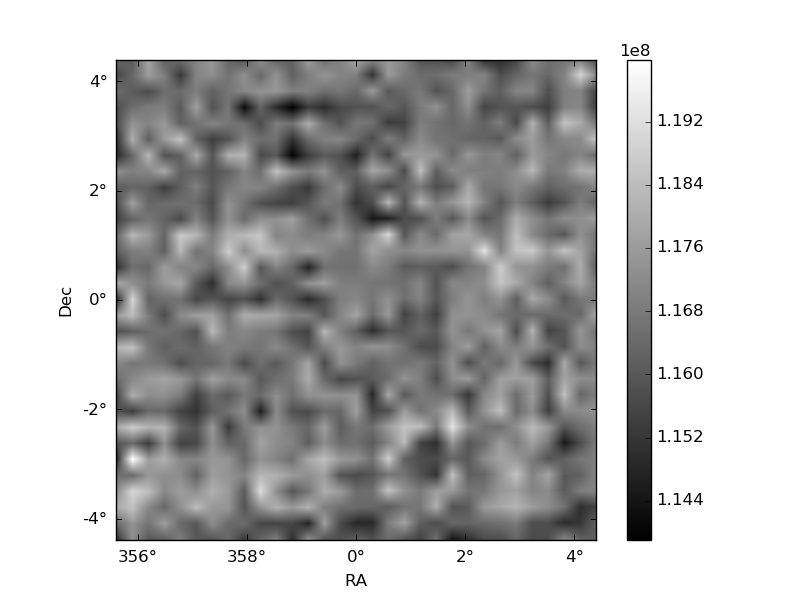
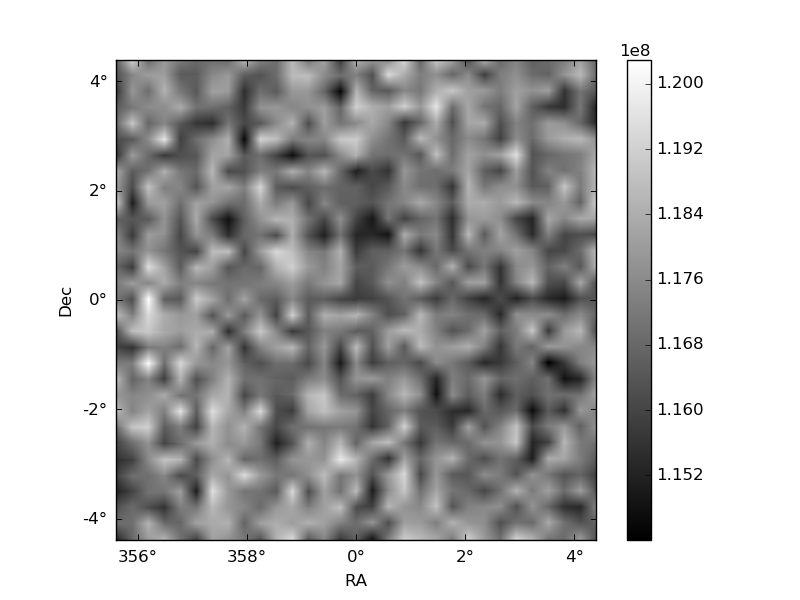
Histogram calculated using DETX and DETY for each event in the final _common_clean file
| Quadrant A | 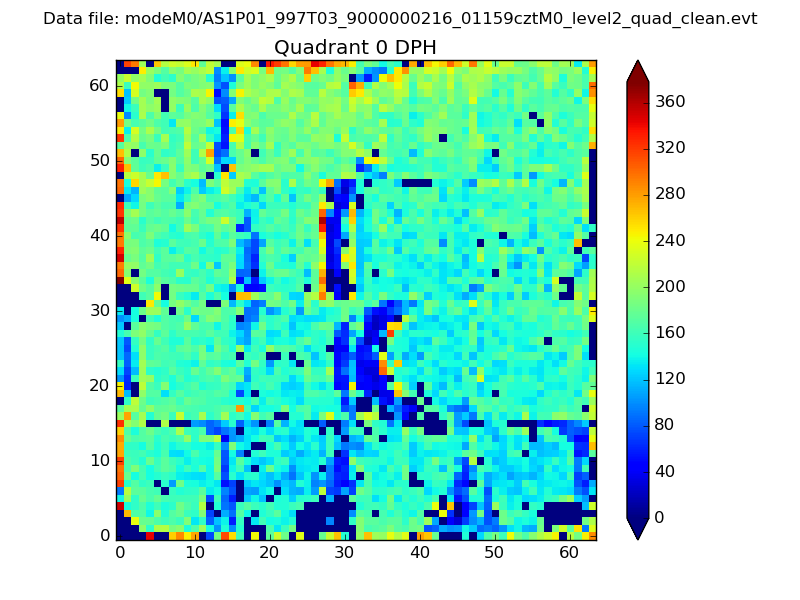 |
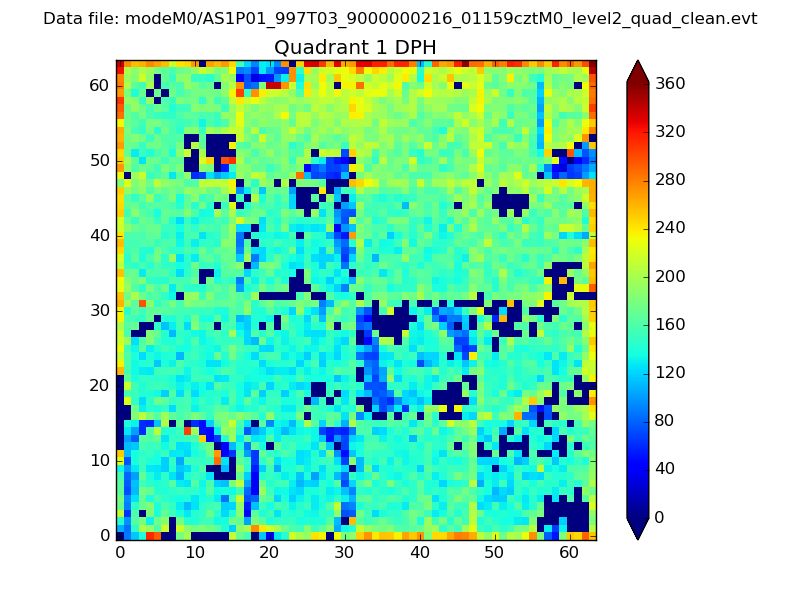 |
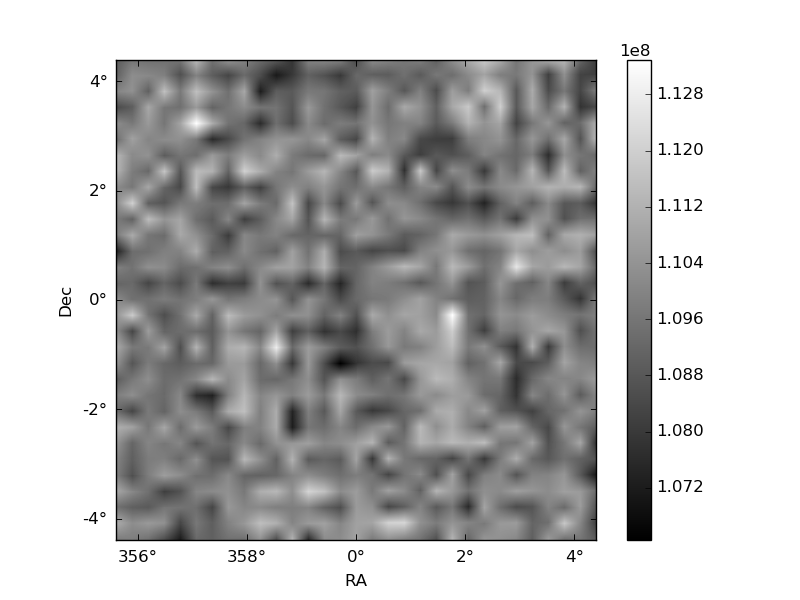
Quadrant B |
|---|---|---|---|
| Quadrant D | 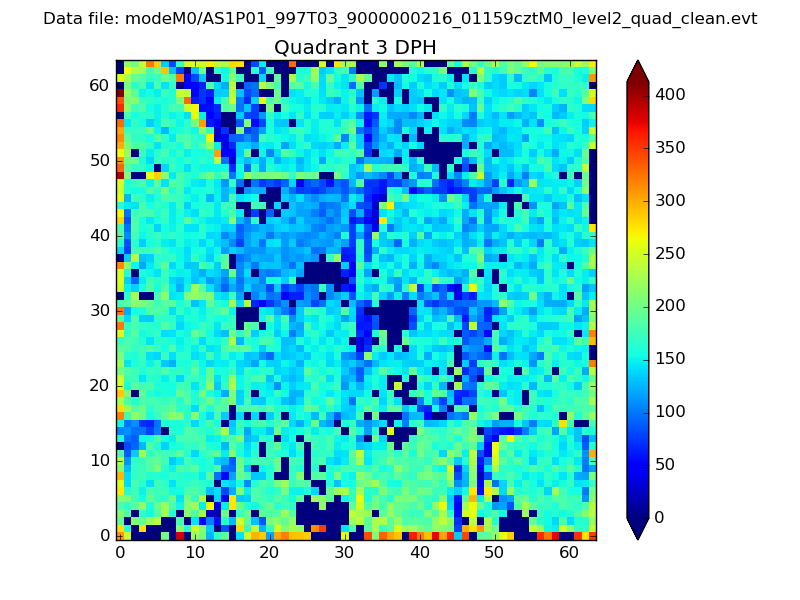 |
 |
Quadrant C |
| Plot type | Count rate plots | Images |
|---|---|---|
| Comparison with Poisson distribution Blue bars denote a histogram of data divided into 1 sec bins. Red curve is a Poisson curve with rate = median count rate of data. |
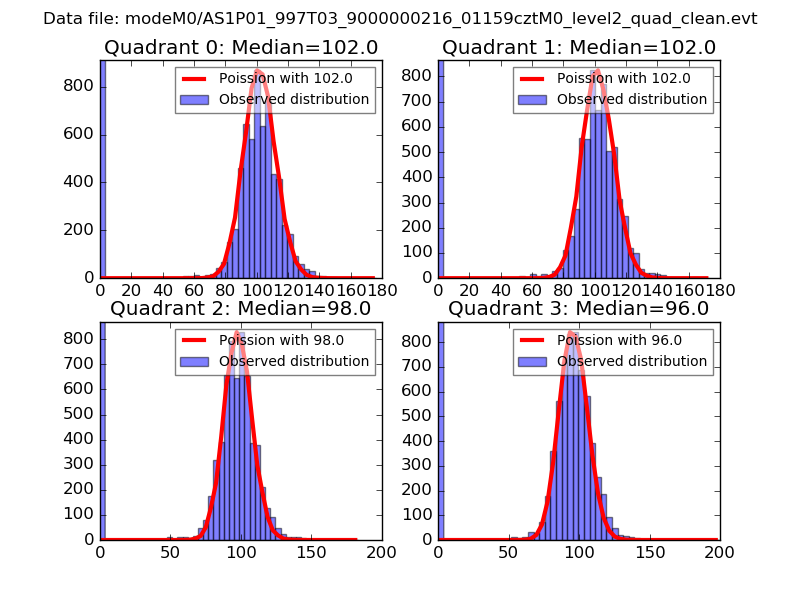 |
 |
| Quadrant-wise count rates Data is divided into 100 sec bins |
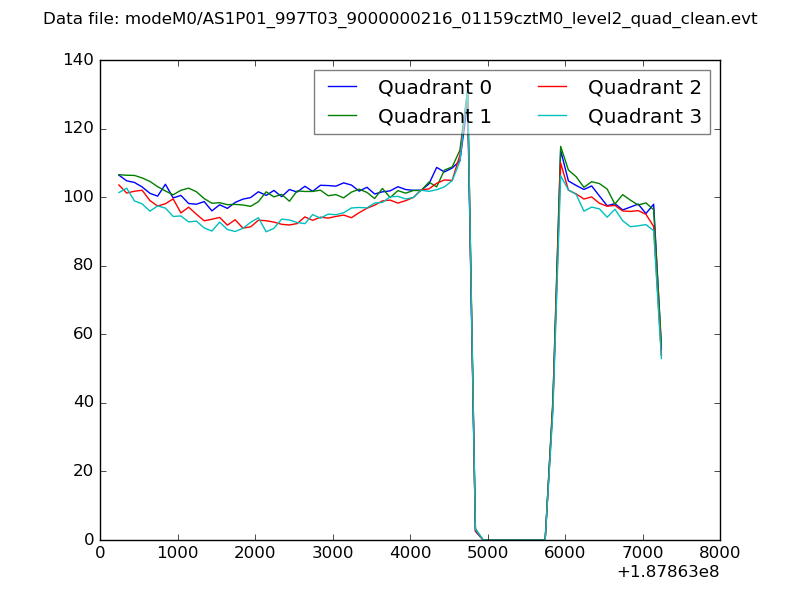 |
|
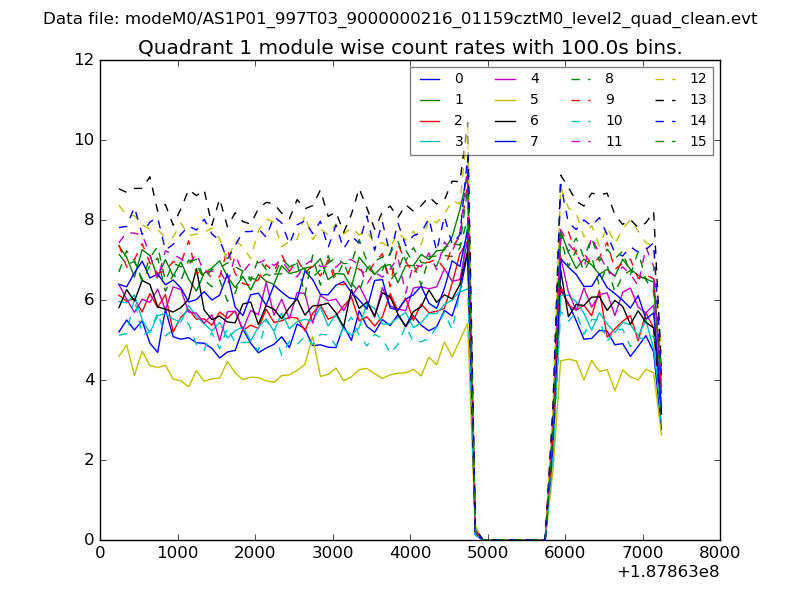
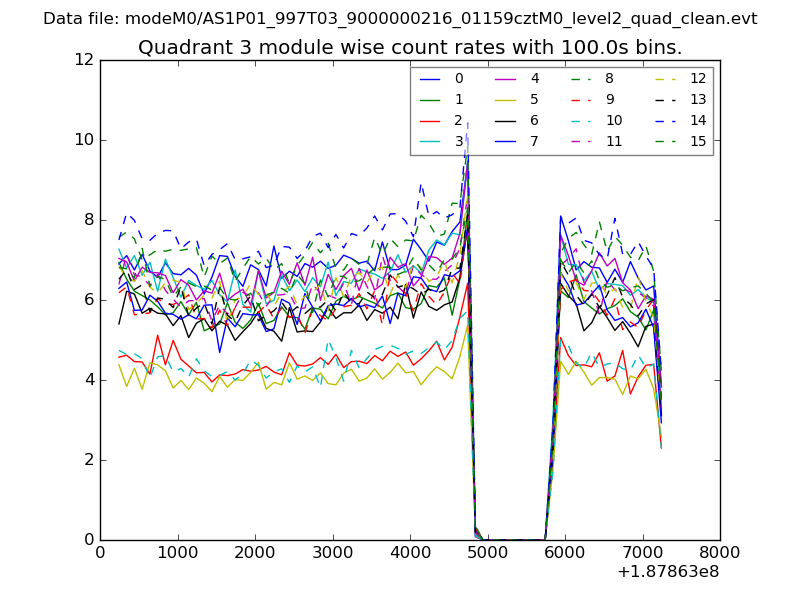
| Module-wise count rates for Quadrant A Data is divided into 100 sec bins |
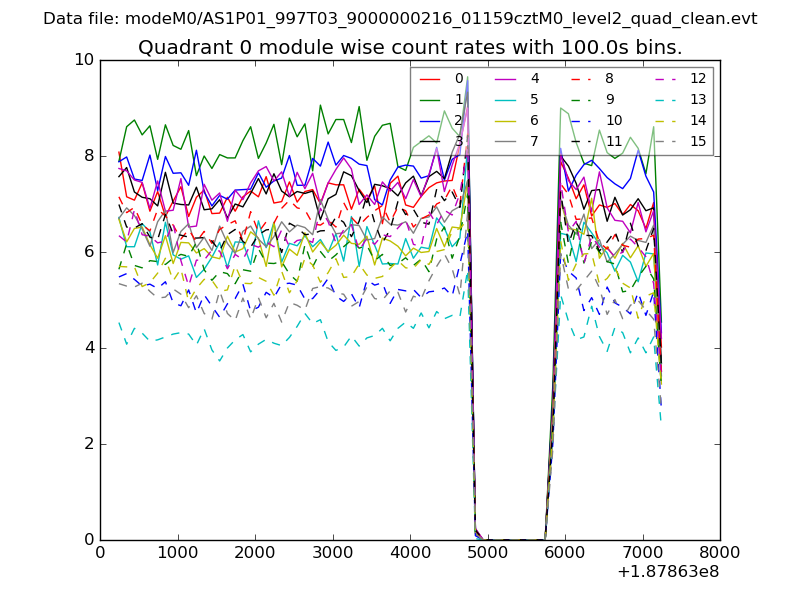 |
 |
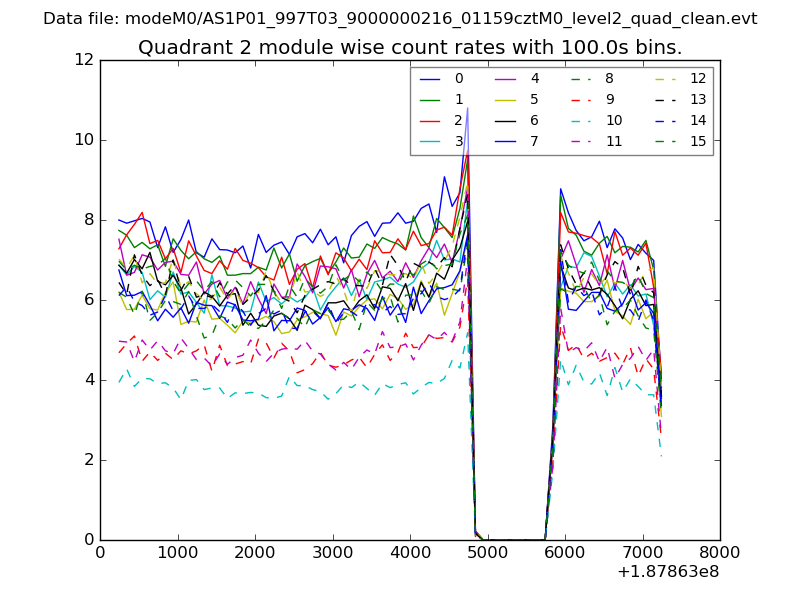
| Module-wise count rates for Quadrant B Data is divided into 100 sec bins |
 |
 |
| Module-wise count rates for Quadrant C Data is divided into 100 sec bins |
 |
 |
| Module-wise count rates for Quadrant D Data is divided into 100 sec bins |
 |
 |
| Parameter | Plot |
|---|---|
| CZT HV Monitor | 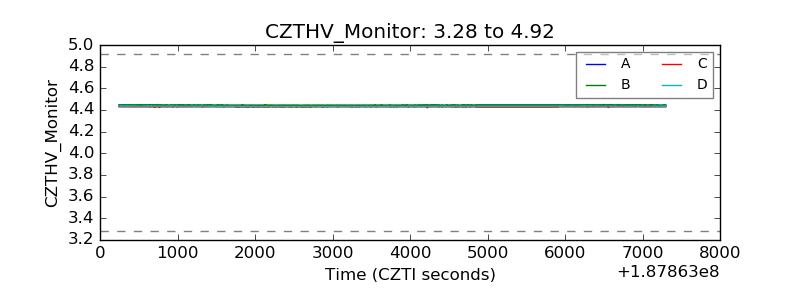 |
| D_VDD | 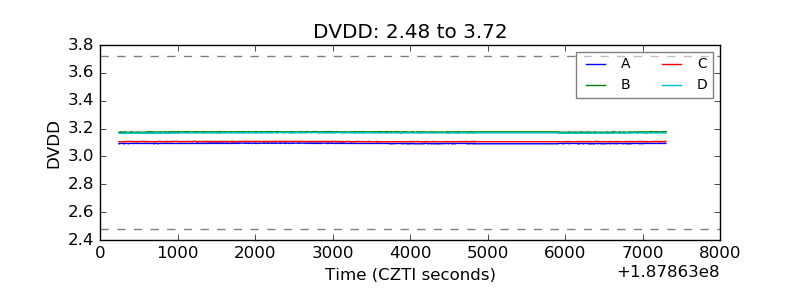 |
| Temperature 1 | 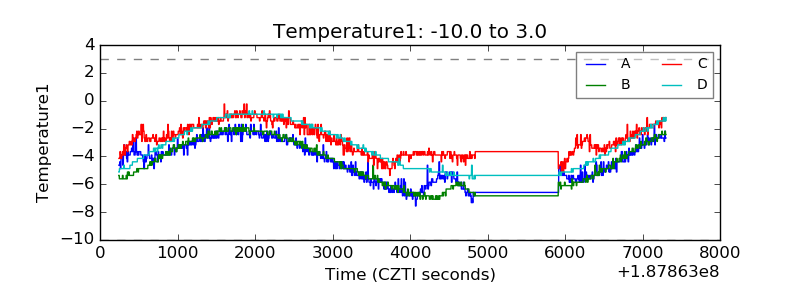 |
| Veto HV Monitor | 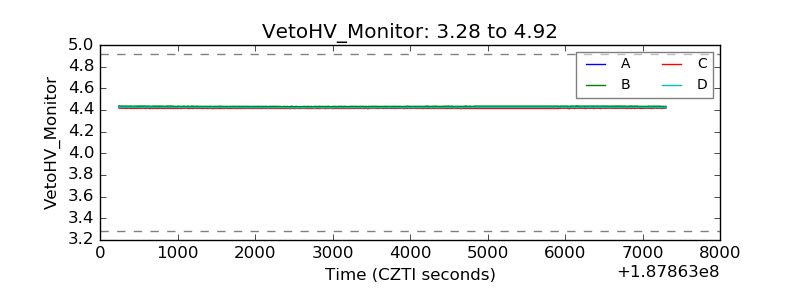 |
| Veto LLD | 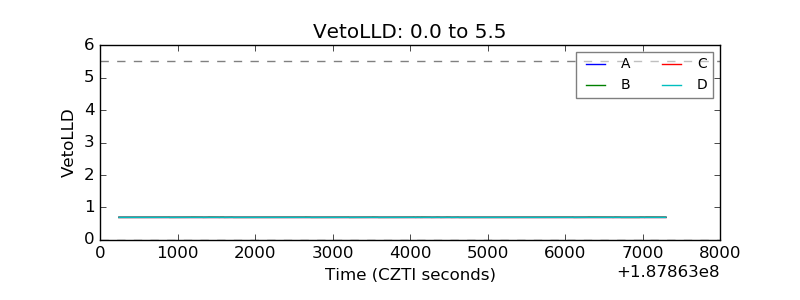 |
| Alpha Counter | 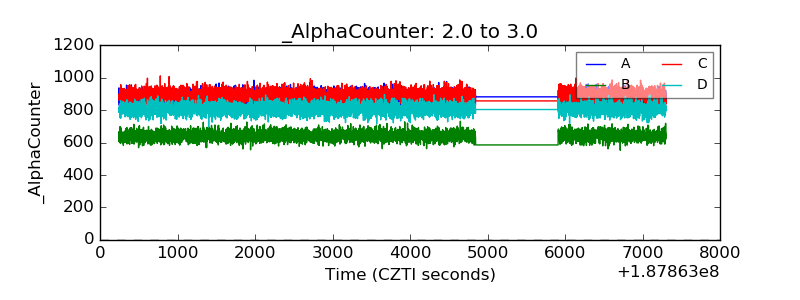 |
| _CPM_Rate | 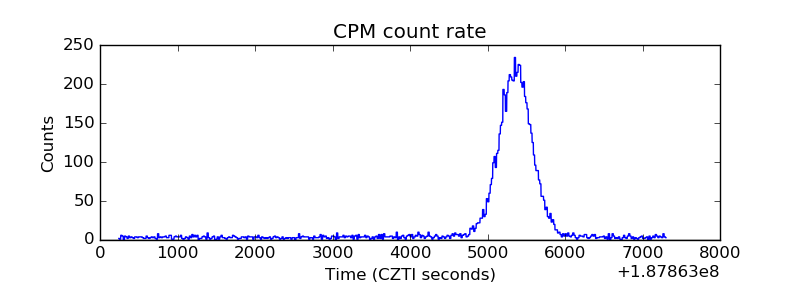 |
| CZT Counter | 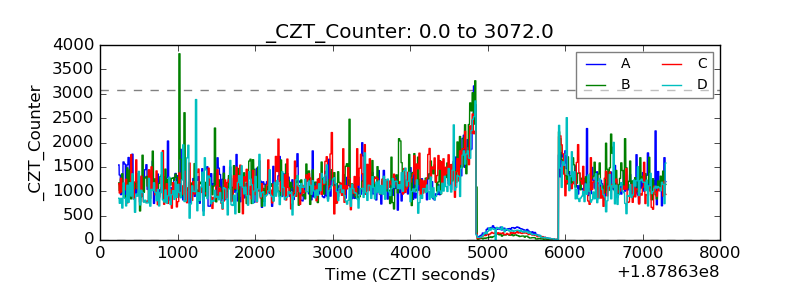 |
| +2.5 Volts monitor |  |
| +5 Volts monitor |  |
| _ROLL_ROT | 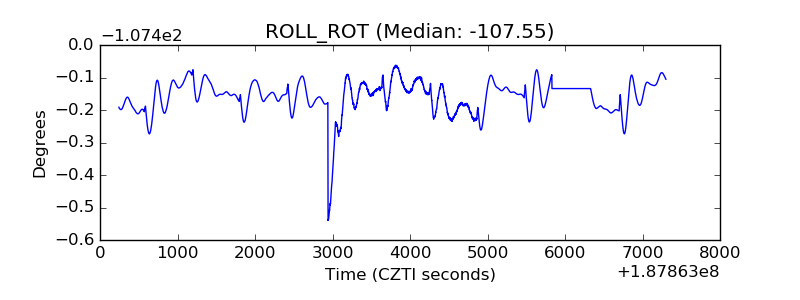 |
| _Roll_DEC | 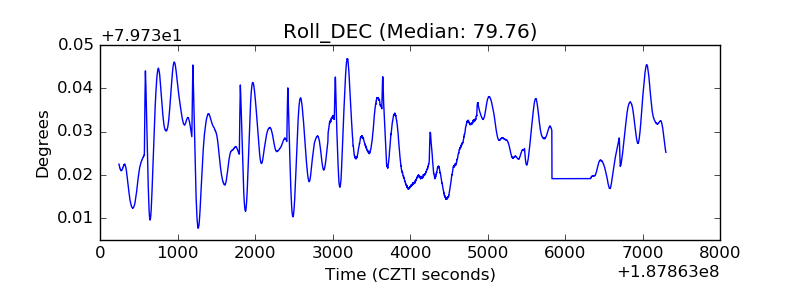 |
| _Roll_RA | 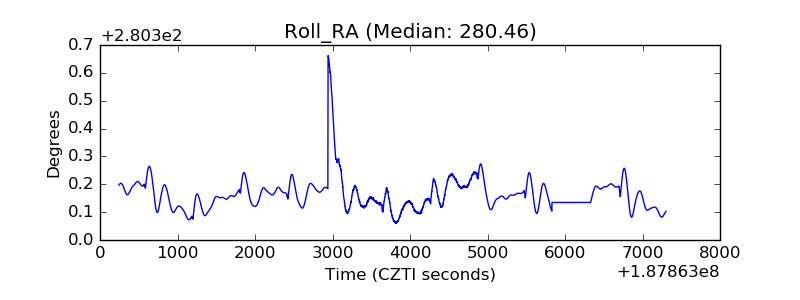 |
| Veto Counter | 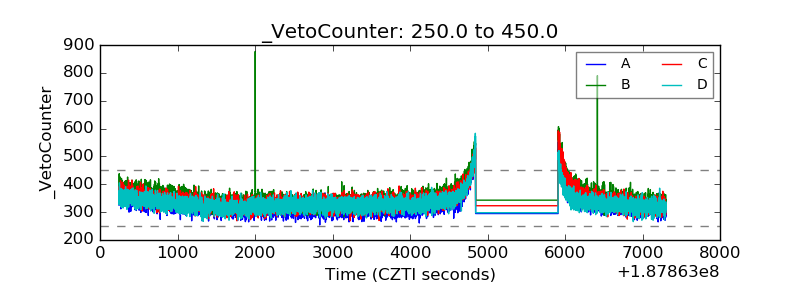 |