| Param | Original file | Final file |
|---|---|---|
| Filename | modeM0/AS1P01_997T03_9000000216_01162cztM0_level2.evt | modeM0/AS1P01_997T03_9000000216_01162cztM0_level2_quad_clean.evt |
| Size (bytes) | 1,230,917,760 | 113,506,560 |
| Size | 1.1 GB | 108.2 MB |
| Events in quadrant A | 9,361,089 | 746,527 |
| Events in quadrant B | 9,667,339 | 739,981 |
| Events in quadrant C | 9,259,182 | 712,430 |
| Events in quadrant D | 8,487,025 | 709,417 |
| Mode M0 | |||
|---|---|---|---|
| Quadrant | BADHDUFLAG | Total packets | Discarded packets |
| A | 0 | 33201 | 2 |
| B | 0 | 34073 | 1 |
| C | 0 | 32929 | 1 |
| D | 0 | 30611 | 1 |
| Mode SS | |||
|---|---|---|---|
| Quadrant | BADHDUFLAG | Total packets | Discarded packets |
| A | 0 | 152 | 0 |
| B | 0 | 152 | 0 |
| C | 0 | 152 | 0 |
| D | 0 | 152 | 0 |
| Quadrant | Total seconds | Saturated seconds | Saturation percentage |
|---|---|---|---|
| A | 7612 | 11 | 0.144509% |
| B | 7612 | 24 | 0.315292% |
| C | 7612 | 14 | 0.183920% |
| D | 7612 | 20 | 0.262743% |
Noise dominated data is calculated using 1-second bins in cleaned event files. If a bin has >2000 counts, and if more than 50% of those come from <1% of pixels, then it is considered to be noise-dominated and hence unusable.
| Quadrant | # 1 sec bins | Bins with >0 counts | Bins with >2000 counts | High rate bins dominated by noise | Noise dominated (total time) | Noise dominated (detector-on time) | Marked lightcurve |
|---|---|---|---|---|---|---|---|
| A | 7637 | 7613 | 316 | 316 | 4.14% | 4.15% | 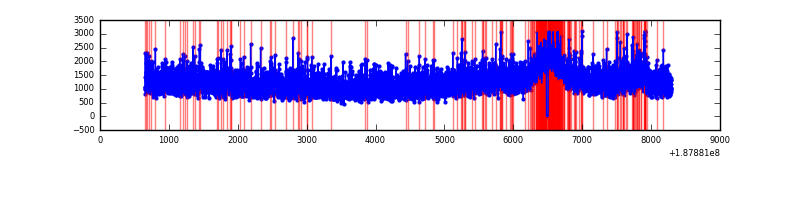 |
| B | 7637 | 7613 | 363 | 363 | 4.75% | 4.77% | 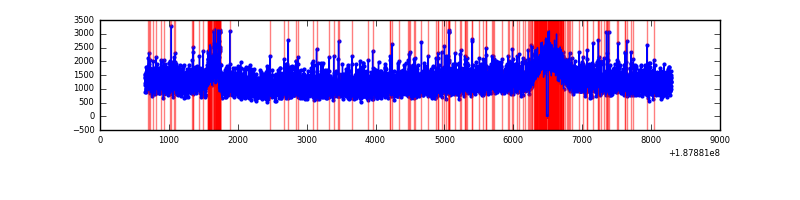 |
| C | 7637 | 7613 | 277 | 277 | 3.63% | 3.64% | 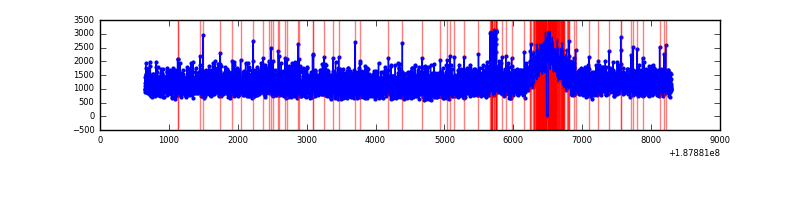 |
| D | 7637 | 7613 | 233 | 233 | 3.05% | 3.06% | 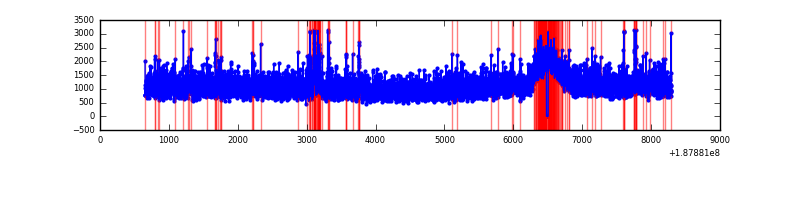 |
Top three noisy pixels from each quadrant. If the there are fewer than three noisy pixels in the level2.evt file, extra rows are filled as -1
| Pixel properties | Quadrant properties | ||||||
|---|---|---|---|---|---|---|---|
| Quadrant | DetID | PixID | Counts | Sigma | Mean | Median | Sigma |
| A | 12 | 243 | 142437 | 246.2 | 2367 | 2386 | 568.9 |
| A | 4 | 32 | 133524 | 230.53 | 2367 | 2386 | 568.9 |
| A | 11 | 79 | 8645 | 11.0 | 2367 | 2386 | 568.9 |
| B | 6 | 53 | 145211 | 245.97 | 2447 | 2458 | 580.4 |
| B | 15 | 22 | 59926 | 99.02 | 2447 | 2458 | 580.4 |
| B | 14 | 53 | 44087 | 71.73 | 2447 | 2458 | 580.4 |
| C | 15 | 241 | 381290 | 608.39 | 2231 | 2308 | 622.9 |
| C | 9 | 83 | 64726 | 100.2 | 2231 | 2308 | 622.9 |
| C | 3 | 111 | 34288 | 51.34 | 2231 | 2308 | 622.9 |
| D | 13 | 252 | 82942 | 119.7 | 2188 | 2265 | 674.0 |
| D | 10 | 125 | 75812 | 109.12 | 2188 | 2265 | 674.0 |
| D | 10 | 215 | 37935 | 52.92 | 2188 | 2265 | 674.0 |
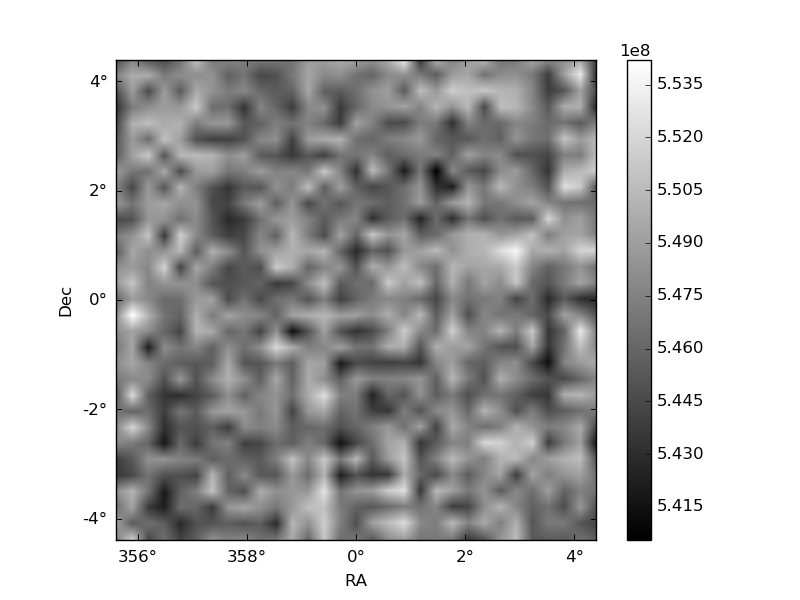
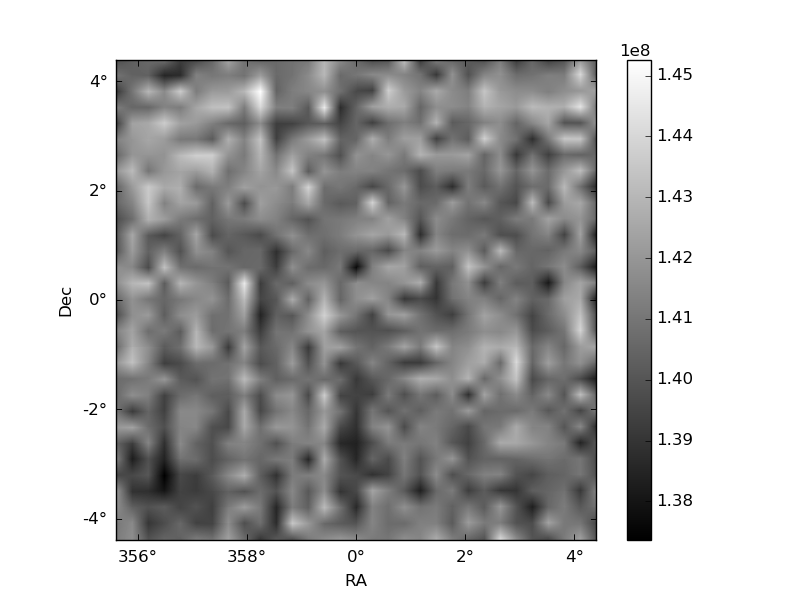
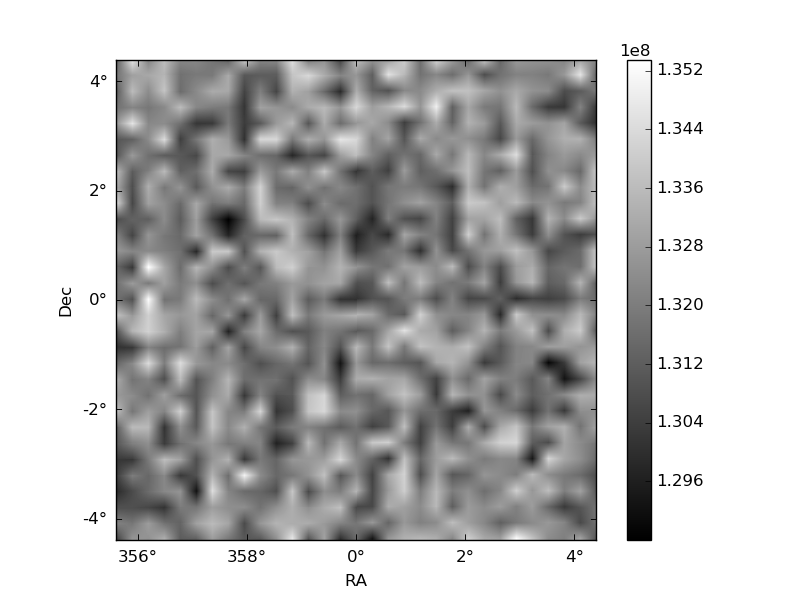
Histogram calculated using DETX and DETY for each event in the final _common_clean file
| Quadrant A | 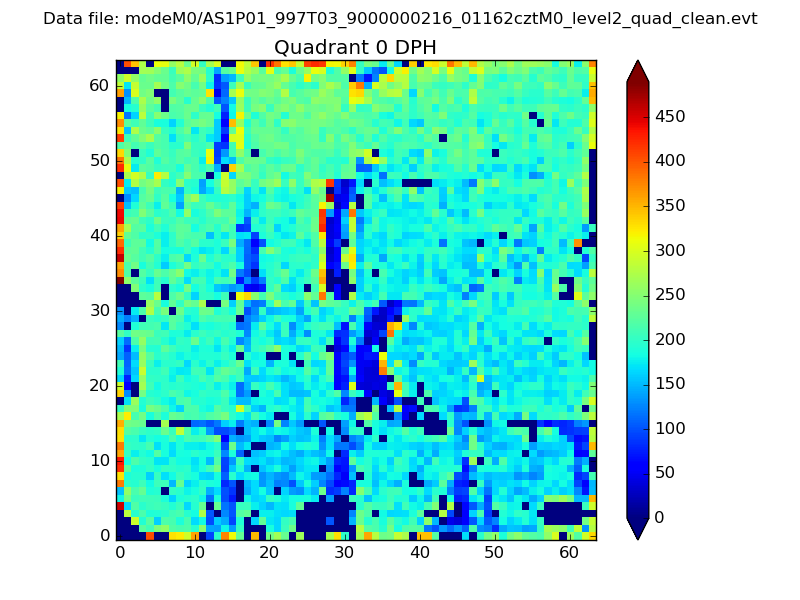 |
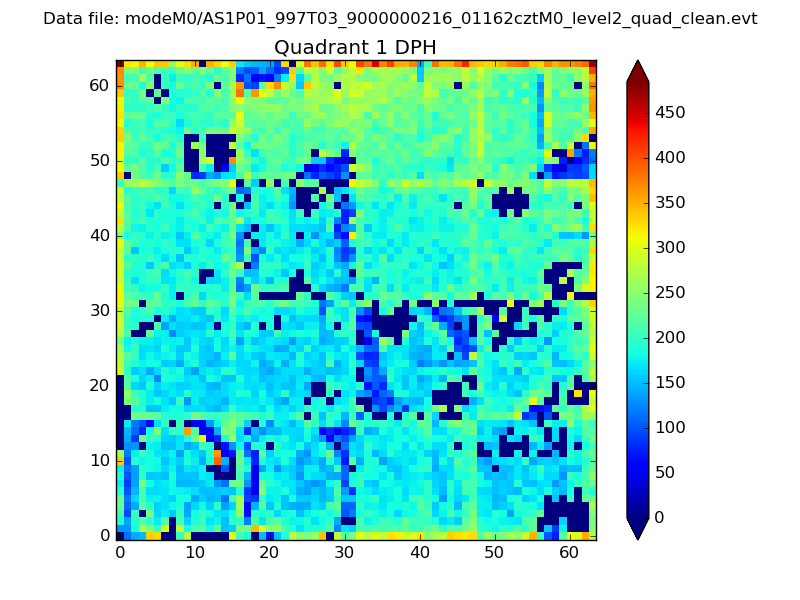 |
Quadrant B |
|---|---|---|---|
| Quadrant D |  |
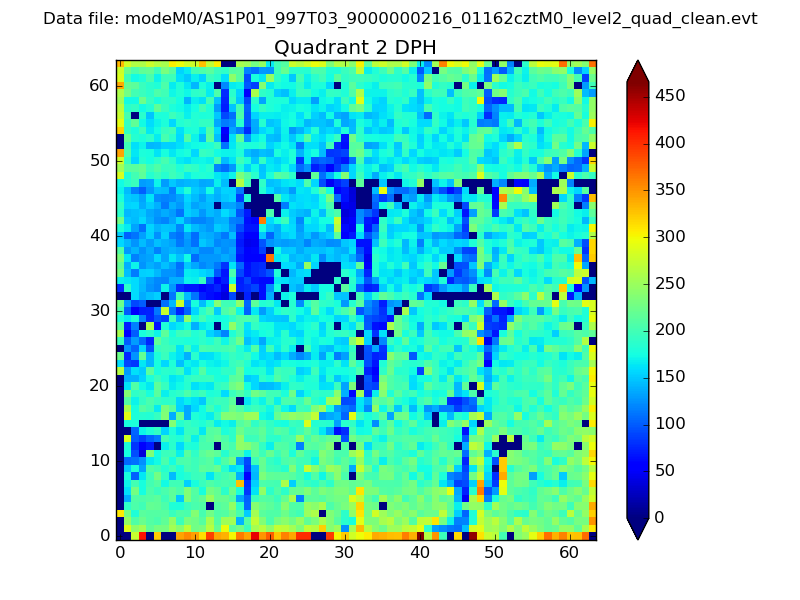 |
Quadrant C |
| Plot type | Count rate plots | Images |
|---|---|---|
| Comparison with Poisson distribution Blue bars denote a histogram of data divided into 1 sec bins. Red curve is a Poisson curve with rate = median count rate of data. |
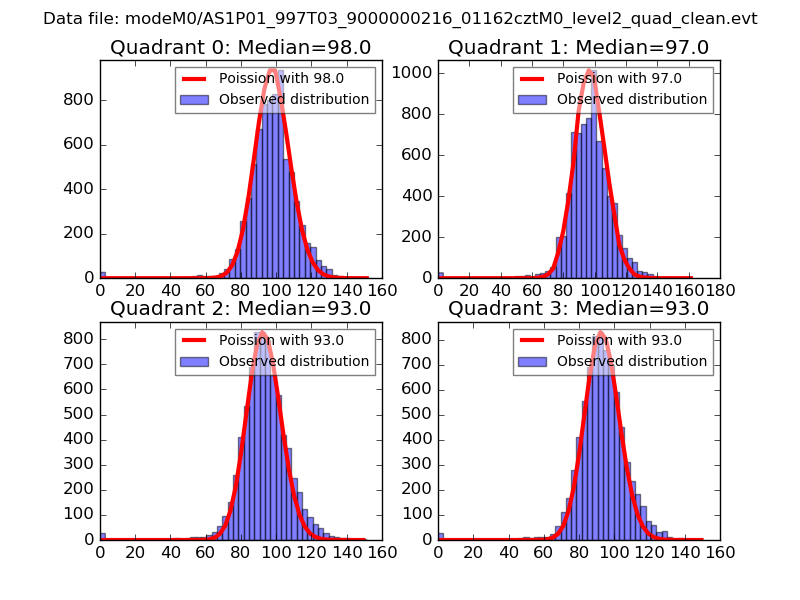 |
 |
| Quadrant-wise count rates Data is divided into 100 sec bins |
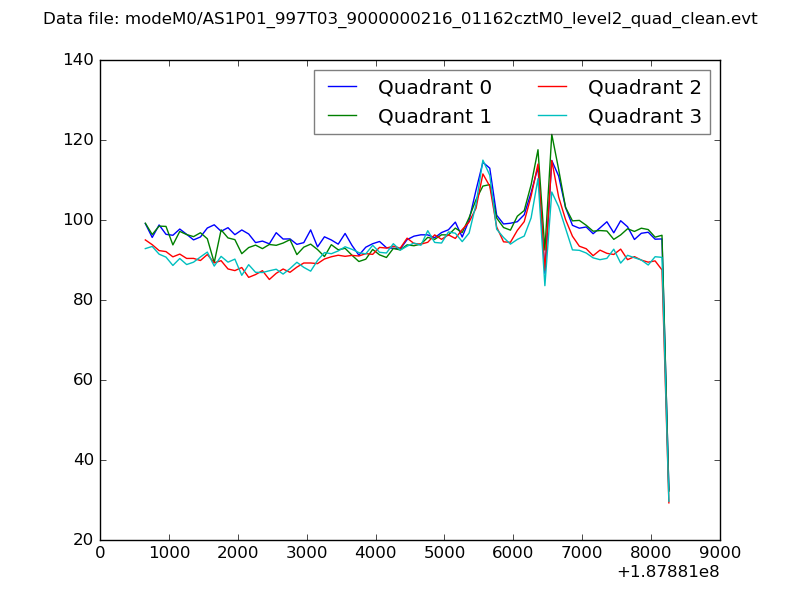 |
|
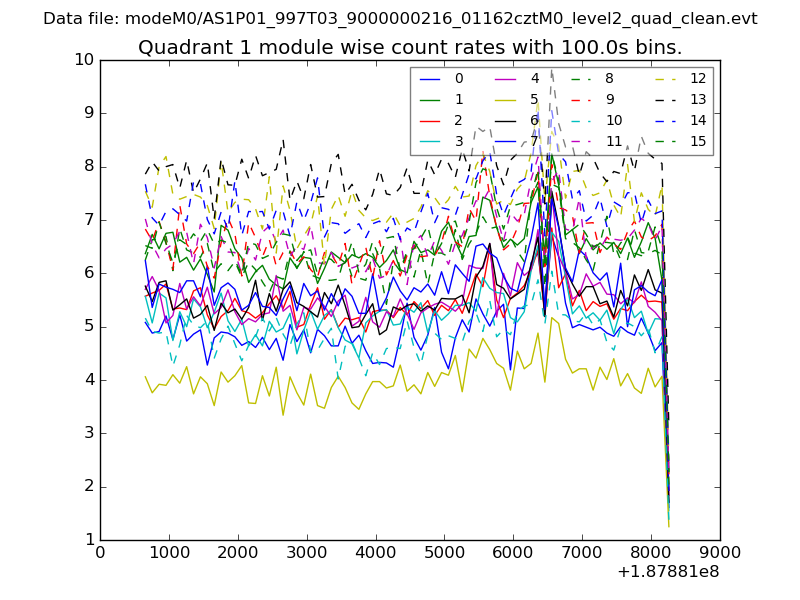
| Module-wise count rates for Quadrant A Data is divided into 100 sec bins |
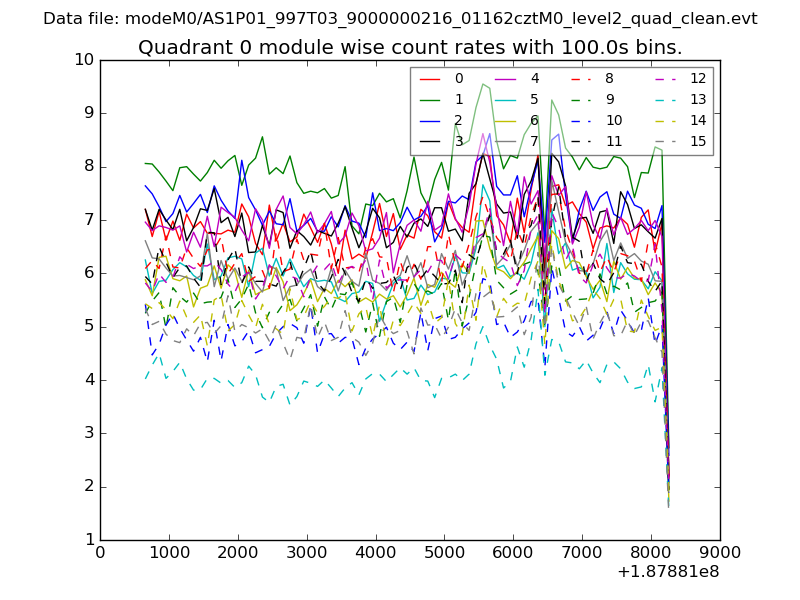 |
 |
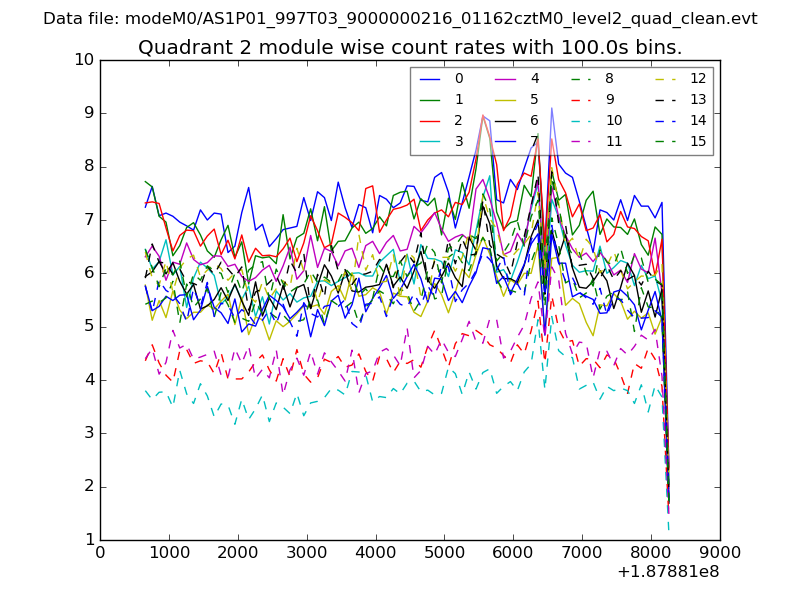
| Module-wise count rates for Quadrant B Data is divided into 100 sec bins |
 |
 |
| Module-wise count rates for Quadrant C Data is divided into 100 sec bins |
 |
 |
| Module-wise count rates for Quadrant D Data is divided into 100 sec bins |
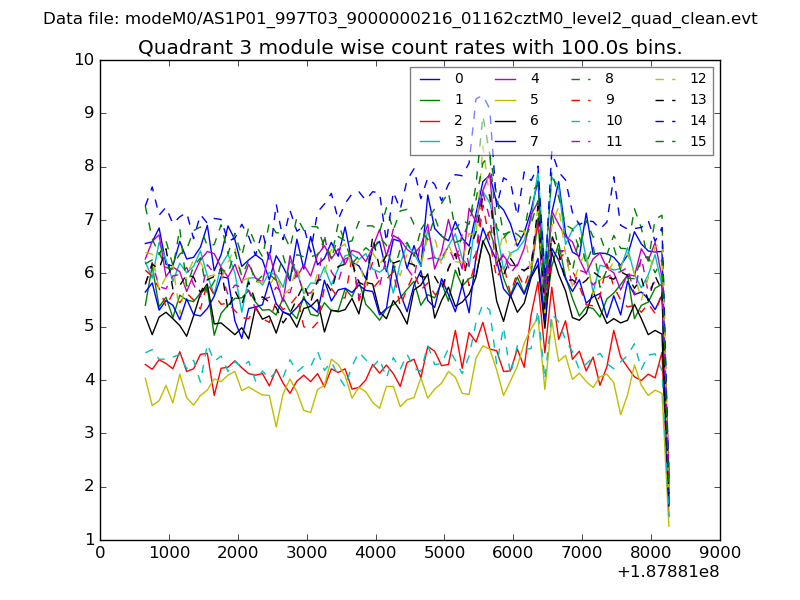 |
 |
| Parameter | Plot |
|---|---|
| CZT HV Monitor | 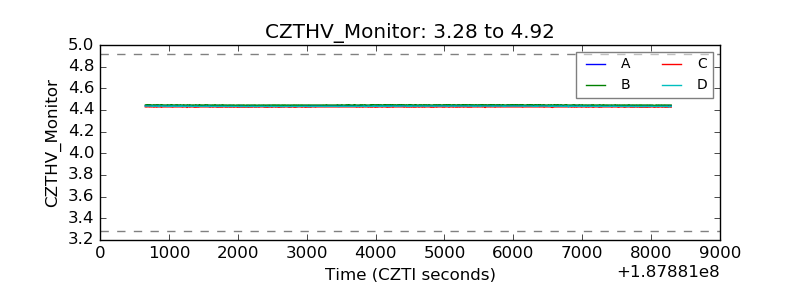 |
| D_VDD | 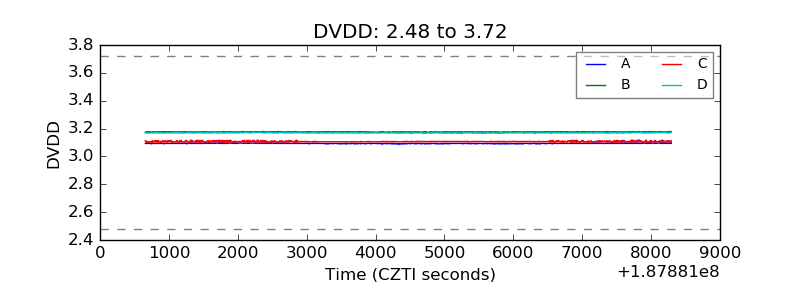 |
| Temperature 1 | 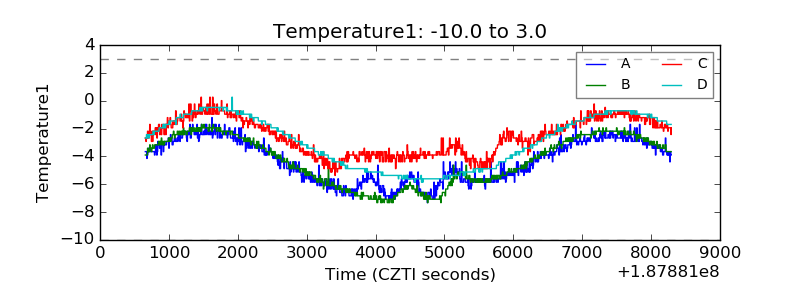 |
| Veto HV Monitor | 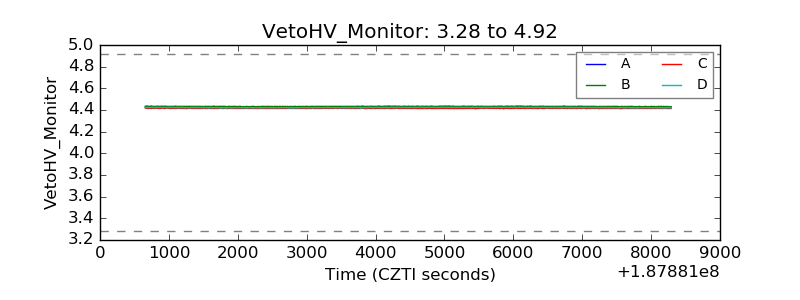 |
| Veto LLD | 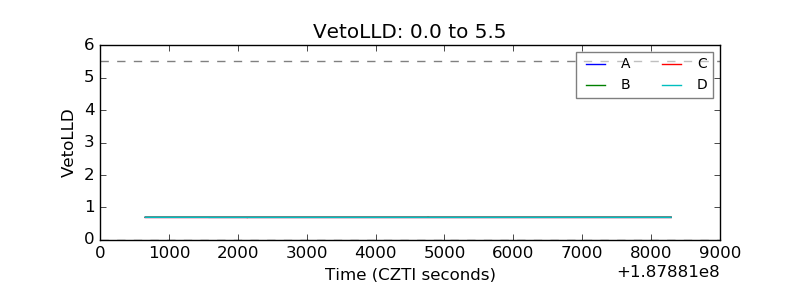 |
| Alpha Counter | 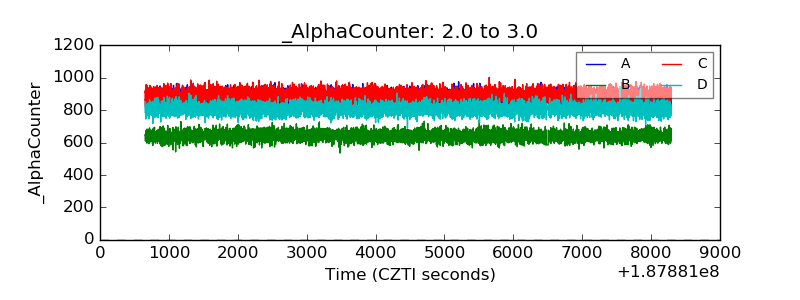 |
| _CPM_Rate | 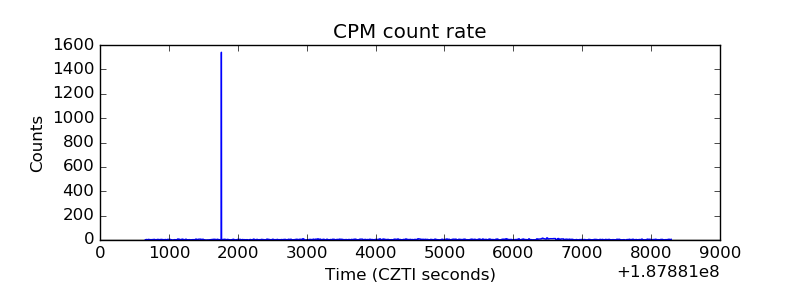 |
| CZT Counter | 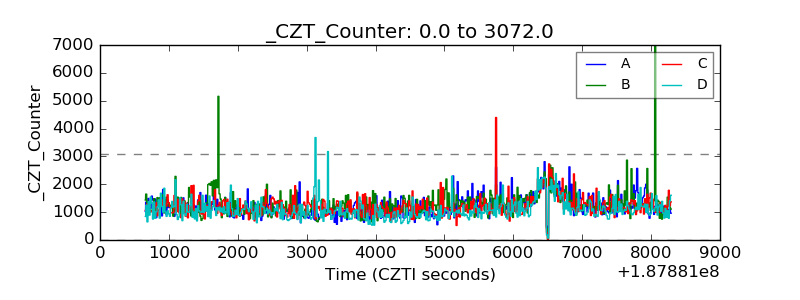 |
| +2.5 Volts monitor | 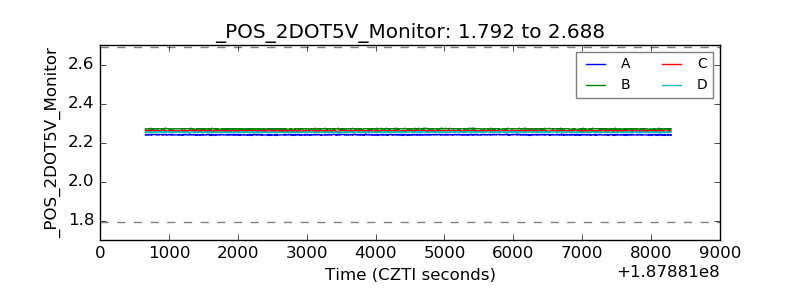 |
| +5 Volts monitor | 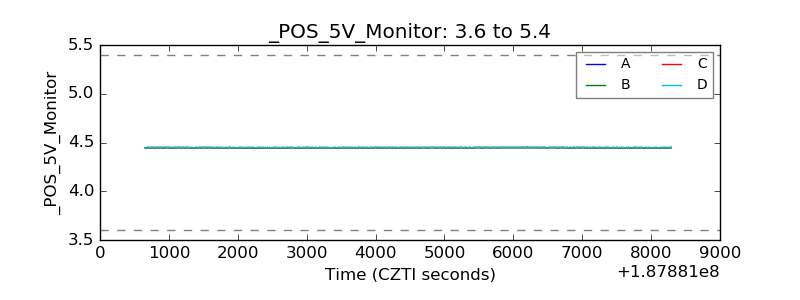 |
| _ROLL_ROT | 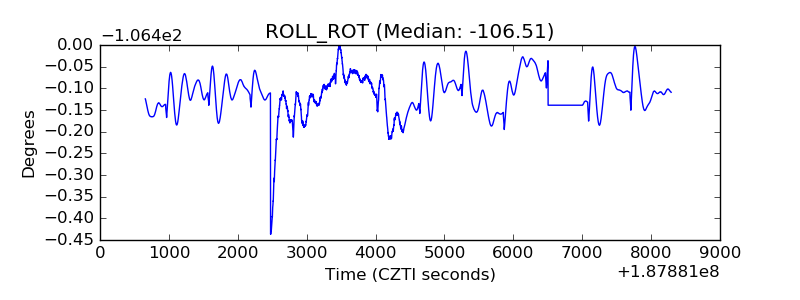 |
| _Roll_DEC | 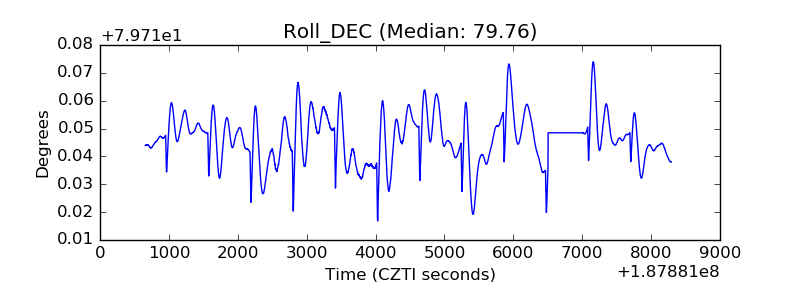 |
| _Roll_RA | 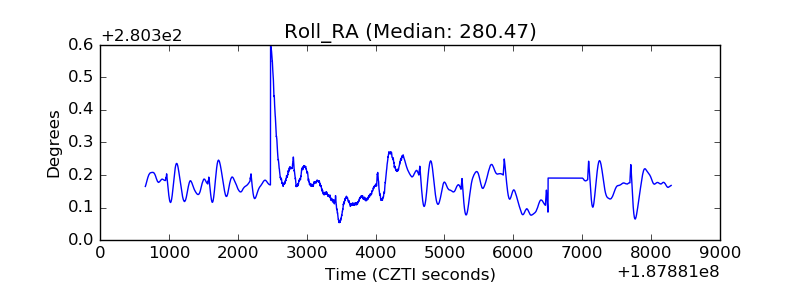 |
| Veto Counter | 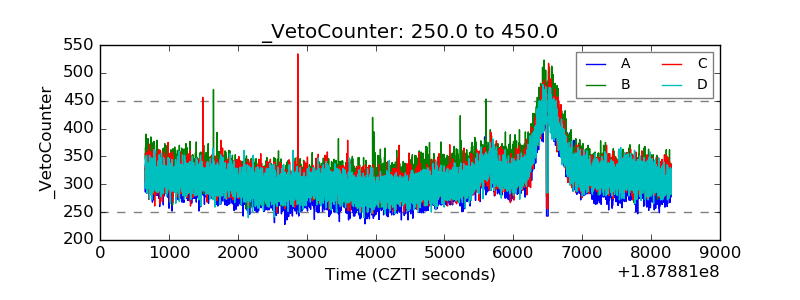 |