| Param | Original file | Final file |
|---|---|---|
| Filename | modeM0/AS1P01_997T03_9000000216_01163cztM0_level2.evt | modeM0/AS1P01_997T03_9000000216_01163cztM0_level2_quad_clean.evt |
| Size (bytes) | 1,183,417,920 | 110,701,440 |
| Size | 1.1 GB | 105.6 MB |
| Events in quadrant A | 8,974,845 | 726,509 |
| Events in quadrant B | 9,224,759 | 722,726 |
| Events in quadrant C | 8,928,998 | 694,536 |
| Events in quadrant D | 8,218,290 | 691,084 |
| Mode M0 | |||
|---|---|---|---|
| Quadrant | BADHDUFLAG | Total packets | Discarded packets |
| A | 0 | 31940 | 3 |
| B | 0 | 32660 | 2 |
| C | 0 | 31816 | 2 |
| D | 0 | 29774 | 2 |
| Mode SS | |||
|---|---|---|---|
| Quadrant | BADHDUFLAG | Total packets | Discarded packets |
| A | 0 | 152 | 0 |
| B | 0 | 152 | 0 |
| C | 0 | 152 | 0 |
| D | 0 | 152 | 0 |
| Mode M9 | |||
|---|---|---|---|
| Quadrant | BADHDUFLAG | Total packets | Discarded packets |
| A | 0 | 1 | 0 |
| B | 0 | 1 | 0 |
| C | 0 | 1 | 0 |
| D | 0 | 1 | 0 |
| Quadrant | Total seconds | Saturated seconds | Saturation percentage |
|---|---|---|---|
| A | 7438 | 11 | 0.147889% |
| B | 7438 | 17 | 0.228556% |
| C | 7438 | 13 | 0.174778% |
| D | 7438 | 22 | 0.295778% |
Noise dominated data is calculated using 1-second bins in cleaned event files. If a bin has >2000 counts, and if more than 50% of those come from <1% of pixels, then it is considered to be noise-dominated and hence unusable.
| Quadrant | # 1 sec bins | Bins with >0 counts | Bins with >2000 counts | High rate bins dominated by noise | Noise dominated (total time) | Noise dominated (detector-on time) | Marked lightcurve |
|---|---|---|---|---|---|---|---|
| A | 7603 | 7440 | 253 | 253 | 3.33% | 3.40% | 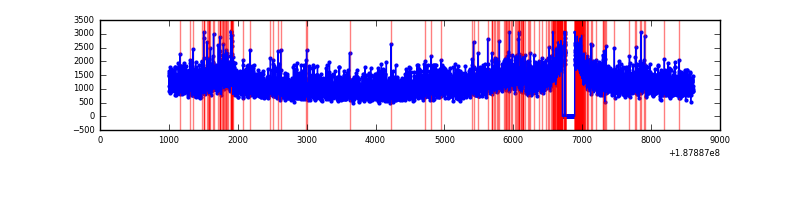 |
| B | 7603 | 7440 | 271 | 271 | 3.56% | 3.64% | 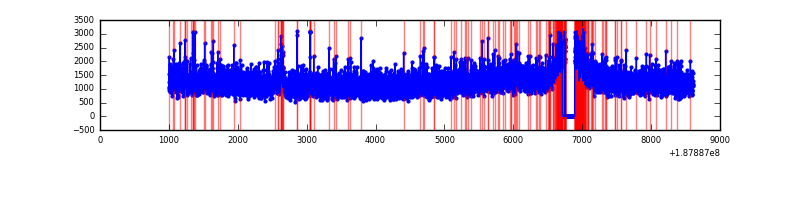 |
| C | 7602 | 7438 | 211 | 211 | 2.78% | 2.84% | 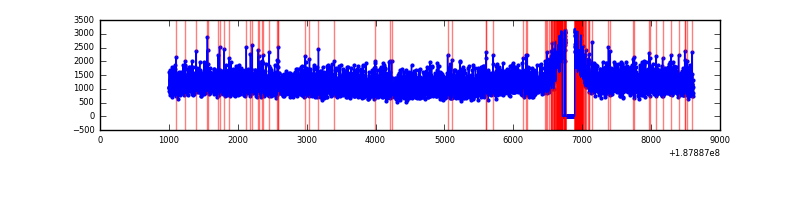 |
| D | 7602 | 7439 | 193 | 193 | 2.54% | 2.59% | 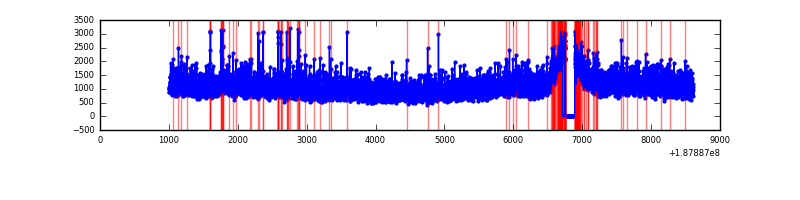 |
Top three noisy pixels from each quadrant. If the there are fewer than three noisy pixels in the level2.evt file, extra rows are filled as -1
| Pixel properties | Quadrant properties | ||||||
|---|---|---|---|---|---|---|---|
| Quadrant | DetID | PixID | Counts | Sigma | Mean | Median | Sigma |
| A | 12 | 243 | 197034 | 353.76 | 2285 | 2299 | 550.5 |
| A | 11 | 79 | 9201 | 12.54 | 2285 | 2299 | 550.5 |
| A | 13 | 9 | 8314 | 10.93 | 2285 | 2299 | 550.5 |
| B | 6 | 53 | 49027 | 83.2 | 2377 | 2386 | 560.6 |
| B | 0 | 191 | 44011 | 74.26 | 2377 | 2386 | 560.6 |
| B | 0 | 230 | 27598 | 44.98 | 2377 | 2386 | 560.6 |
| C | 15 | 241 | 345523 | 565.35 | 2178 | 2255 | 607.2 |
| C | 3 | 111 | 34422 | 52.98 | 2178 | 2255 | 607.2 |
| C | 3 | 79 | 32700 | 50.14 | 2178 | 2255 | 607.2 |
| D | 13 | 73 | 56216 | 81.58 | 2135 | 2211 | 662.0 |
| D | 13 | 252 | 56124 | 81.44 | 2135 | 2211 | 662.0 |
| D | 10 | 125 | 47829 | 68.91 | 2135 | 2211 | 662.0 |
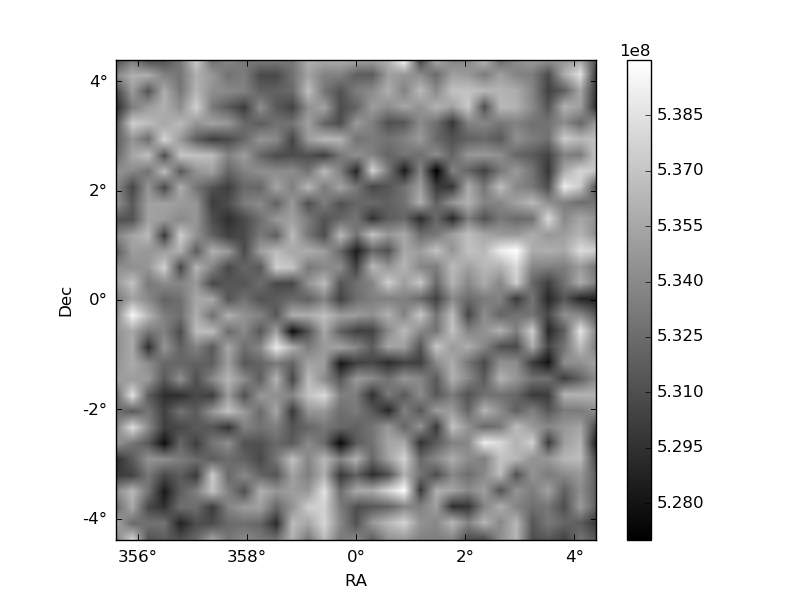
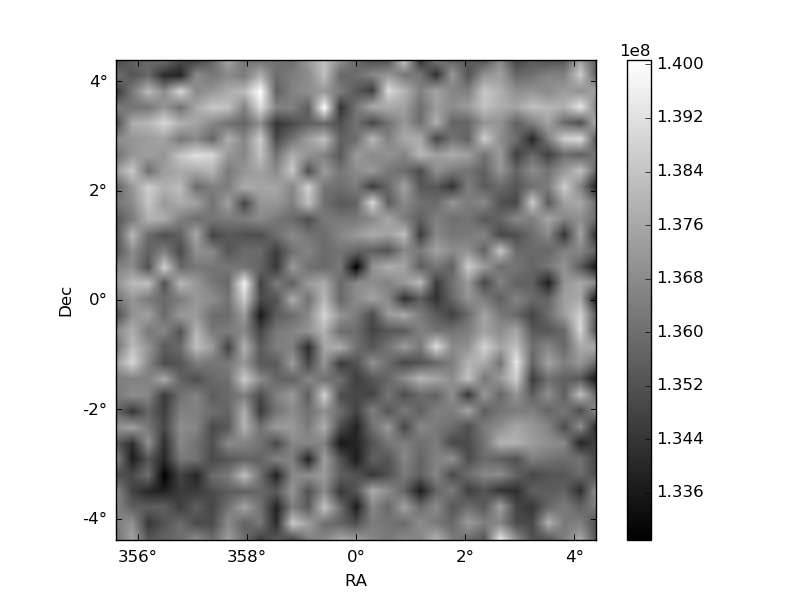
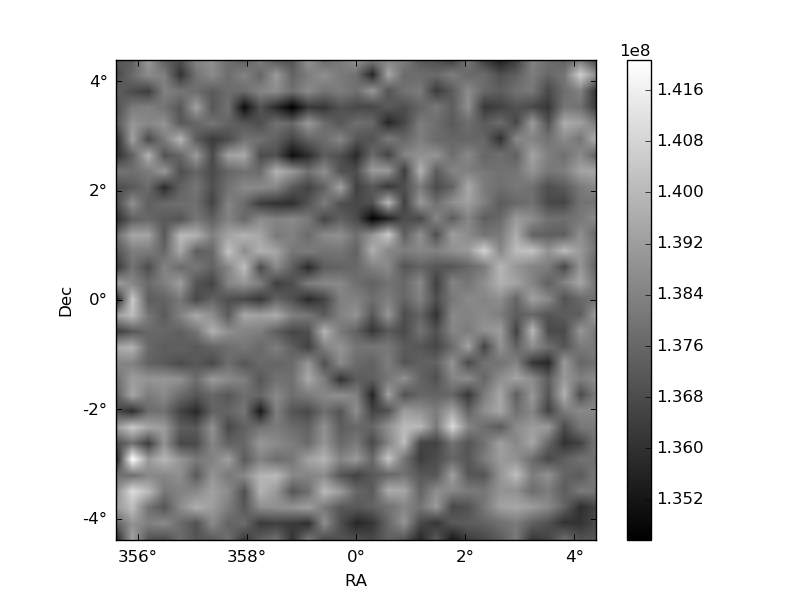
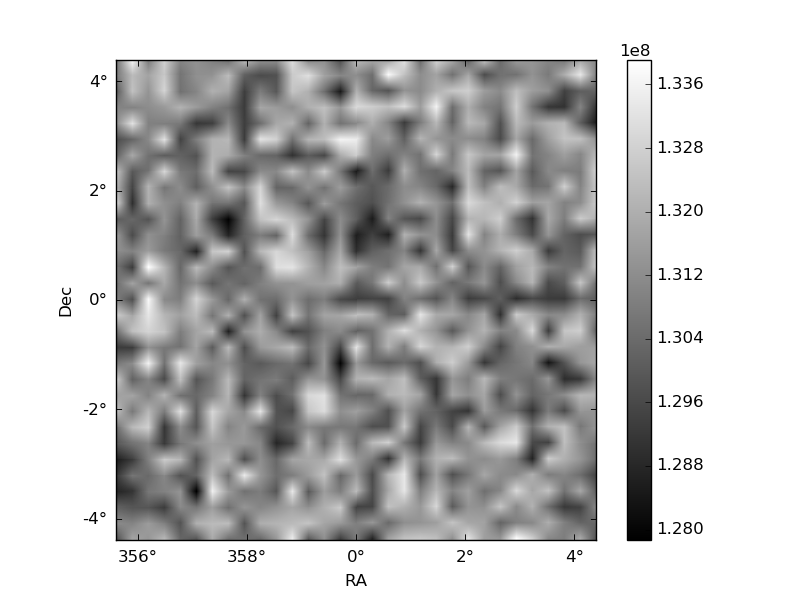
Histogram calculated using DETX and DETY for each event in the final _common_clean file
| Quadrant A | 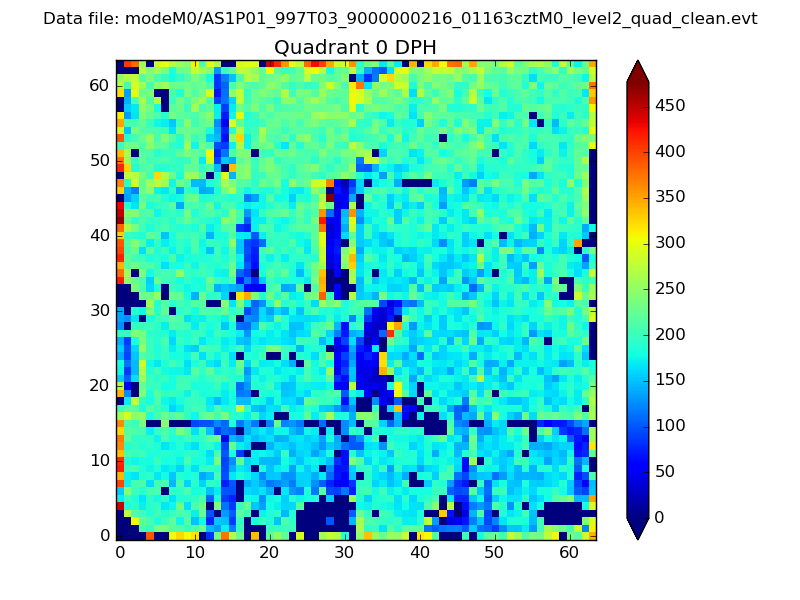 |
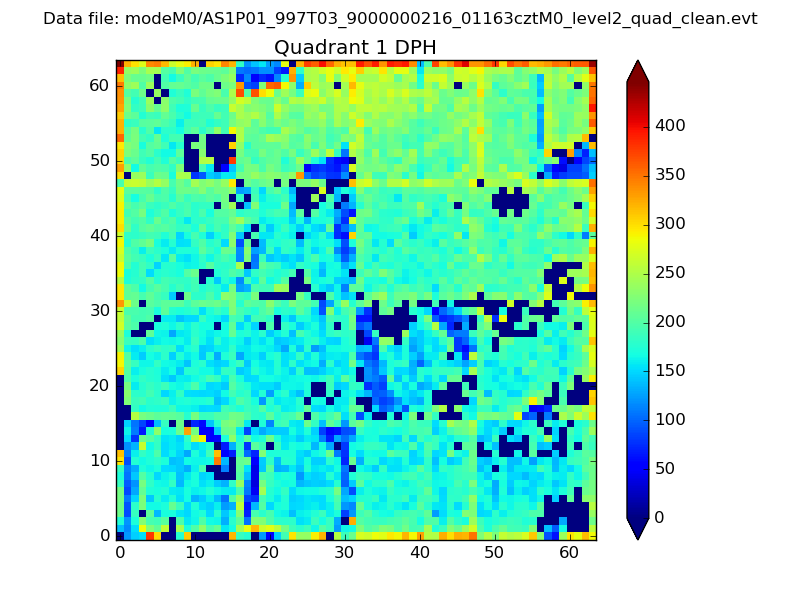 |
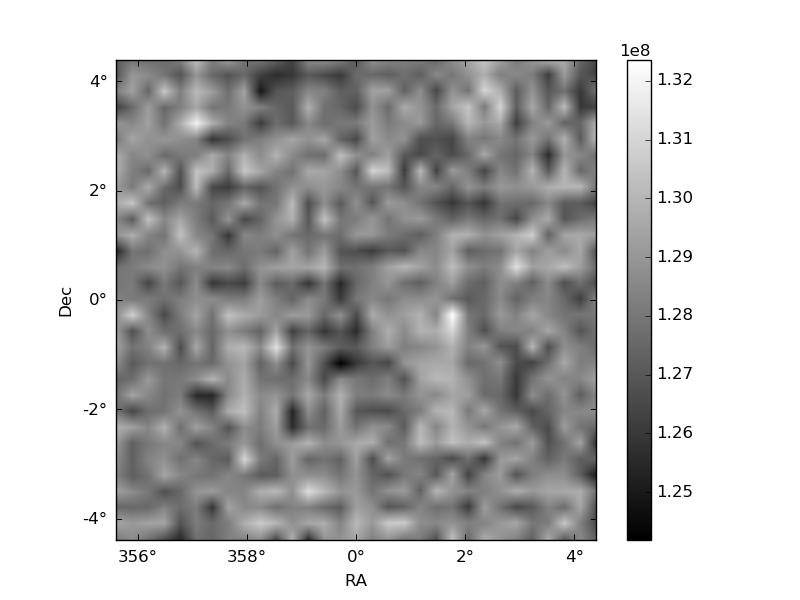
Quadrant B |
|---|---|---|---|
| Quadrant D | 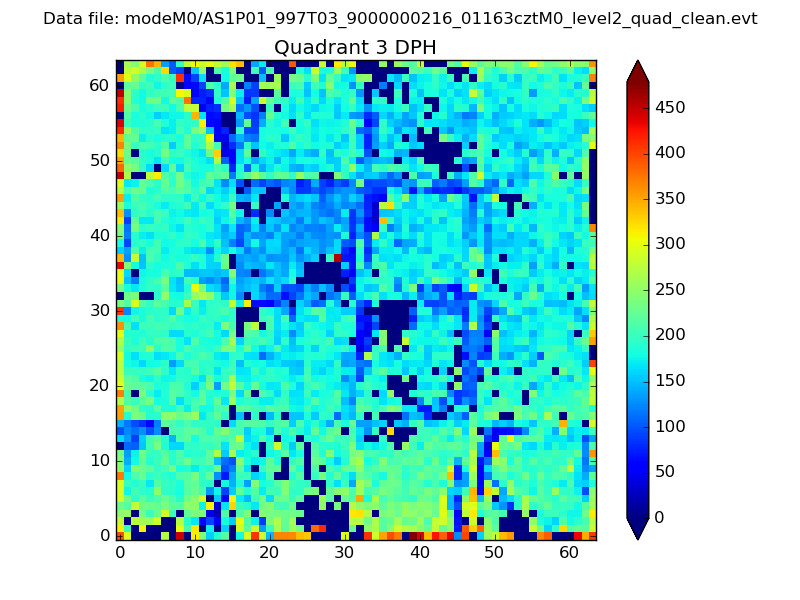 |
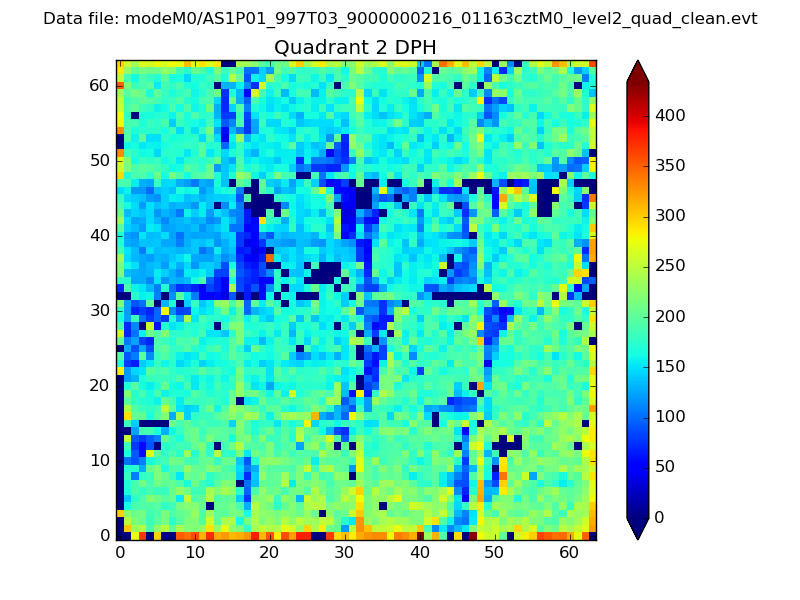 |
Quadrant C |
| Plot type | Count rate plots | Images |
|---|---|---|
| Comparison with Poisson distribution Blue bars denote a histogram of data divided into 1 sec bins. Red curve is a Poisson curve with rate = median count rate of data. |
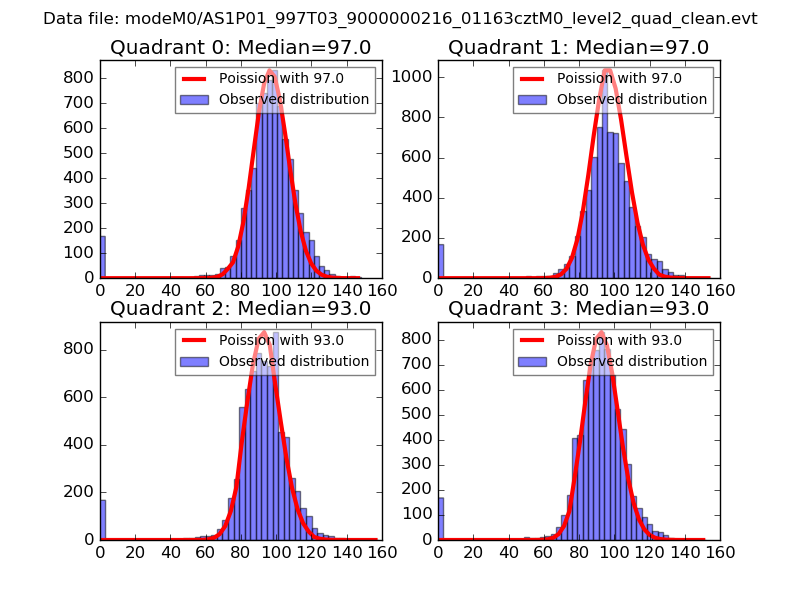 |
 |
| Quadrant-wise count rates Data is divided into 100 sec bins |
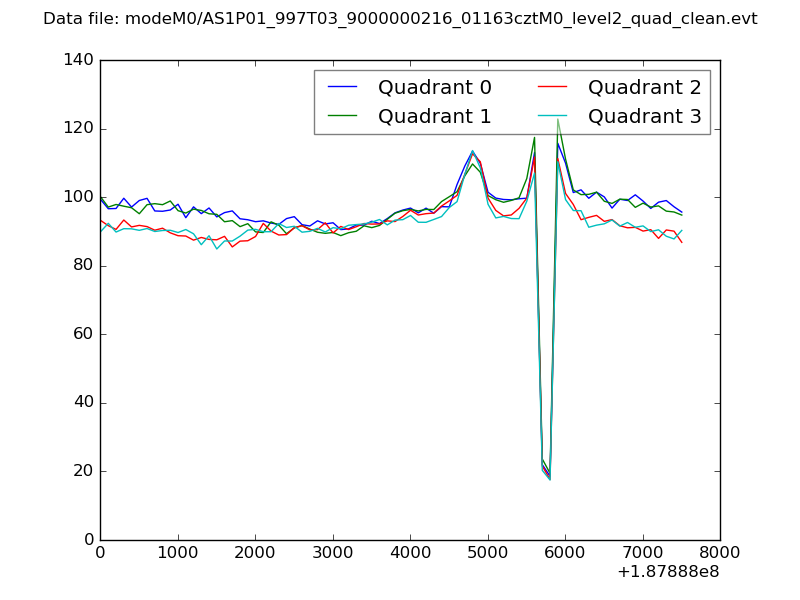 |
|
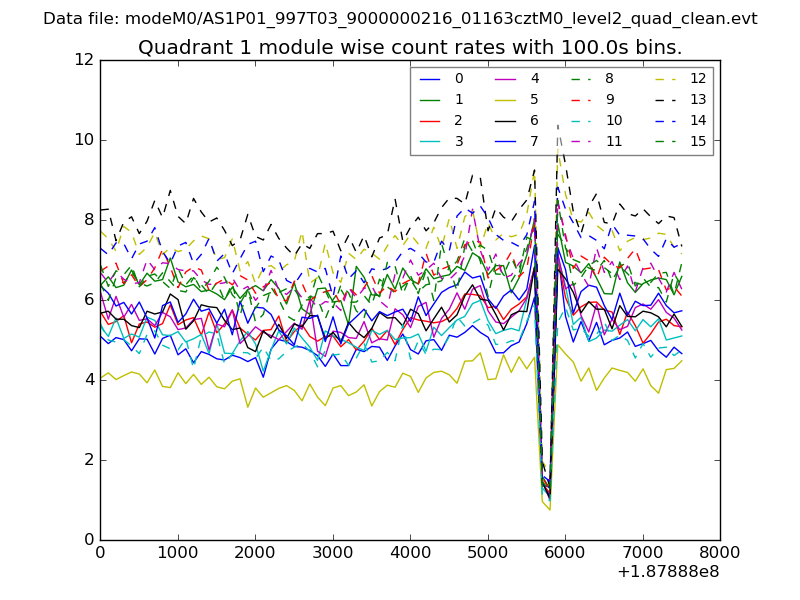
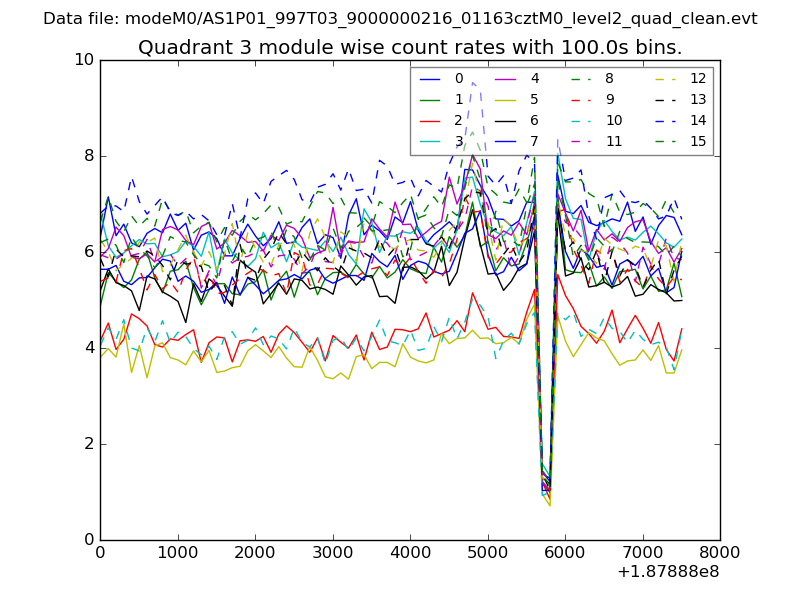
| Module-wise count rates for Quadrant A Data is divided into 100 sec bins |
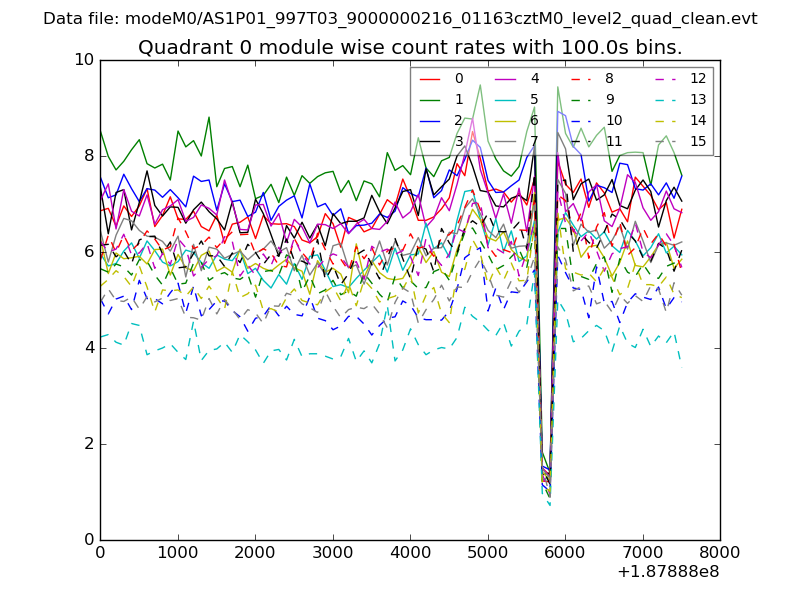 |
 |
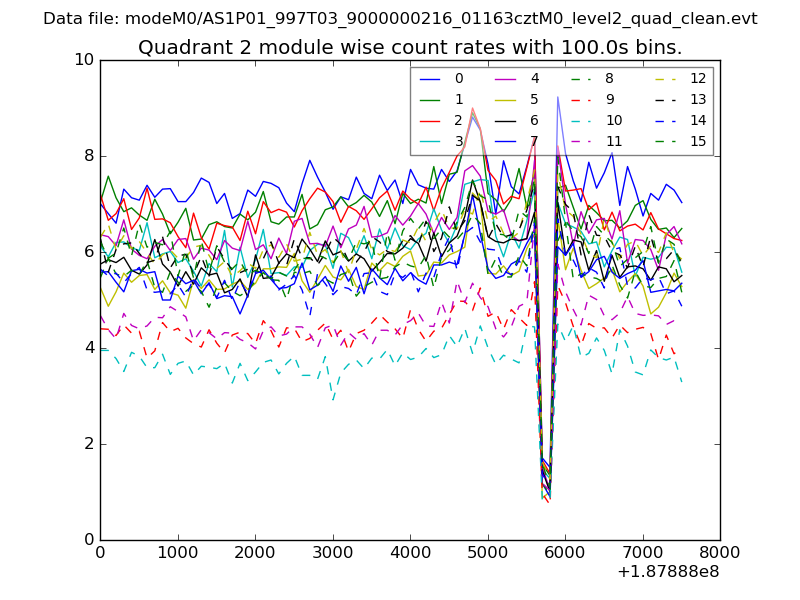
| Module-wise count rates for Quadrant B Data is divided into 100 sec bins |
 |
 |
| Module-wise count rates for Quadrant C Data is divided into 100 sec bins |
 |
 |
| Module-wise count rates for Quadrant D Data is divided into 100 sec bins |
 |
 |
| Parameter | Plot |
|---|---|
| CZT HV Monitor | 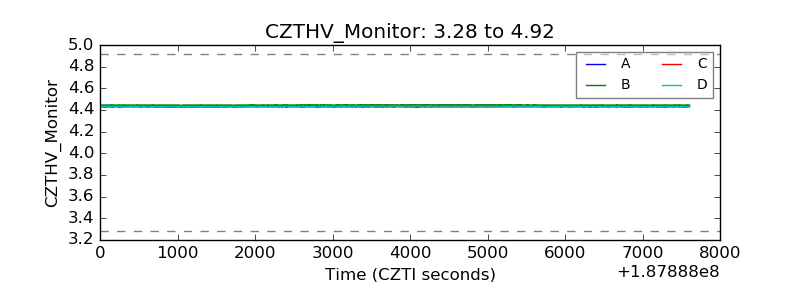 |
| D_VDD | 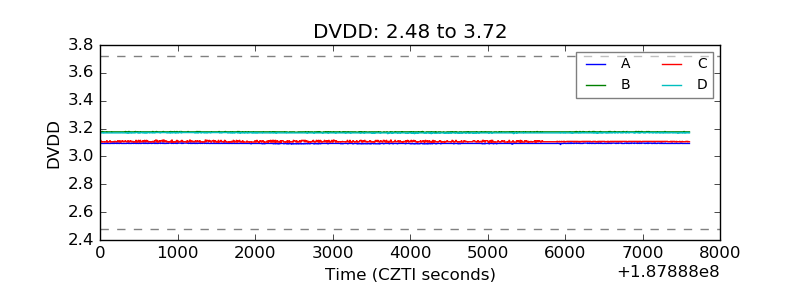 |
| Temperature 1 | 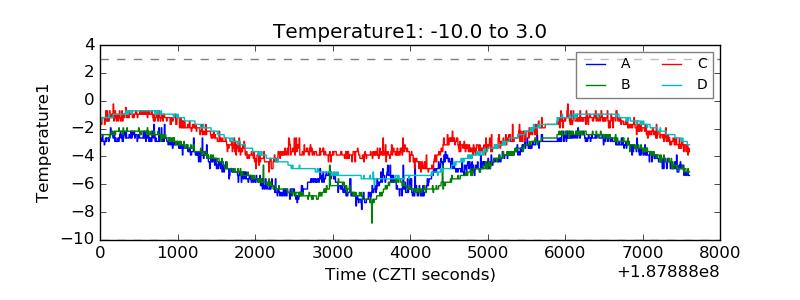 |
| Veto HV Monitor | 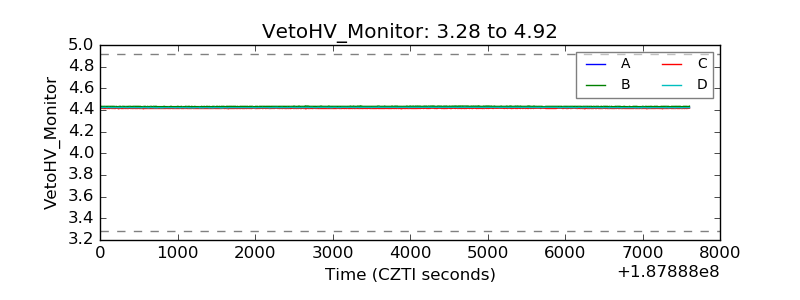 |
| Veto LLD | 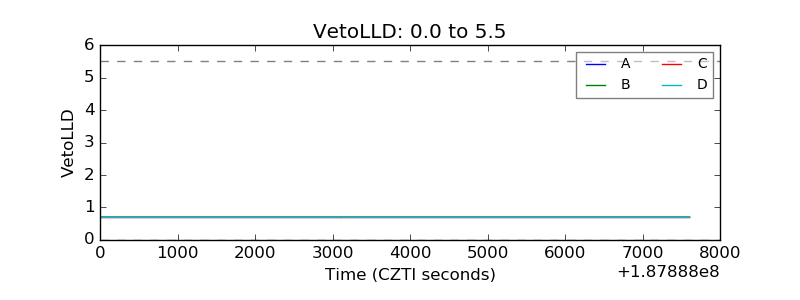 |
| Alpha Counter | 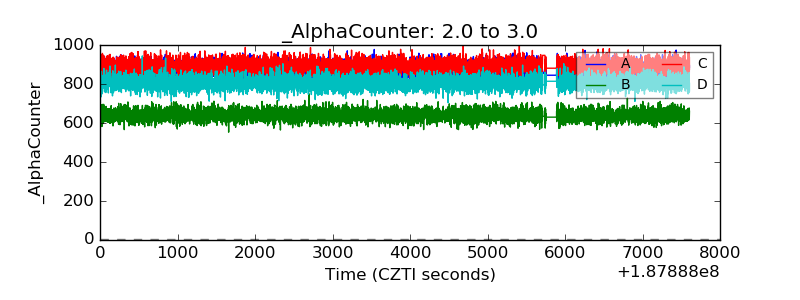 |
| _CPM_Rate | 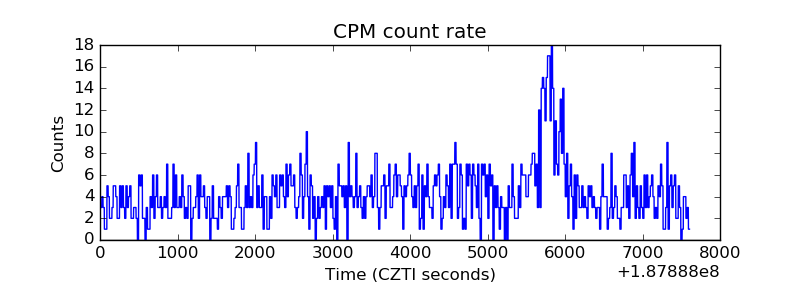 |
| CZT Counter | 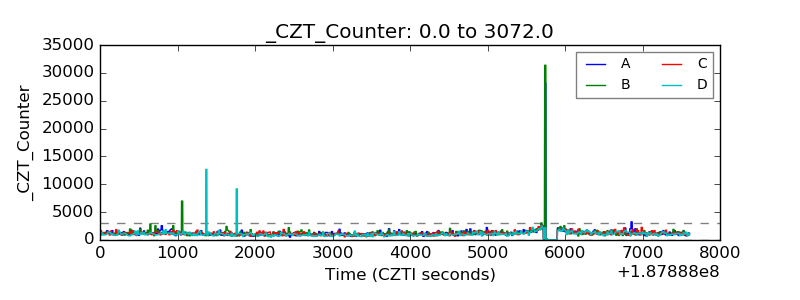 |
| +2.5 Volts monitor | 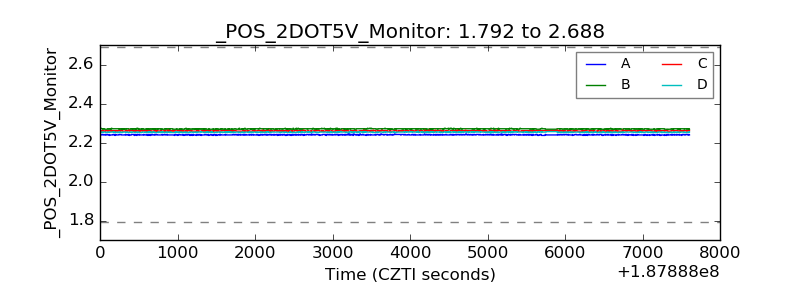 |
| +5 Volts monitor | 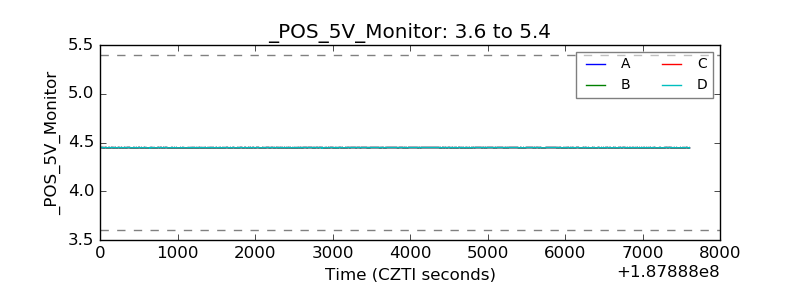 |
| _ROLL_ROT | 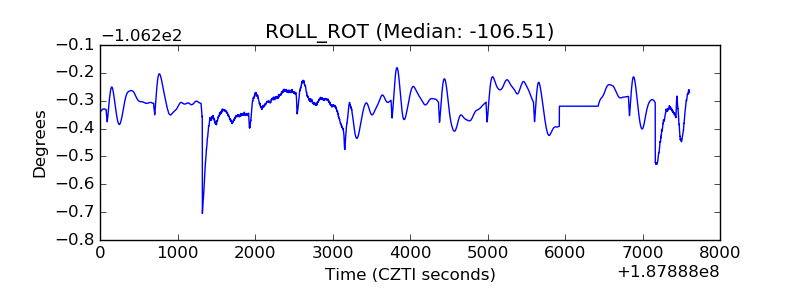 |
| _Roll_DEC | 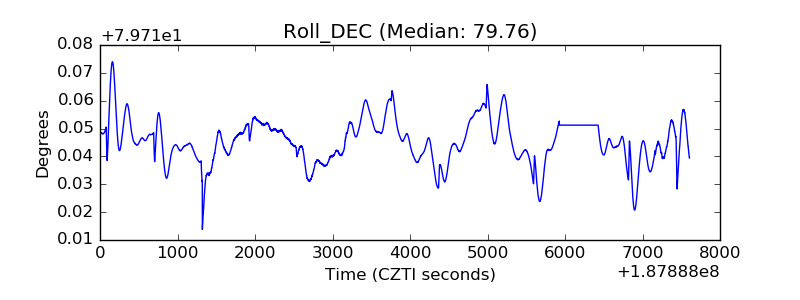 |
| _Roll_RA | 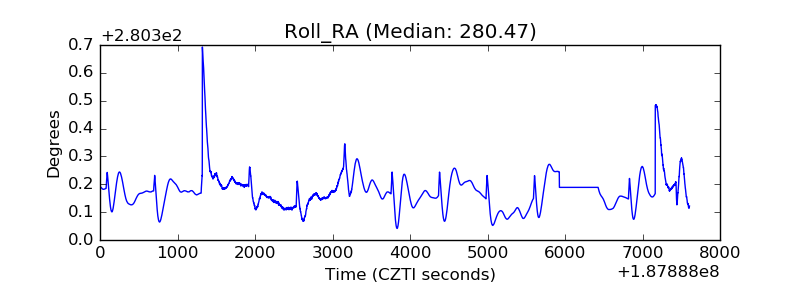 |
| Veto Counter | 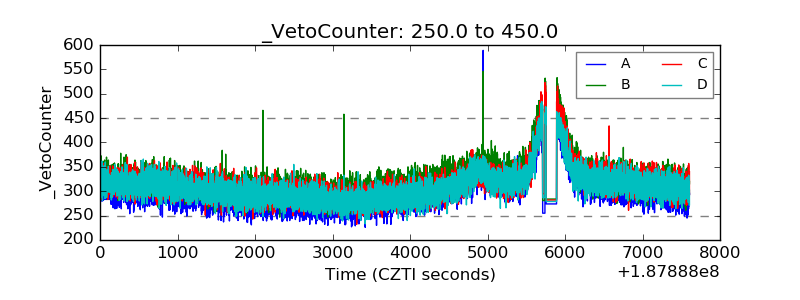 |