| Param | Original file | Final file |
|---|---|---|
| Filename | modeM0/AS1P01_997T03_9000000216_01164cztM0_level2.evt | modeM0/AS1P01_997T03_9000000216_01164cztM0_level2_quad_clean.evt |
| Size (bytes) | 1,219,155,840 | 99,313,920 |
| Size | 1.1 GB | 94.7 MB |
| Events in quadrant A | 8,313,808 | 686,949 |
| Events in quadrant B | 8,707,447 | 676,113 |
| Events in quadrant C | 8,381,879 | 659,145 |
| Events in quadrant D | 11,051,530 | 493,376 |
| Mode M0 | |||
|---|---|---|---|
| Quadrant | BADHDUFLAG | Total packets | Discarded packets |
| A | 0 | 29675 | 2 |
| B | 0 | 30855 | 1 |
| C | 0 | 29908 | 1 |
| D | 0 | 38185 | 1 |
| Mode SS | |||
|---|---|---|---|
| Quadrant | BADHDUFLAG | Total packets | Discarded packets |
| A | 0 | 144 | 0 |
| B | 0 | 144 | 0 |
| C | 0 | 144 | 0 |
| D | 0 | 144 | 0 |
| Mode M9 | |||
|---|---|---|---|
| Quadrant | BADHDUFLAG | Total packets | Discarded packets |
| A | 0 | 4 | 0 |
| B | 0 | 4 | 0 |
| C | 0 | 4 | 0 |
| D | 0 | 4 | 0 |
| Quadrant | Total seconds | Saturated seconds | Saturation percentage |
|---|---|---|---|
| A | 7049 | 9 | 0.127678% |
| B | 7049 | 77 | 1.092354% |
| C | 7049 | 11 | 0.156051% |
| D | 7049 | 1886 | 26.755568% |
Noise dominated data is calculated using 1-second bins in cleaned event files. If a bin has >2000 counts, and if more than 50% of those come from <1% of pixels, then it is considered to be noise-dominated and hence unusable.
| Quadrant | # 1 sec bins | Bins with >0 counts | Bins with >2000 counts | High rate bins dominated by noise | Noise dominated (total time) | Noise dominated (detector-on time) | Marked lightcurve |
|---|---|---|---|---|---|---|---|
| A | 7454 | 7050 | 193 | 193 | 2.59% | 2.74% | 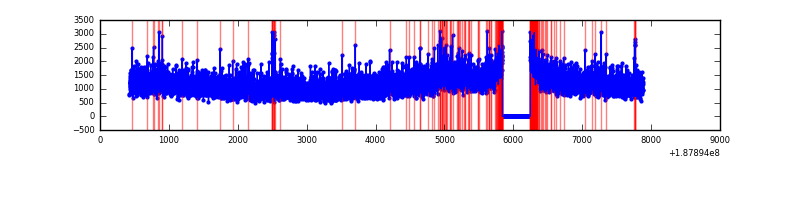 |
| B | 7454 | 7050 | 272 | 272 | 3.65% | 3.86% |  |
| C | 7454 | 7050 | 179 | 179 | 2.40% | 2.54% | 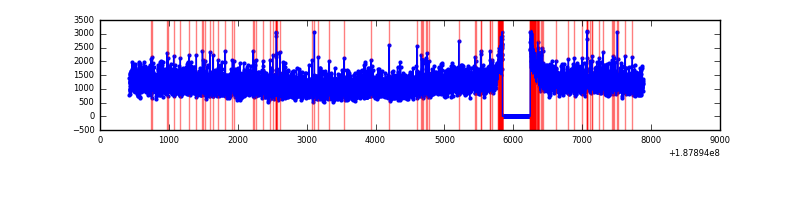 |
| D | 7453 | 7048 | 1918 | 1918 | 25.73% | 27.21% |  |
Top three noisy pixels from each quadrant. If the there are fewer than three noisy pixels in the level2.evt file, extra rows are filled as -1
| Pixel properties | Quadrant properties | ||||||
|---|---|---|---|---|---|---|---|
| Quadrant | DetID | PixID | Counts | Sigma | Mean | Median | Sigma |
| A | 12 | 243 | 94433 | 178.8 | 2141 | 2154 | 516.1 |
| A | 11 | 79 | 7780 | 10.9 | 2141 | 2154 | 516.1 |
| A | 3 | 111 | 6973 | 9.34 | 2141 | 2154 | 516.1 |
| B | 0 | 49 | 205587 | 390.01 | 2212 | 2221 | 521.4 |
| B | 15 | 22 | 33010 | 59.04 | 2212 | 2221 | 521.4 |
| B | 14 | 53 | 16865 | 28.08 | 2212 | 2221 | 521.4 |
| C | 15 | 241 | 301199 | 522.67 | 2053 | 2129 | 572.2 |
| C | 3 | 111 | 27482 | 44.31 | 2053 | 2129 | 572.2 |
| C | 3 | 79 | 22605 | 35.78 | 2053 | 2129 | 572.2 |
| D | 1 | 239 | 5324771 | 11513.72 | 1497 | 1552 | 462.3 |
| D | 2 | 16 | 32356 | 66.63 | 1497 | 1552 | 462.3 |
| D | 13 | 73 | 26013 | 52.91 | 1497 | 1552 | 462.3 |
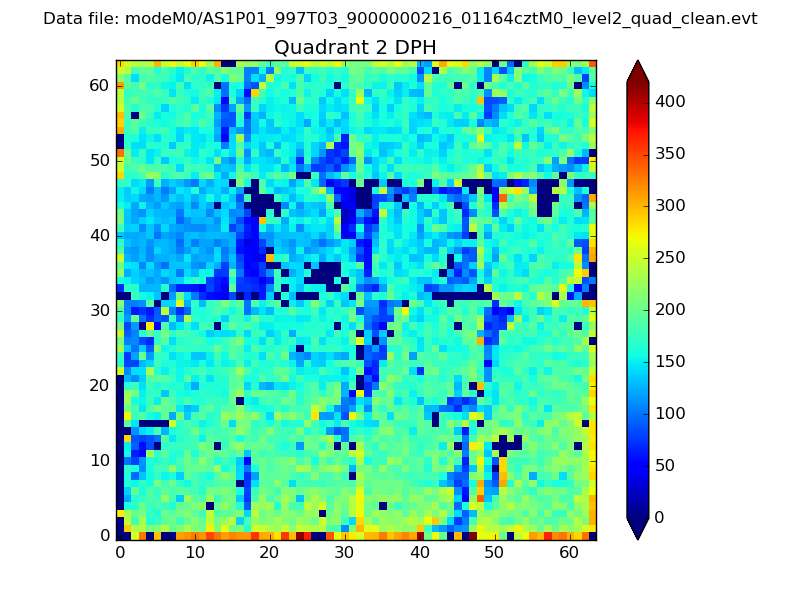
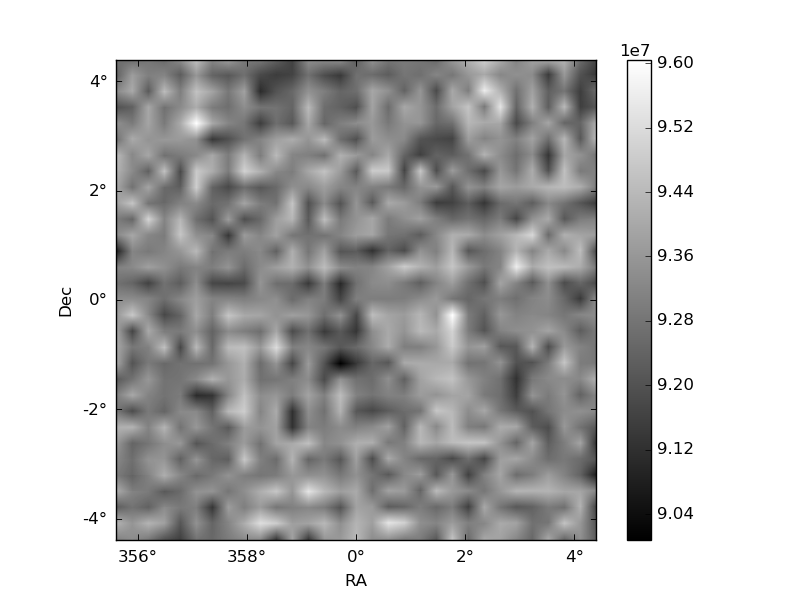
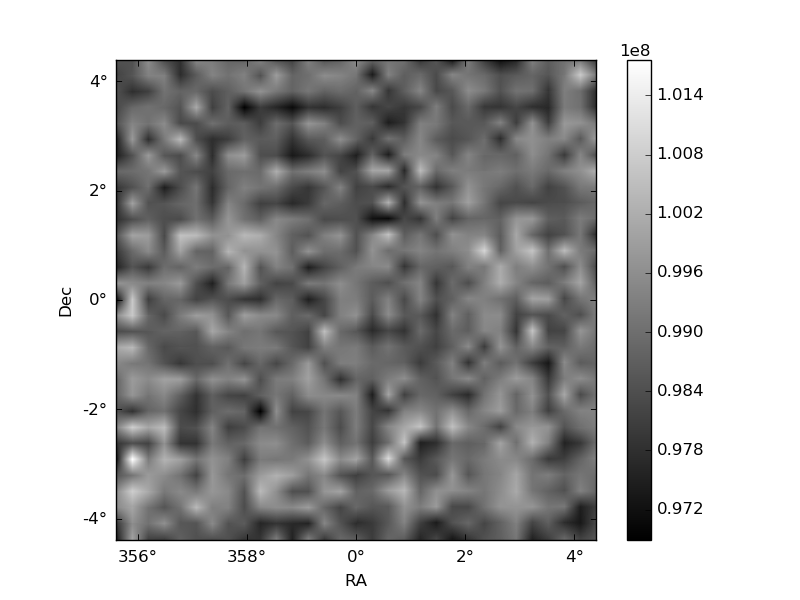
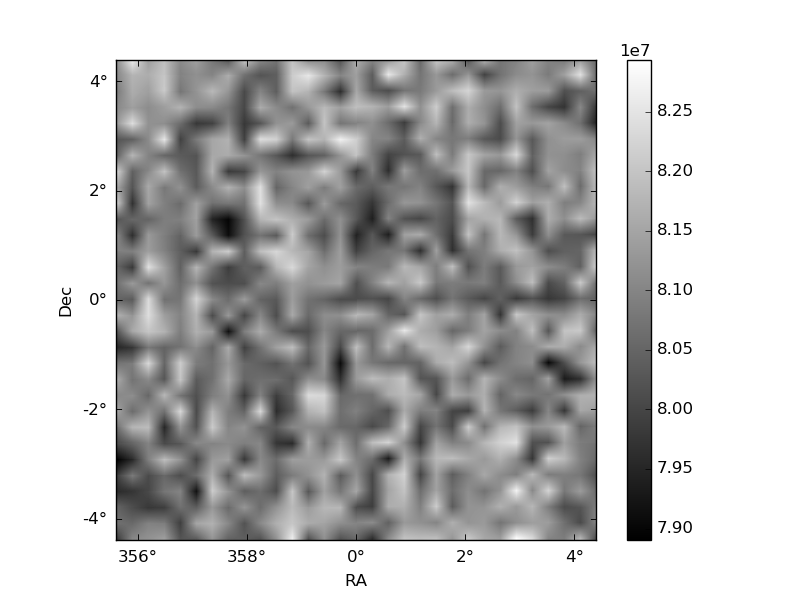
Histogram calculated using DETX and DETY for each event in the final _common_clean file
| Quadrant A | 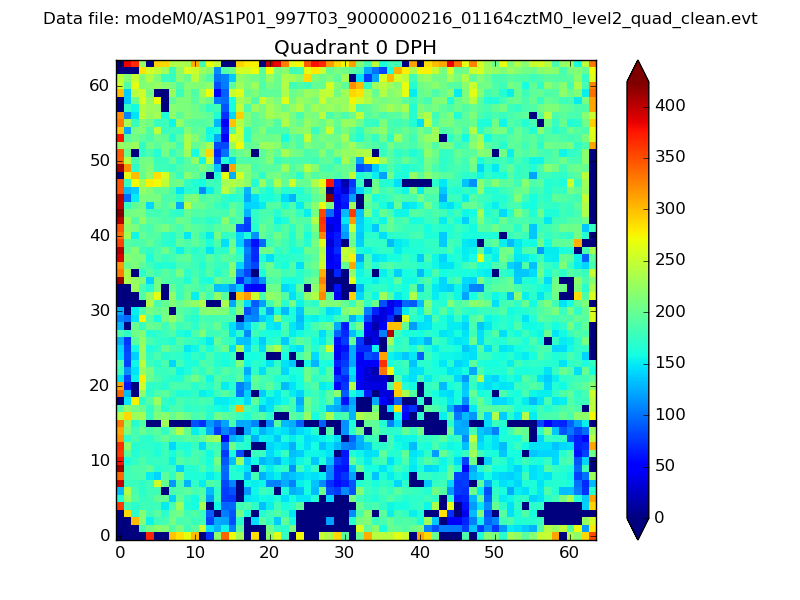 |
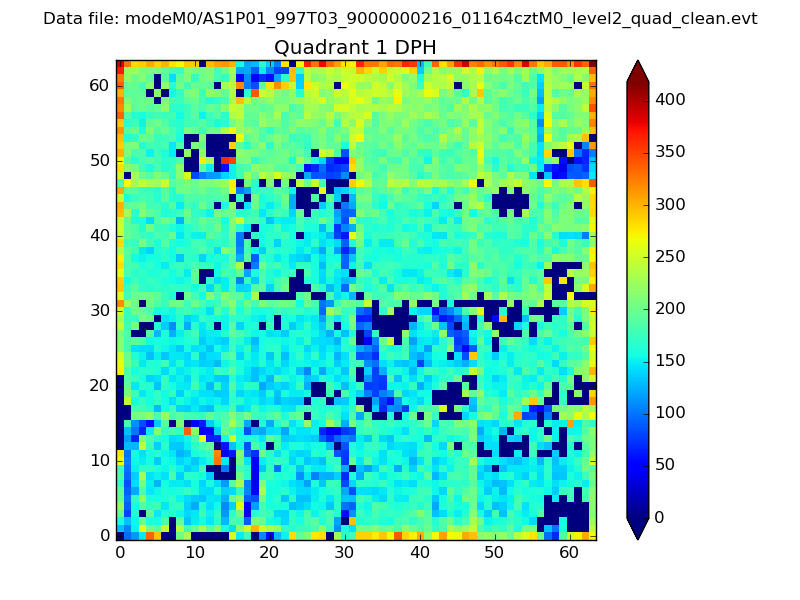 |
Quadrant B |
|---|---|---|---|
| Quadrant D | 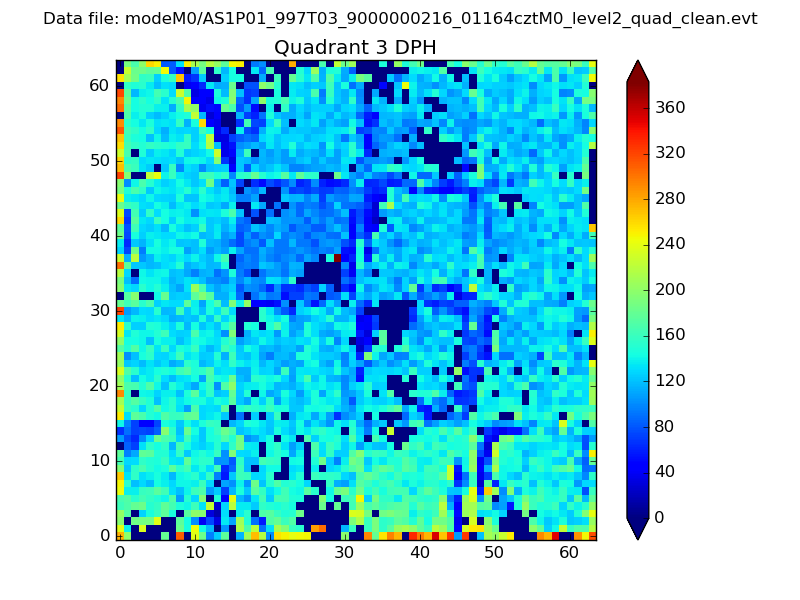 |
 |
Quadrant C |
| Plot type | Count rate plots | Images |
|---|---|---|
| Comparison with Poisson distribution Blue bars denote a histogram of data divided into 1 sec bins. Red curve is a Poisson curve with rate = median count rate of data. |
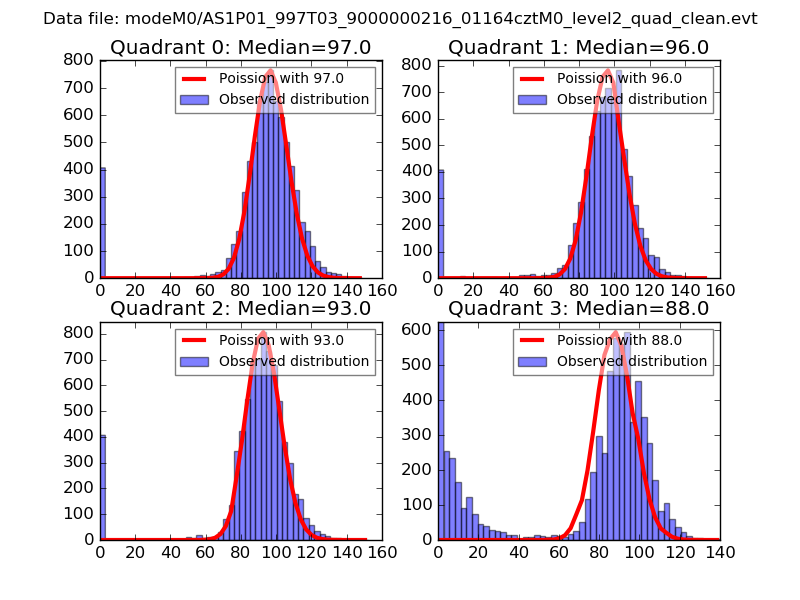 |
 |
| Quadrant-wise count rates Data is divided into 100 sec bins |
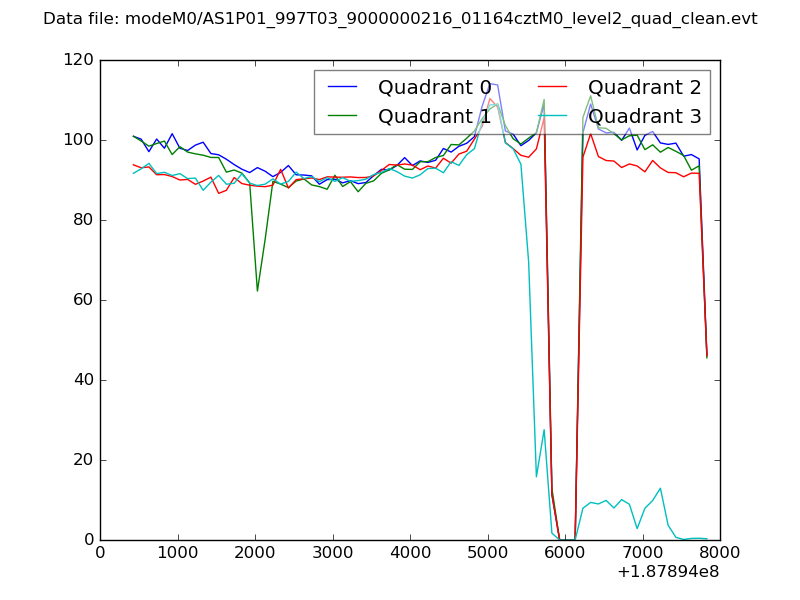 |
|
| Module-wise count rates for Quadrant A Data is divided into 100 sec bins |
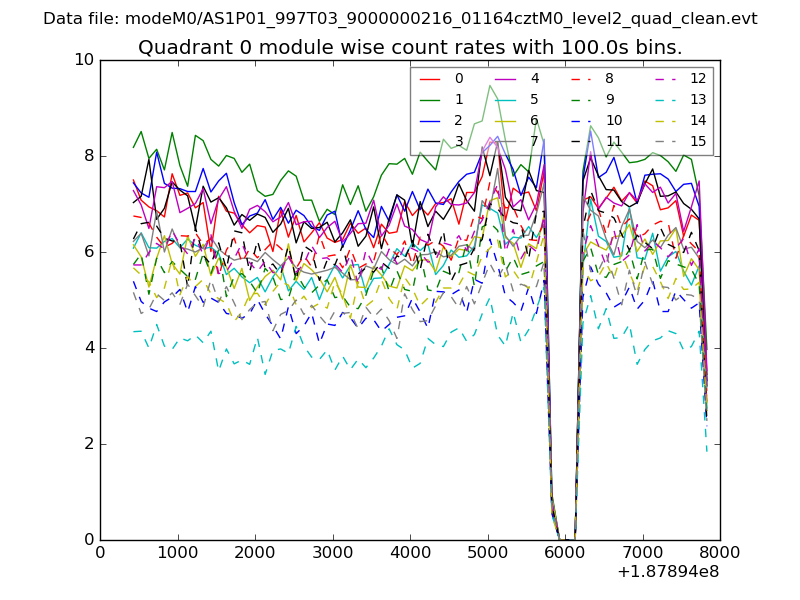 |
 |
| Module-wise count rates for Quadrant B Data is divided into 100 sec bins |
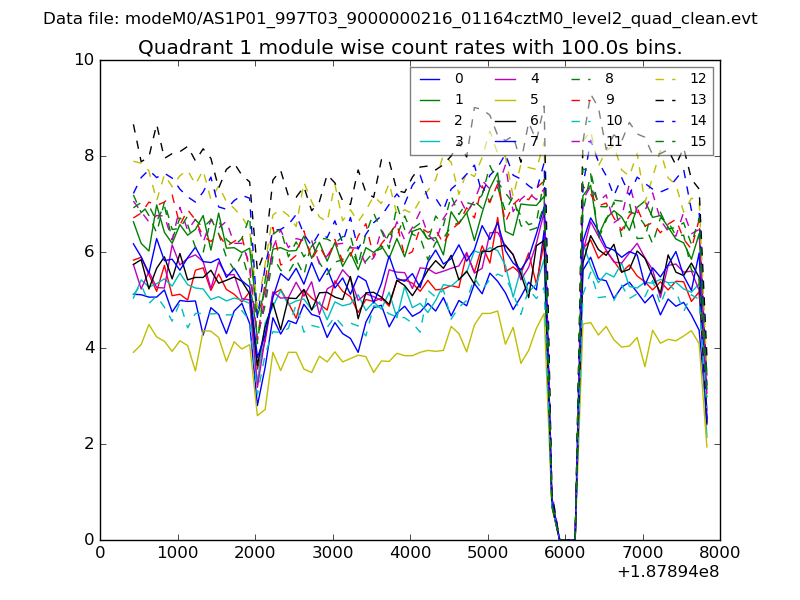 |
 |
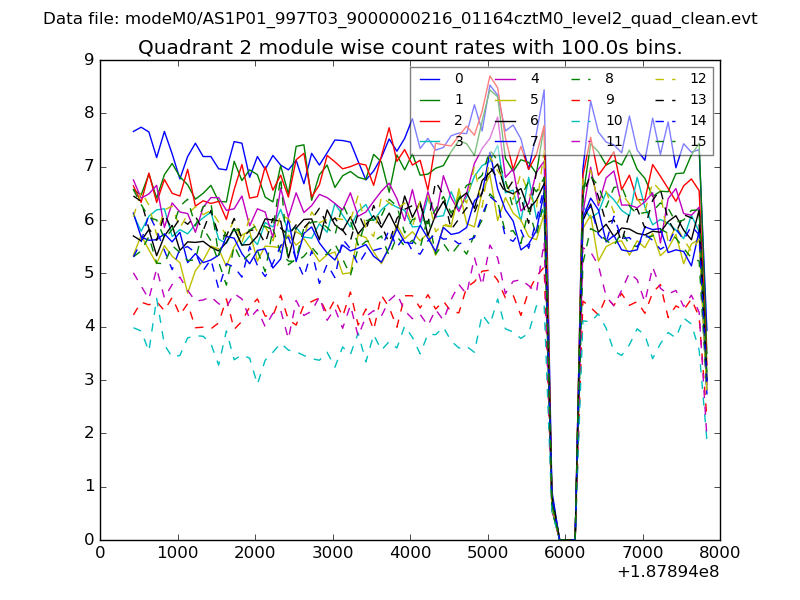
| Module-wise count rates for Quadrant C Data is divided into 100 sec bins |
 |
 |
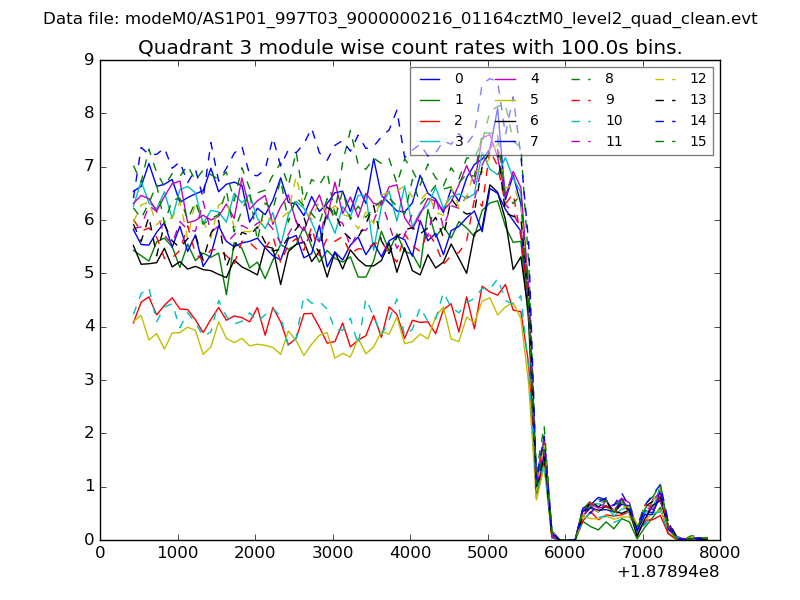
| Module-wise count rates for Quadrant D Data is divided into 100 sec bins |
 |
 |
| Parameter | Plot |
|---|---|
| CZT HV Monitor | 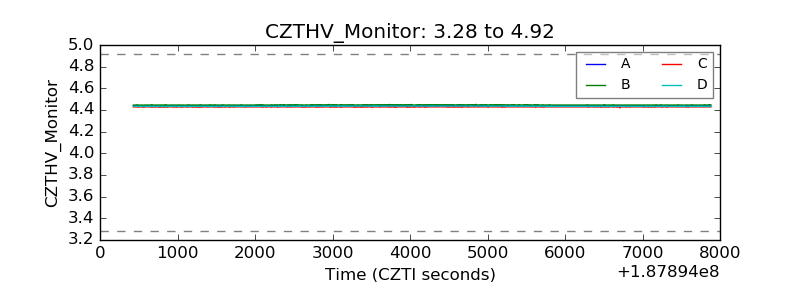 |
| D_VDD | 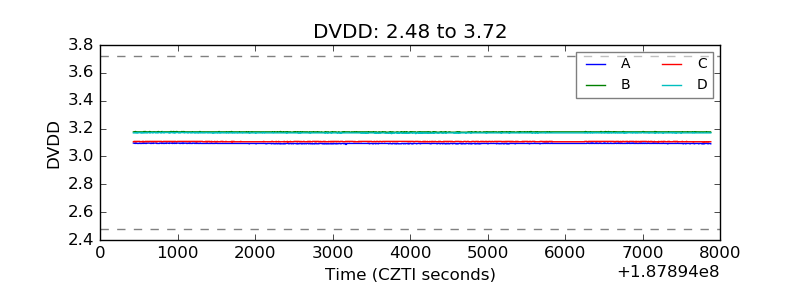 |
| Temperature 1 | 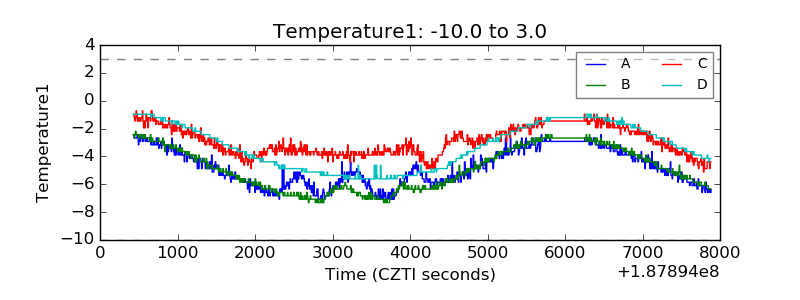 |
| Veto HV Monitor | 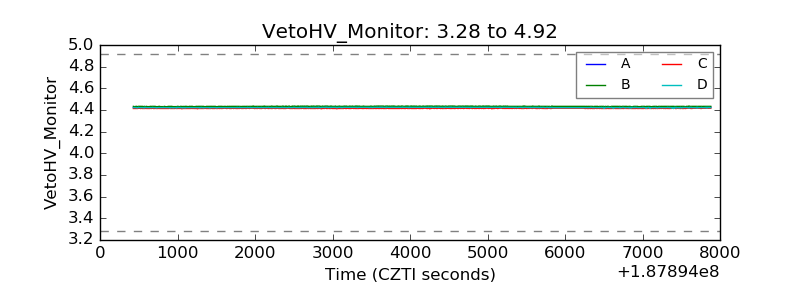 |
| Veto LLD | 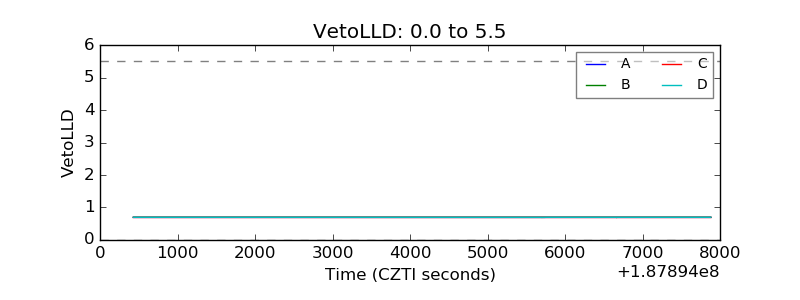 |
| Alpha Counter | 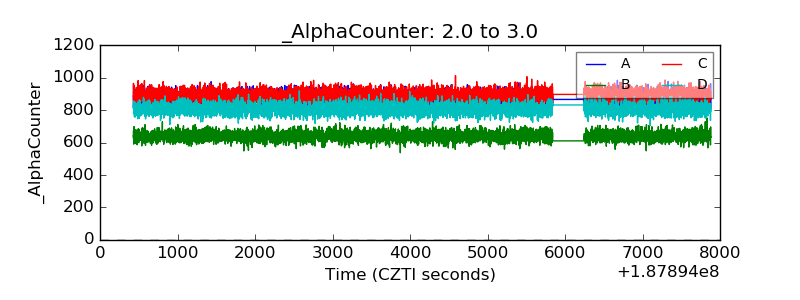 |
| _CPM_Rate | 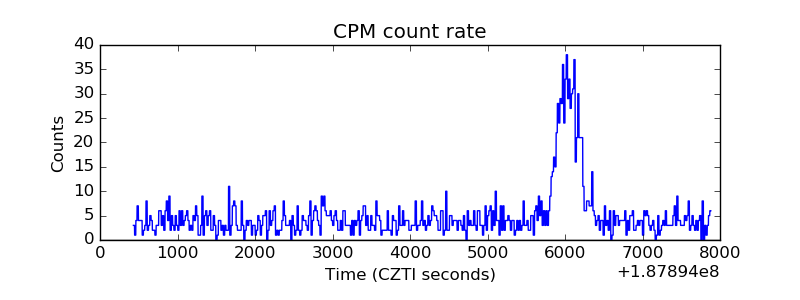 |
| CZT Counter | 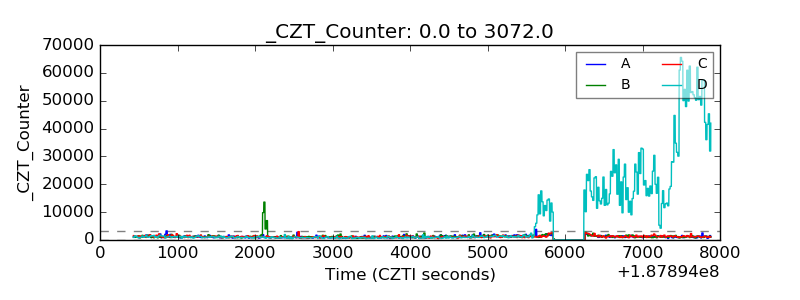 |
| +2.5 Volts monitor |  |
| +5 Volts monitor |  |
| _ROLL_ROT | 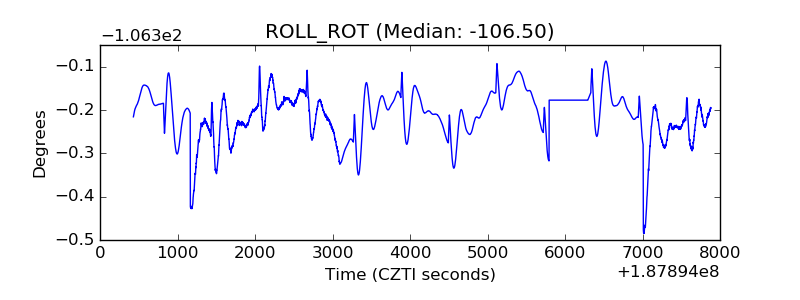 |
| _Roll_DEC | 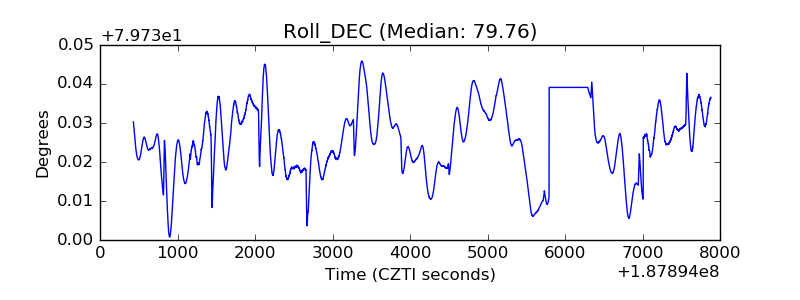 |
| _Roll_RA | 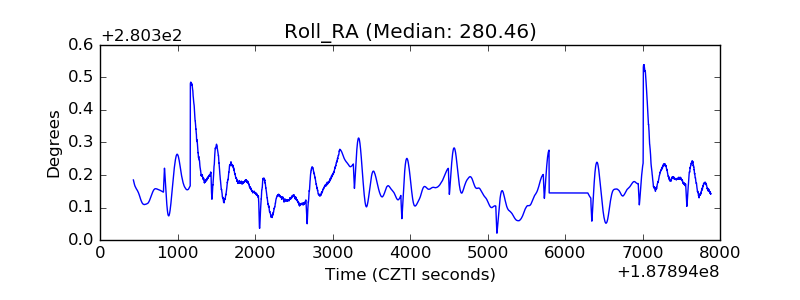 |
| Veto Counter | 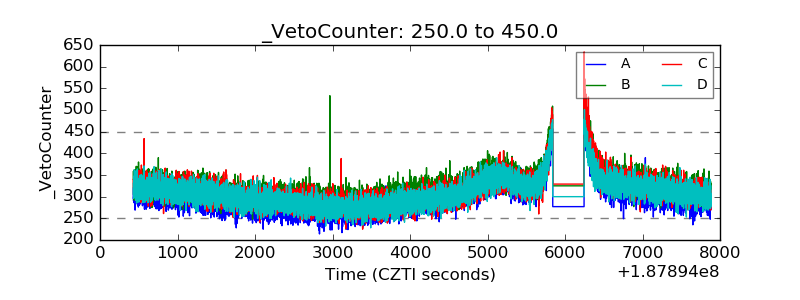 |