| Param | Original file | Final file |
|---|---|---|
| Filename | modeM0/AS1P01_997T03_9000000216_01166cztM0_level2.evt | modeM0/AS1P01_997T03_9000000216_01166cztM0_level2_quad_clean.evt |
| Size (bytes) | 1,421,568,000 | 75,856,320 |
| Size | 1.3 GB | 72.3 MB |
| Events in quadrant A | 7,326,927 | 618,343 |
| Events in quadrant B | 8,653,484 | 596,480 |
| Events in quadrant C | 7,530,383 | 600,050 |
| Events in quadrant D | 19,123,200 | 37,410 |
| Mode M0 | |||
|---|---|---|---|
| Quadrant | BADHDUFLAG | Total packets | Discarded packets |
| A | 0 | 27469 | 1180 |
| B | 0 | 31501 | 1270 |
| C | 0 | 28130 | 1227 |
| D | 0 | 66584 | 4334 |
| Mode SS | |||
|---|---|---|---|
| Quadrant | BADHDUFLAG | Total packets | Discarded packets |
| A | 0 | 136 | 8 |
| B | 0 | 136 | 4 |
| C | 0 | 136 | 4 |
| D | 0 | 136 | 4 |
| Mode M9 | |||
|---|---|---|---|
| Quadrant | BADHDUFLAG | Total packets | Discarded packets |
| A | 0 | 8 | 0 |
| B | 0 | 8 | 0 |
| C | 0 | 8 | 0 |
| D | 0 | 8 | 0 |
| Quadrant | Total seconds | Saturated seconds | Saturation percentage |
|---|---|---|---|
| A | 6357 | 2 | 0.031461% |
| B | 6347 | 332 | 5.230818% |
| C | 6344 | 9 | 0.141866% |
| D | 6225 | 6225 | 100.000000% |
Noise dominated data is calculated using 1-second bins in cleaned event files. If a bin has >2000 counts, and if more than 50% of those come from <1% of pixels, then it is considered to be noise-dominated and hence unusable.
| Quadrant | # 1 sec bins | Bins with >0 counts | Bins with >2000 counts | High rate bins dominated by noise | Noise dominated (total time) | Noise dominated (detector-on time) | Marked lightcurve |
|---|---|---|---|---|---|---|---|
| A | 7459 | 6415 | 132 | 132 | 1.77% | 2.06% | 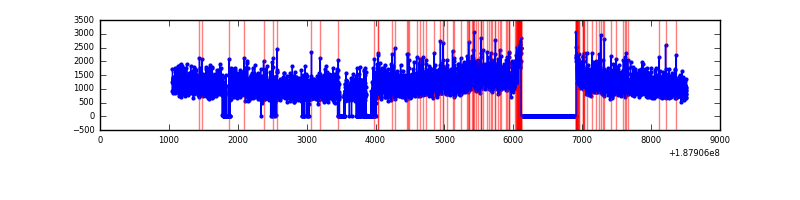 |
| B | 7459 | 6420 | 689 | 689 | 9.24% | 10.73% | 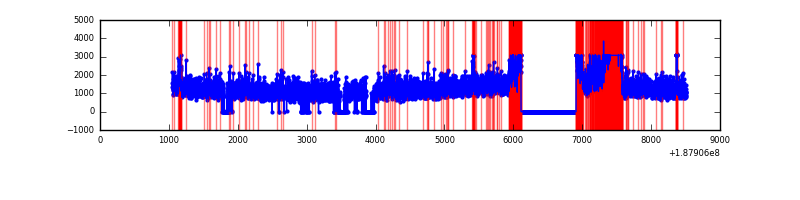 |
| C | 7459 | 6434 | 131 | 131 | 1.76% | 2.04% | 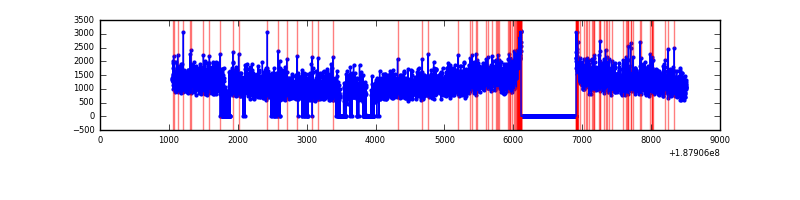 |
| D | 7458 | 6225 | 6224 | 6224 | 83.45% | 99.98% | 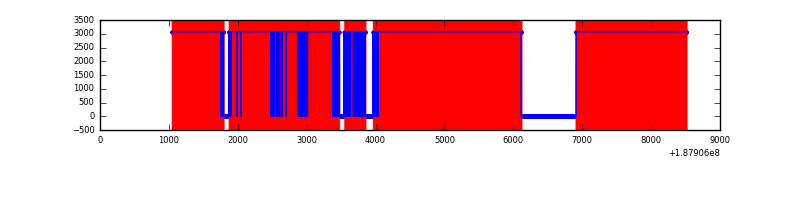 |
Top three noisy pixels from each quadrant. If the there are fewer than three noisy pixels in the level2.evt file, extra rows are filled as -1
| Pixel properties | Quadrant properties | ||||||
|---|---|---|---|---|---|---|---|
| Quadrant | DetID | PixID | Counts | Sigma | Mean | Median | Sigma |
| A | 12 | 243 | 9142 | 15.7 | 1906 | 1920 | 460.0 |
| A | 11 | 79 | 8355 | 13.99 | 1906 | 1920 | 460.0 |
| A | 3 | 111 | 6347 | 9.62 | 1906 | 1920 | 460.0 |
| B | 2 | 32 | 958113 | 2043.4 | 1965 | 1974 | 467.9 |
| B | 6 | 53 | 148299 | 312.72 | 1965 | 1974 | 467.9 |
| B | 15 | 22 | 38140 | 77.29 | 1965 | 1974 | 467.9 |
| C | 15 | 241 | 303753 | 585.63 | 1836 | 1901 | 515.4 |
| C | 3 | 111 | 21985 | 38.97 | 1836 | 1901 | 515.4 |
| C | 3 | 79 | 15007 | 25.43 | 1836 | 1901 | 515.4 |
| D | 1 | 239 | 18180825 | 233979.79 | 246 | 252 | 77.7 |
| D | 10 | 125 | 13642 | 172.33 | 246 | 252 | 77.7 |
| D | 2 | 170 | 1498 | 16.04 | 246 | 252 | 77.7 |
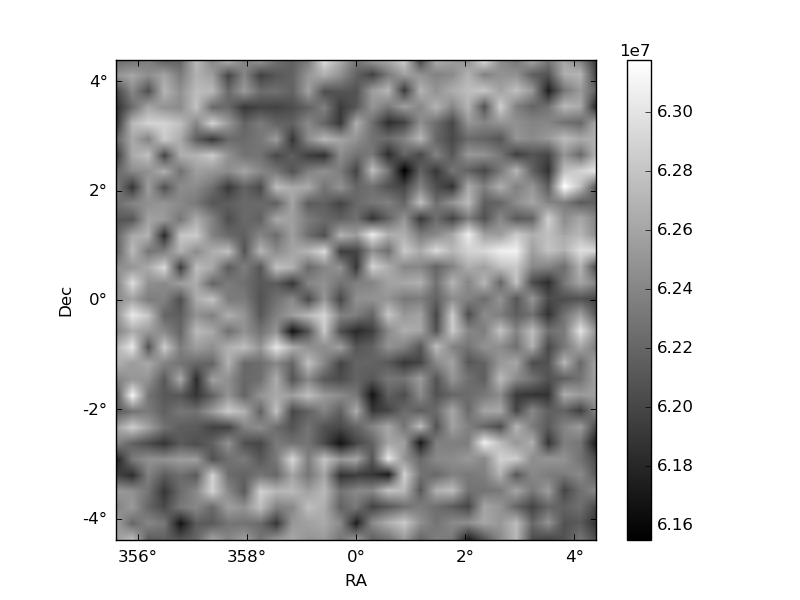
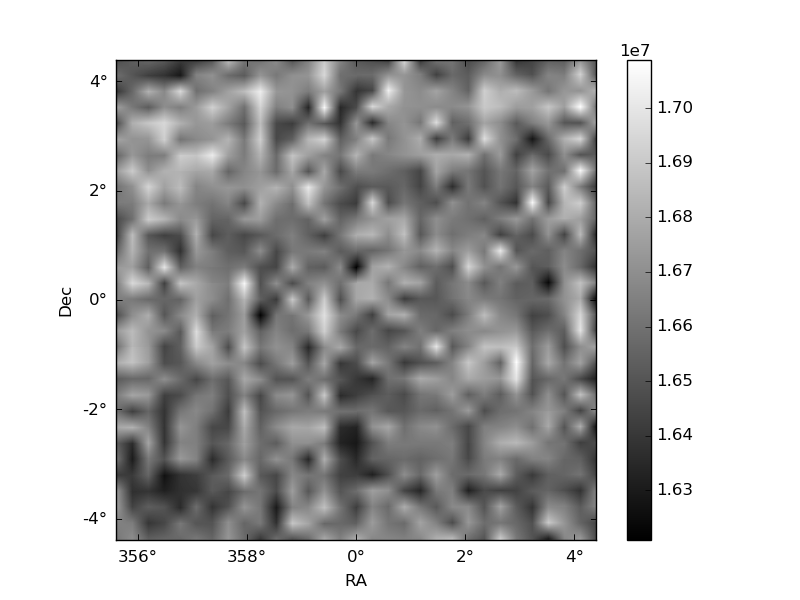
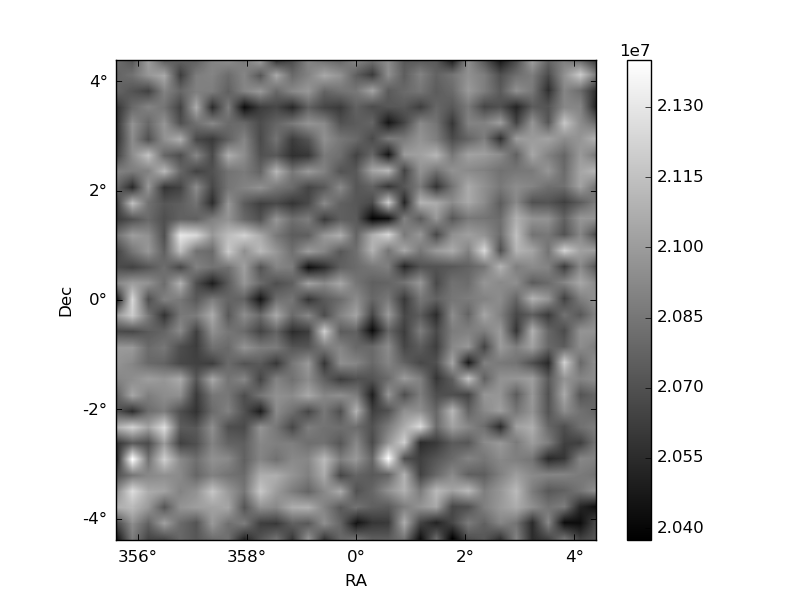
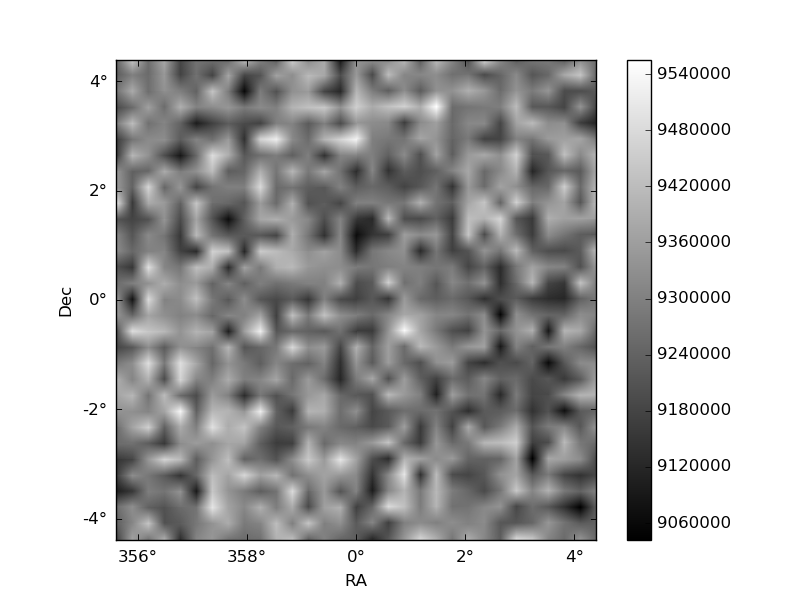
Histogram calculated using DETX and DETY for each event in the final _common_clean file
| Quadrant A | 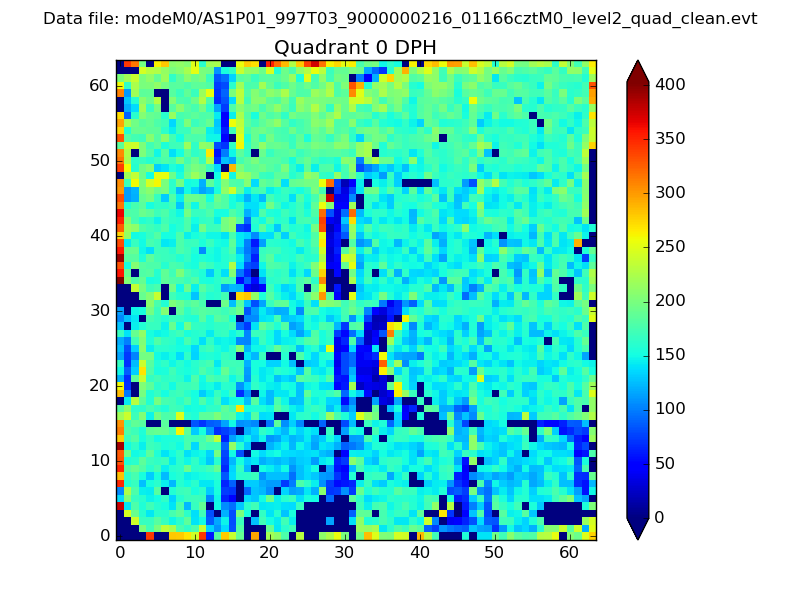 |
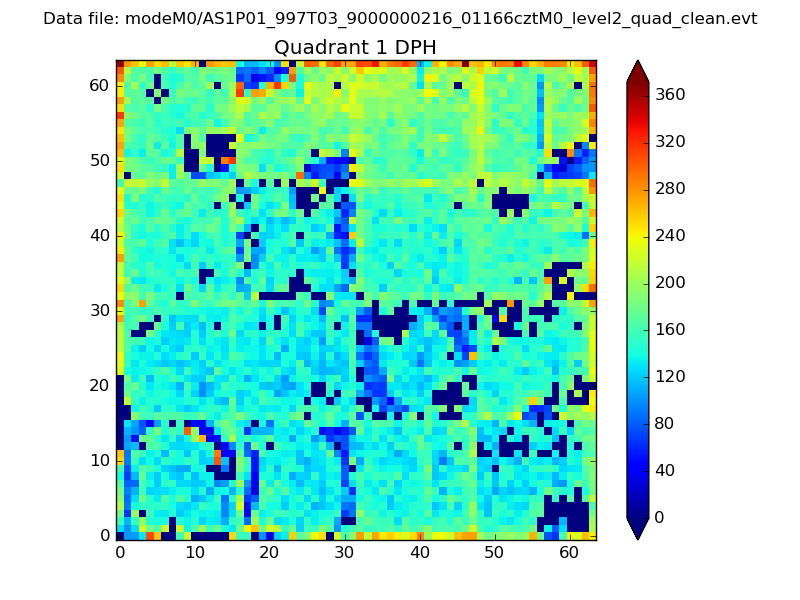 |
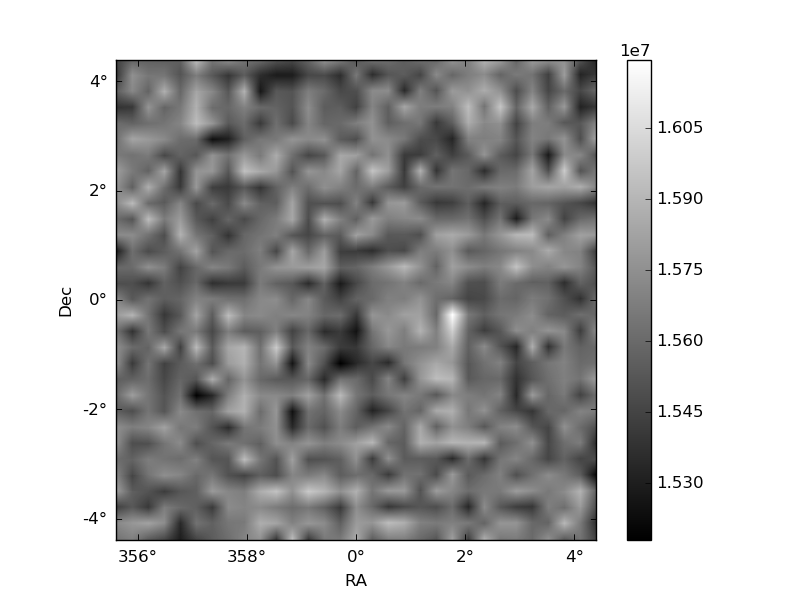
Quadrant B |
|---|---|---|---|
| Quadrant D | 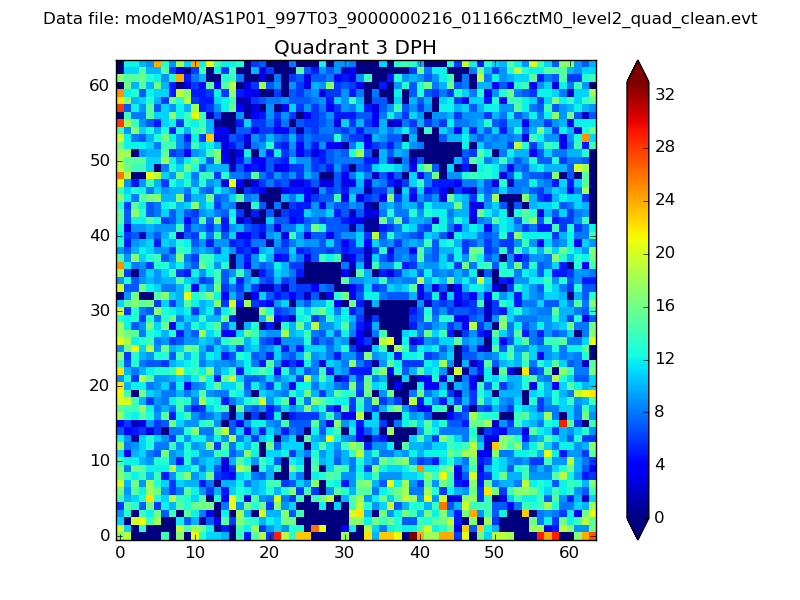 |
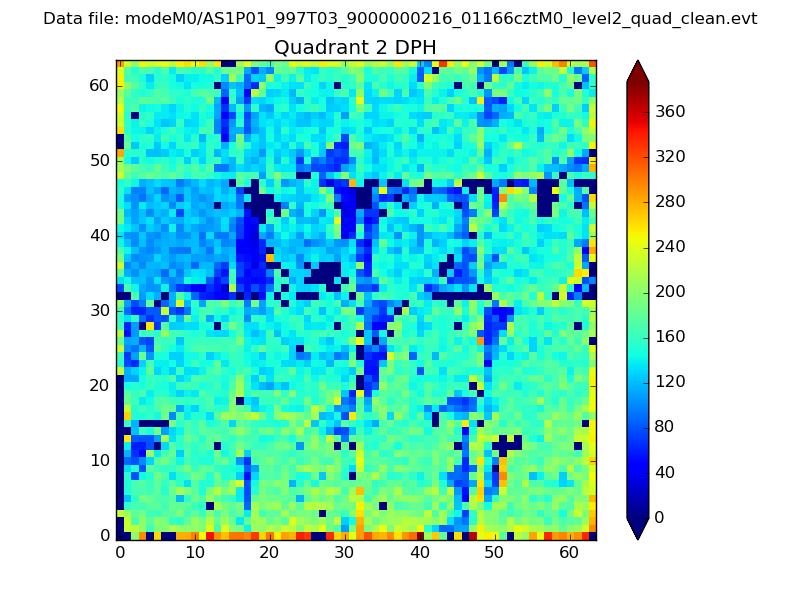 |
Quadrant C |
| Plot type | Count rate plots | Images |
|---|---|---|
| Comparison with Poisson distribution Blue bars denote a histogram of data divided into 1 sec bins. Red curve is a Poisson curve with rate = median count rate of data. |
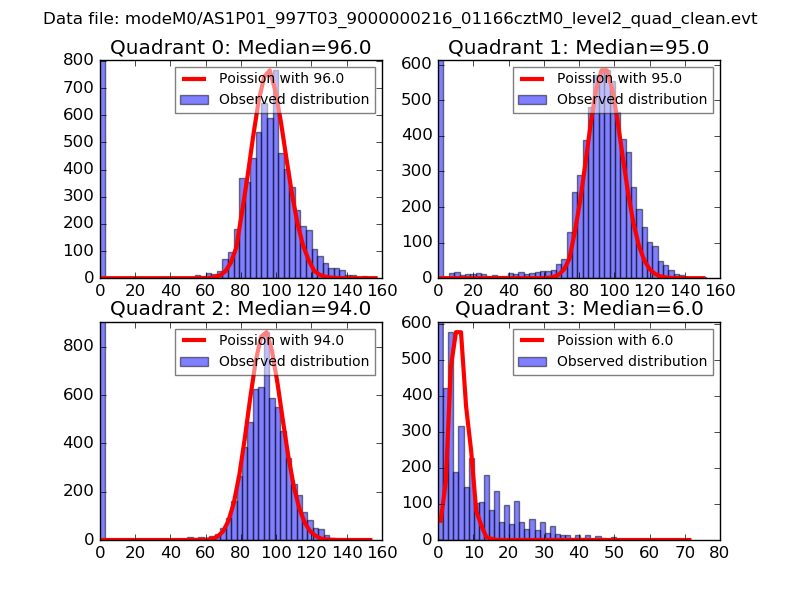 |
 |
| Quadrant-wise count rates Data is divided into 100 sec bins |
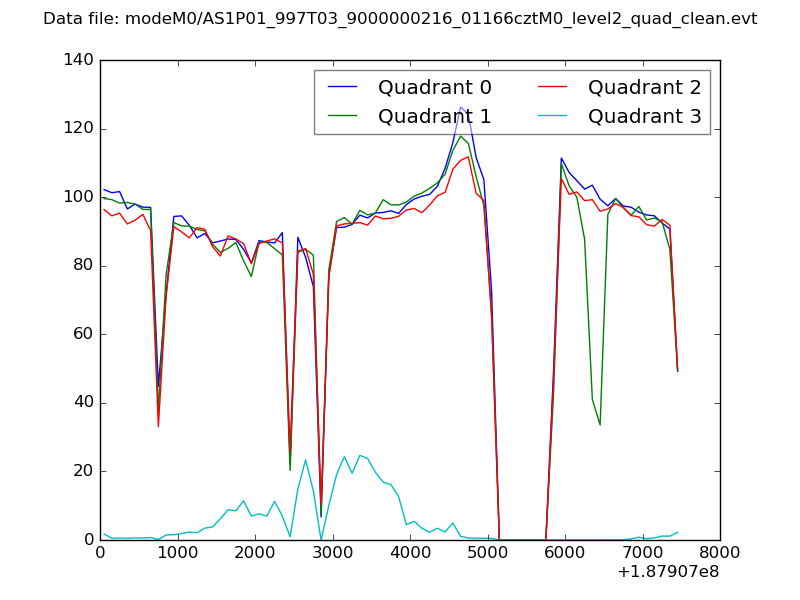 |
|
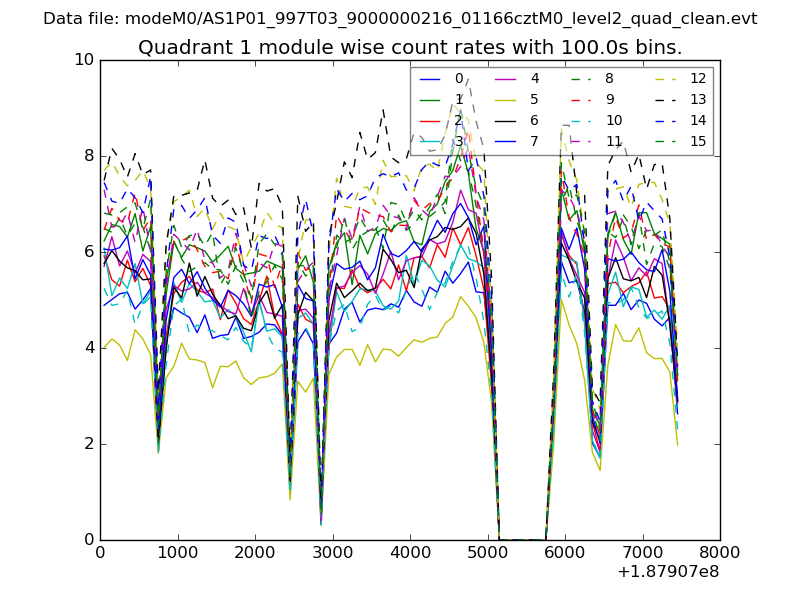
| Module-wise count rates for Quadrant A Data is divided into 100 sec bins |
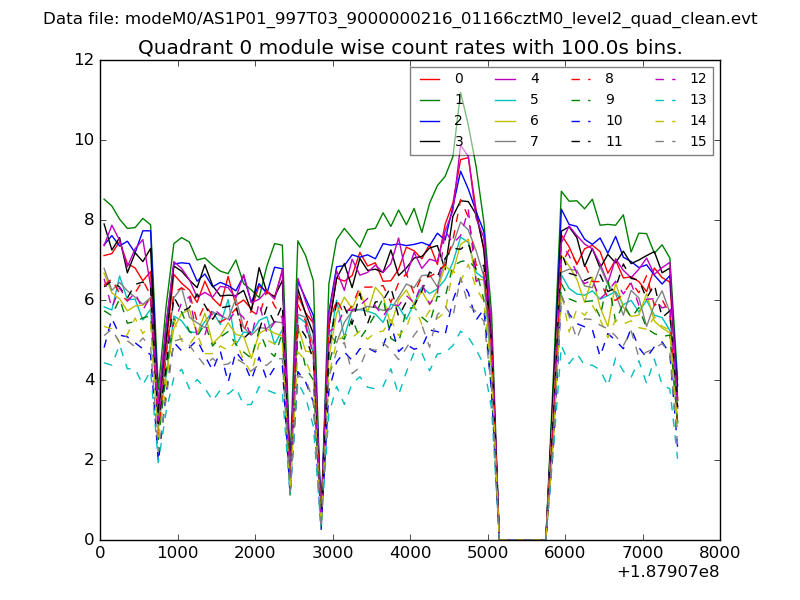 |
 |
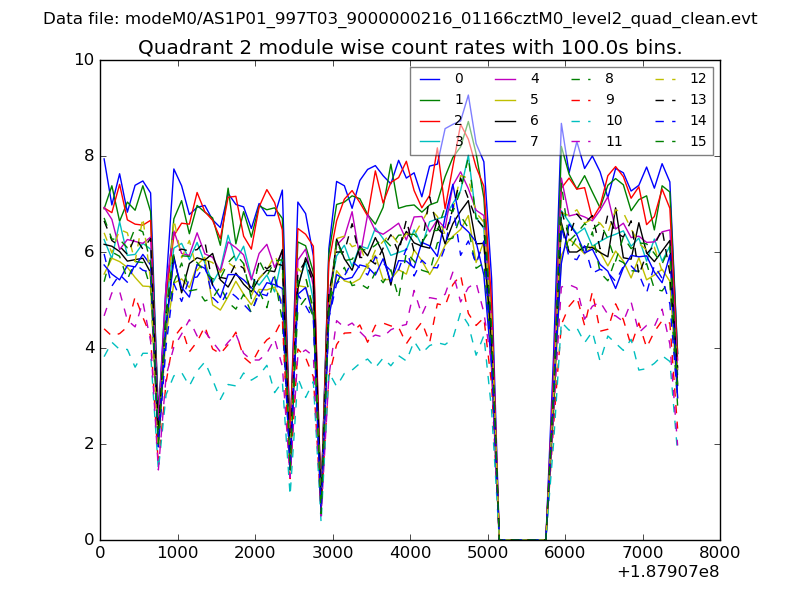
| Module-wise count rates for Quadrant B Data is divided into 100 sec bins |
 |
 |
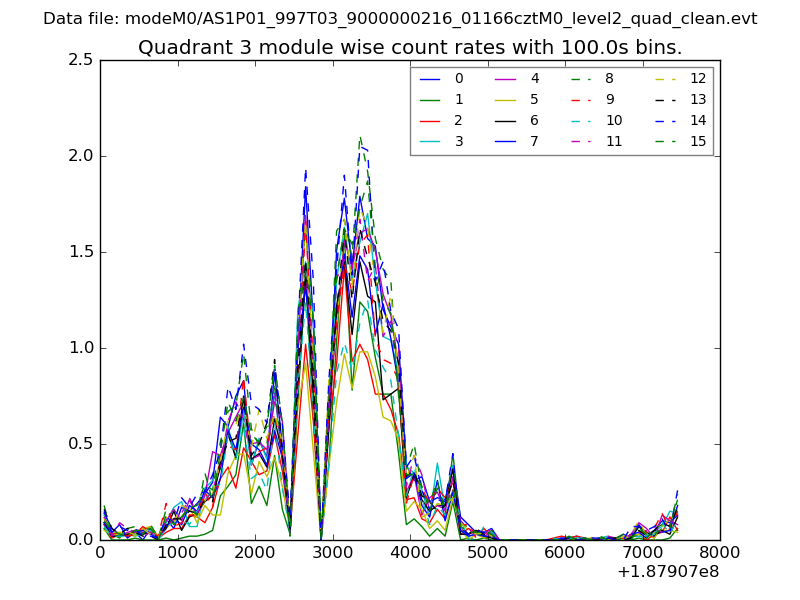
| Module-wise count rates for Quadrant C Data is divided into 100 sec bins |
 |
 |
| Module-wise count rates for Quadrant D Data is divided into 100 sec bins |
 |
 |
| Parameter | Plot |
|---|---|
| CZT HV Monitor | 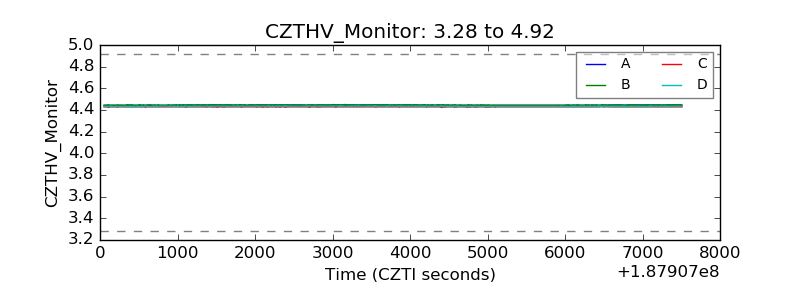 |
| D_VDD | 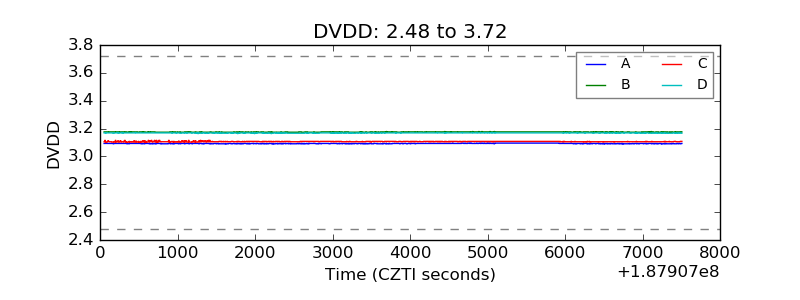 |
| Temperature 1 | 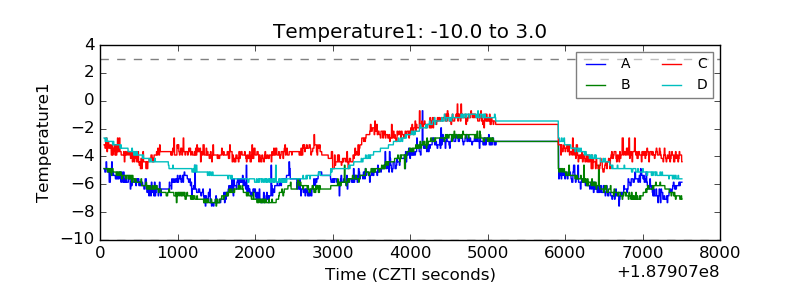 |
| Veto HV Monitor | 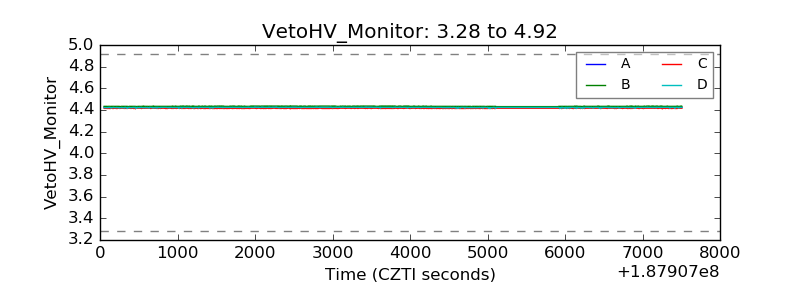 |
| Veto LLD | 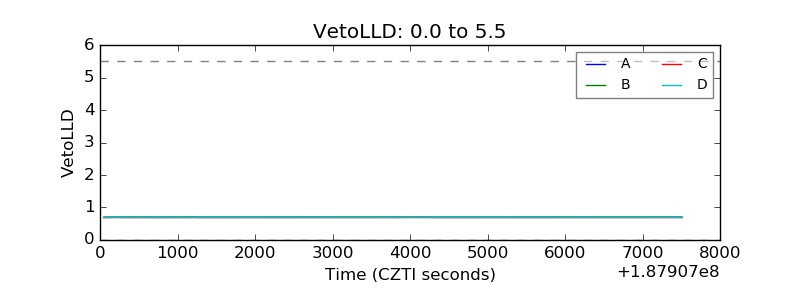 |
| Alpha Counter | 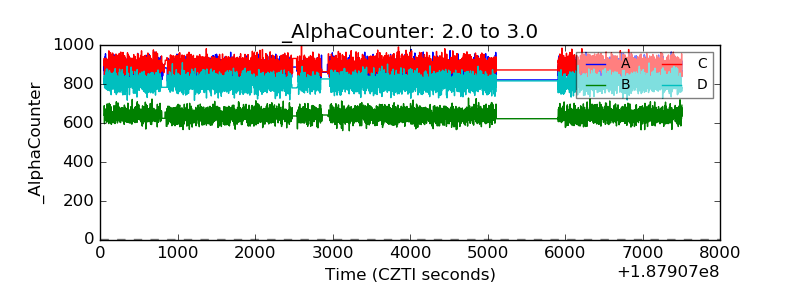 |
| _CPM_Rate | 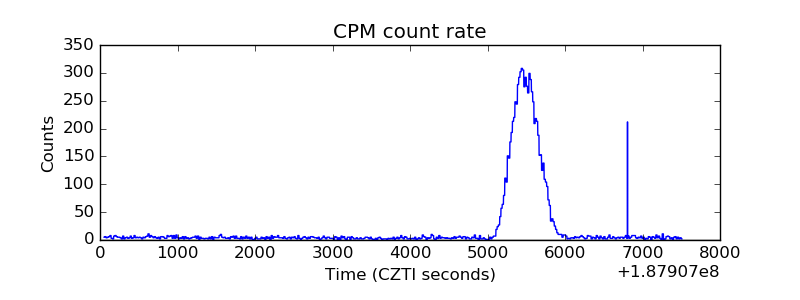 |
| CZT Counter | 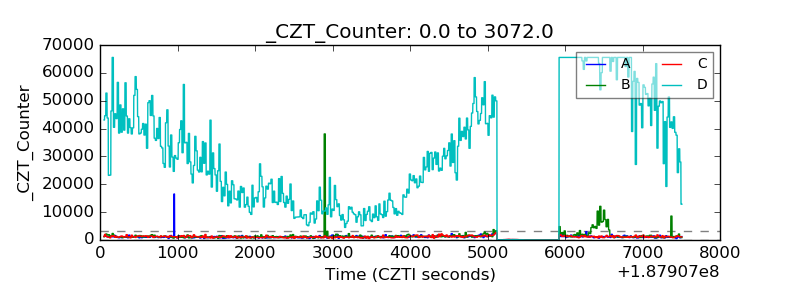 |
| +2.5 Volts monitor |  |
| +5 Volts monitor |  |
| _ROLL_ROT | 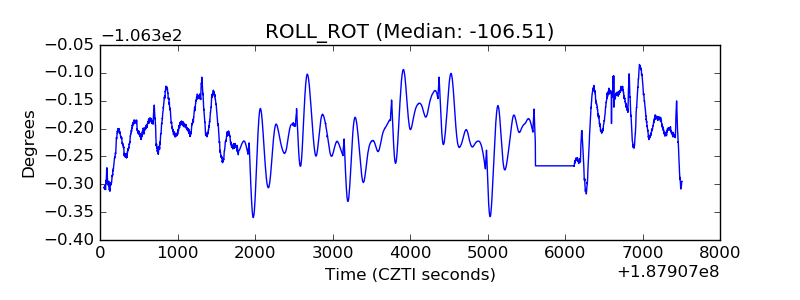 |
| _Roll_DEC | 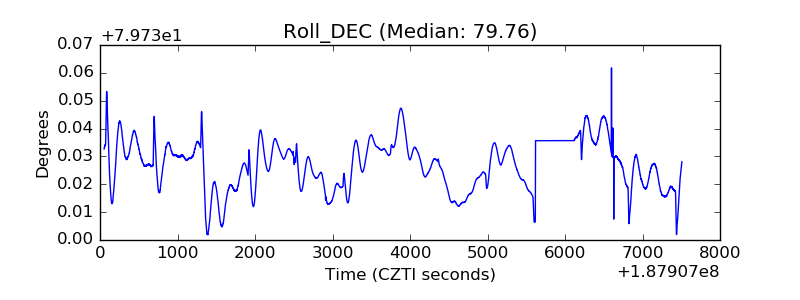 |
| _Roll_RA | 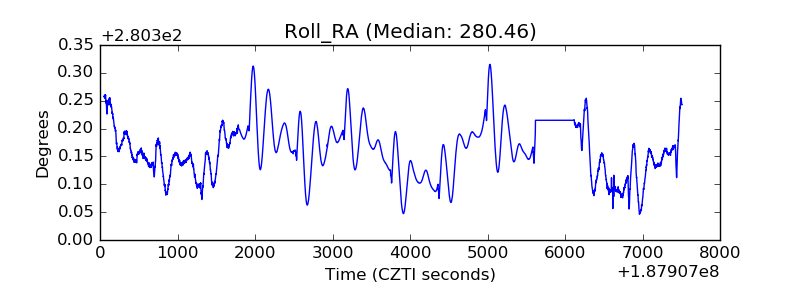 |
| Veto Counter | 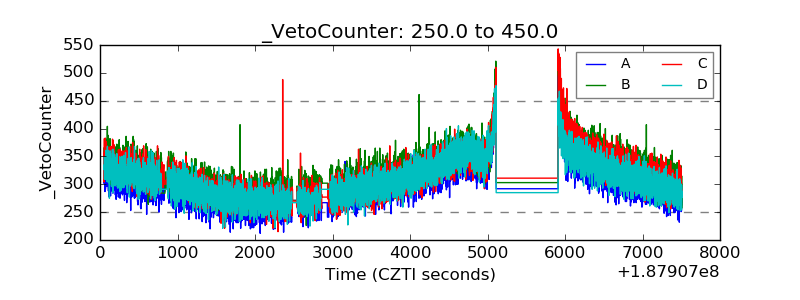 |