| Param | Original file | Final file |
|---|---|---|
| Filename | modeM0/AS1P01_997T03_9000000216_01167cztM0_level2.evt | modeM0/AS1P01_997T03_9000000216_01167cztM0_level2_quad_clean.evt |
| Size (bytes) | 1,445,129,280 | 79,012,800 |
| Size | 1.3 GB | 75.4 MB |
| Events in quadrant A | 7,436,912 | 642,125 |
| Events in quadrant B | 8,575,893 | 621,014 |
| Events in quadrant C | 7,632,337 | 623,791 |
| Events in quadrant D | 19,693,216 | 51,492 |
| Mode M0 | |||
|---|---|---|---|
| Quadrant | BADHDUFLAG | Total packets | Discarded packets |
| A | 0 | 27697 | 952 |
| B | 0 | 31452 | 1369 |
| C | 0 | 28289 | 1004 |
| D | 0 | 66607 | 2499 |
| Mode SS | |||
|---|---|---|---|
| Quadrant | BADHDUFLAG | Total packets | Discarded packets |
| A | 0 | 136 | 6 |
| B | 0 | 136 | 6 |
| C | 0 | 136 | 6 |
| D | 0 | 136 | 6 |
| Mode M9 | |||
|---|---|---|---|
| Quadrant | BADHDUFLAG | Total packets | Discarded packets |
| A | 0 | 10 | 0 |
| B | 0 | 10 | 0 |
| C | 0 | 10 | 0 |
| D | 0 | 11 | 1 |
| Quadrant | Total seconds | Saturated seconds | Saturation percentage |
|---|---|---|---|
| A | 6482 | 6 | 0.092564% |
| B | 6473 | 225 | 3.475977% |
| C | 6476 | 7 | 0.108091% |
| D | 6453 | 6286 | 97.412056% |
Noise dominated data is calculated using 1-second bins in cleaned event files. If a bin has >2000 counts, and if more than 50% of those come from <1% of pixels, then it is considered to be noise-dominated and hence unusable.
| Quadrant | # 1 sec bins | Bins with >0 counts | Bins with >2000 counts | High rate bins dominated by noise | Noise dominated (total time) | Noise dominated (detector-on time) | Marked lightcurve |
|---|---|---|---|---|---|---|---|
| A | 7692 | 6493 | 133 | 133 | 1.73% | 2.05% | 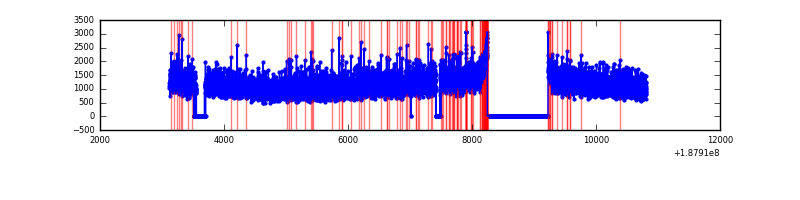 |
| B | 7691 | 6483 | 533 | 533 | 6.93% | 8.22% | 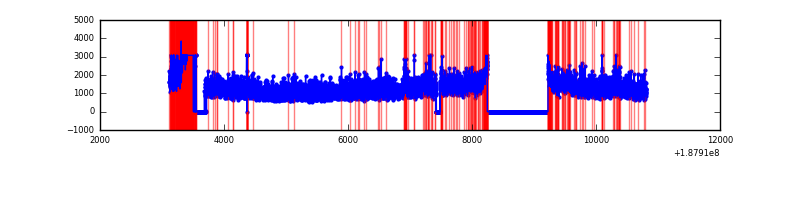 |
| C | 7692 | 6494 | 132 | 132 | 1.72% | 2.03% | 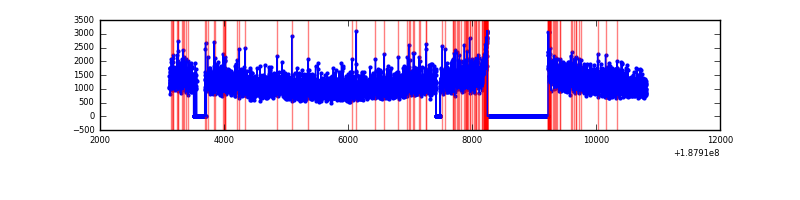 |
| D | 7692 | 6453 | 6409 | 6409 | 83.32% | 99.32% | 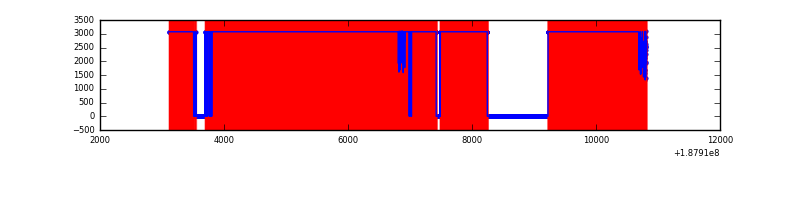 |
Top three noisy pixels from each quadrant. If the there are fewer than three noisy pixels in the level2.evt file, extra rows are filled as -1
| Pixel properties | Quadrant properties | ||||||
|---|---|---|---|---|---|---|---|
| Quadrant | DetID | PixID | Counts | Sigma | Mean | Median | Sigma |
| A | 12 | 243 | 16897 | 32.26 | 1933 | 1944 | 463.5 |
| A | 11 | 79 | 8497 | 14.14 | 1933 | 1944 | 463.5 |
| A | 3 | 111 | 6402 | 9.62 | 1933 | 1944 | 463.5 |
| B | 2 | 32 | 839304 | 1788.84 | 1992 | 2006 | 468.1 |
| B | 6 | 53 | 64851 | 134.26 | 1992 | 2006 | 468.1 |
| B | 15 | 22 | 29237 | 58.18 | 1992 | 2006 | 468.1 |
| C | 15 | 241 | 317550 | 617.27 | 1839 | 1901 | 511.4 |
| C | 9 | 68 | 38995 | 72.54 | 1839 | 1901 | 511.4 |
| C | 9 | 83 | 28010 | 51.06 | 1839 | 1901 | 511.4 |
| D | 1 | 239 | 18583480 | 203986.24 | 293 | 302 | 91.1 |
| D | 10 | 125 | 8259 | 87.34 | 293 | 302 | 91.1 |
| D | 2 | 54 | 2327 | 22.23 | 293 | 302 | 91.1 |
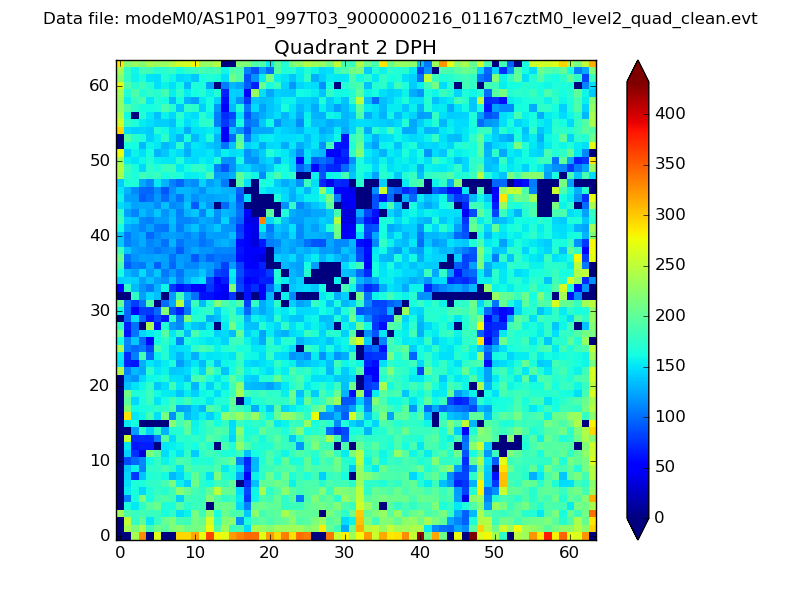
Histogram calculated using DETX and DETY for each event in the final _common_clean file
| Quadrant A | 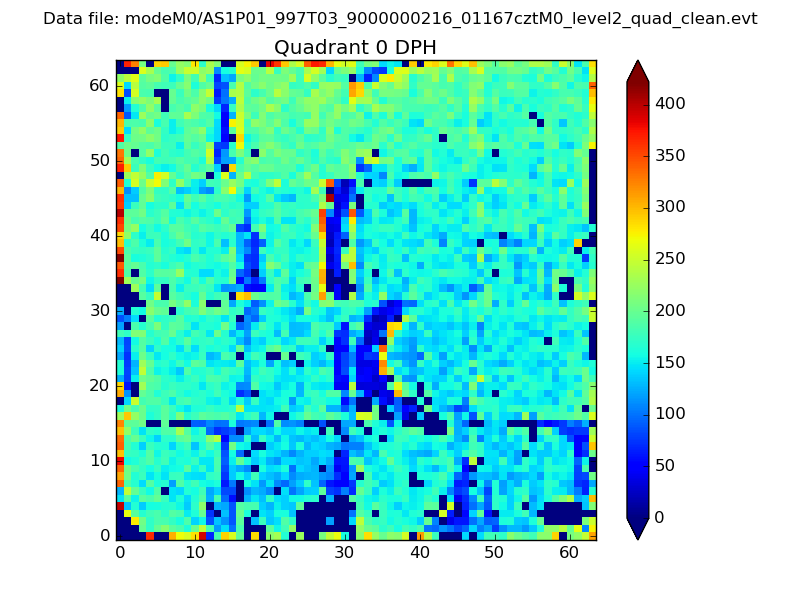 |
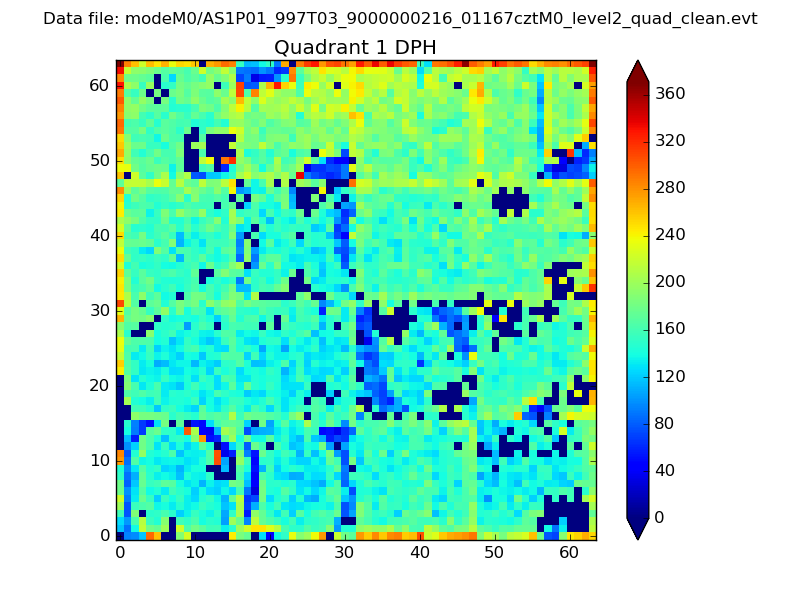 |
Quadrant B |
|---|---|---|---|
| Quadrant D | 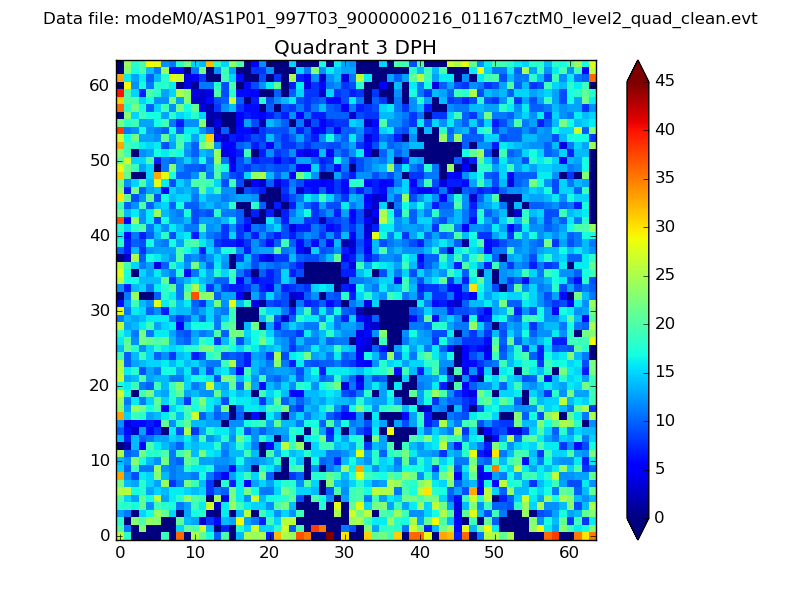 |
 |
Quadrant C |
| Plot type | Count rate plots | Images |
|---|---|---|
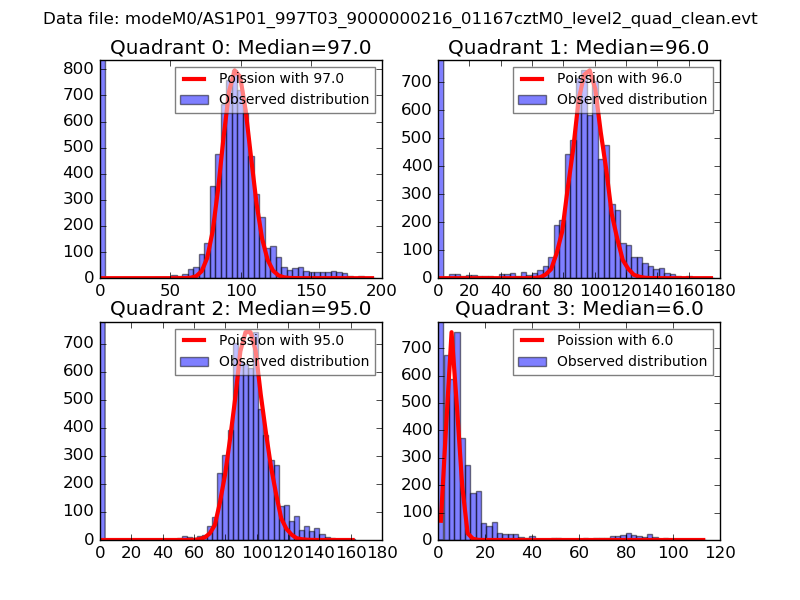
| Comparison with Poisson distribution Blue bars denote a histogram of data divided into 1 sec bins. Red curve is a Poisson curve with rate = median count rate of data. |
 |
 |
| Quadrant-wise count rates Data is divided into 100 sec bins |
 |
|
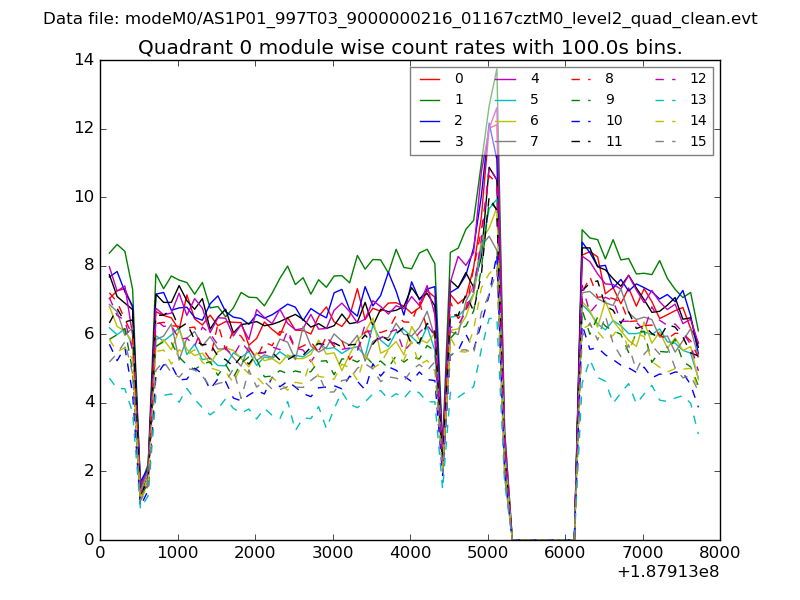
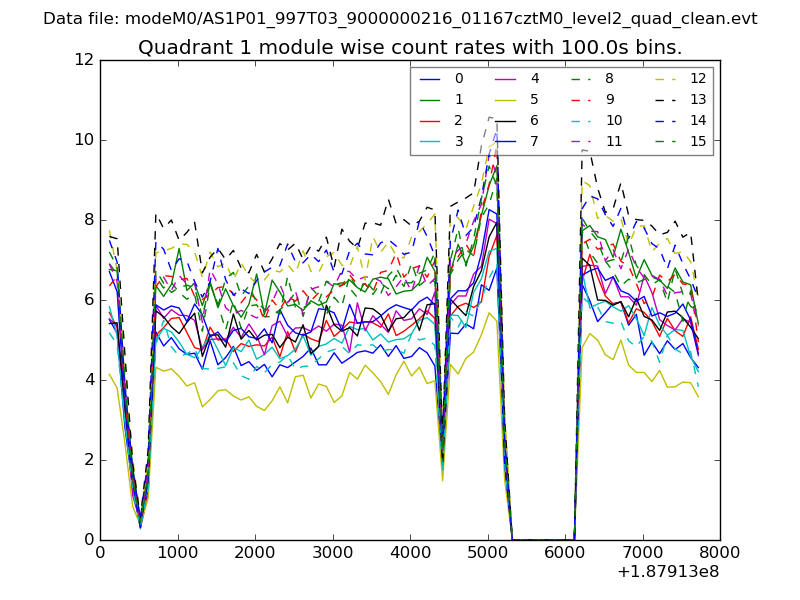
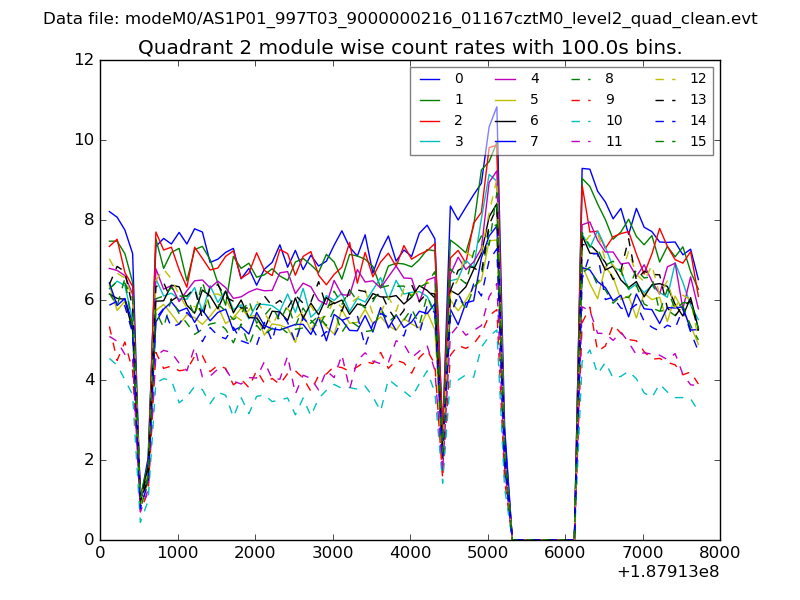
| Module-wise count rates for Quadrant A Data is divided into 100 sec bins |
 |
 |
| Module-wise count rates for Quadrant B Data is divided into 100 sec bins |
 |
 |
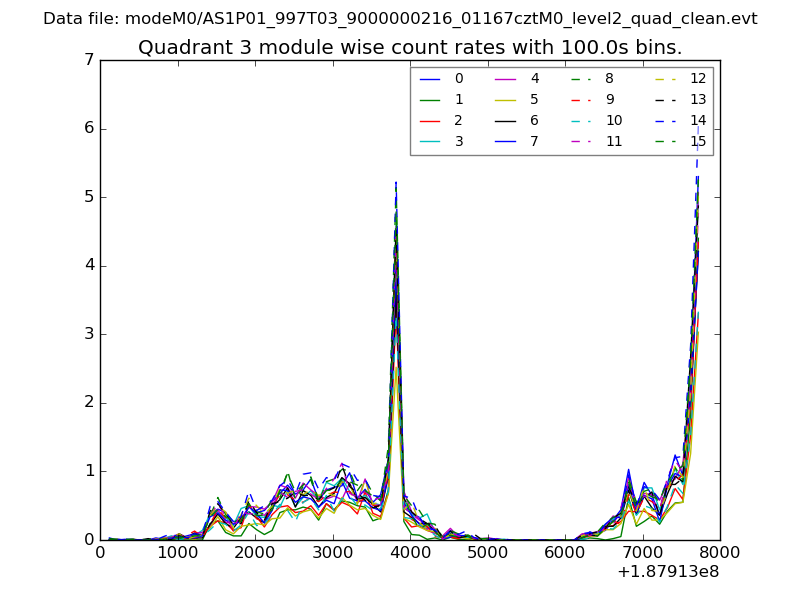
| Module-wise count rates for Quadrant C Data is divided into 100 sec bins |
 |
 |
| Module-wise count rates for Quadrant D Data is divided into 100 sec bins |
 |
 |
| Parameter | Plot |
|---|---|
| CZT HV Monitor | 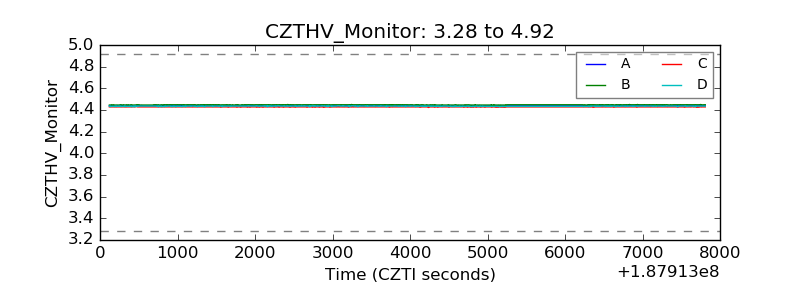 |
| D_VDD | 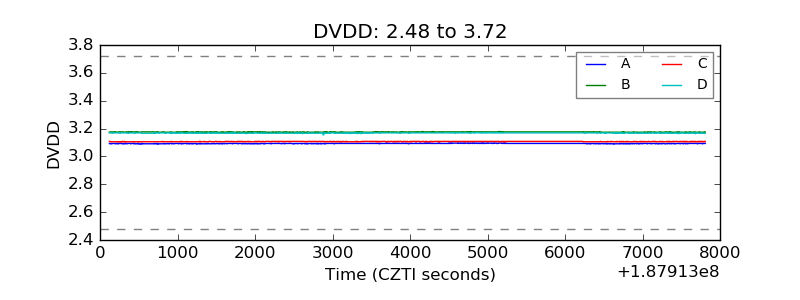 |
| Temperature 1 | 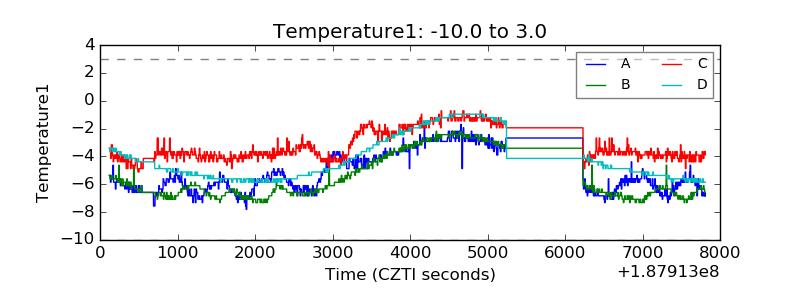 |
| Veto HV Monitor | 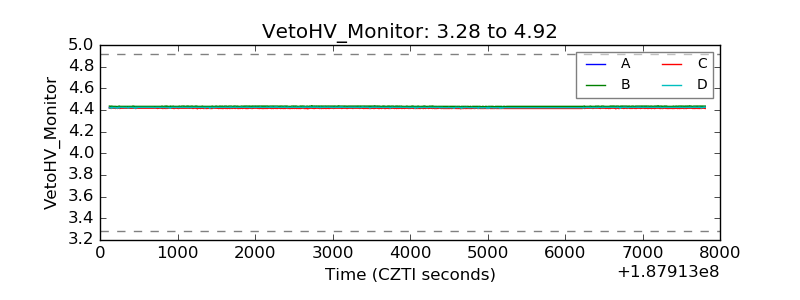 |
| Veto LLD | 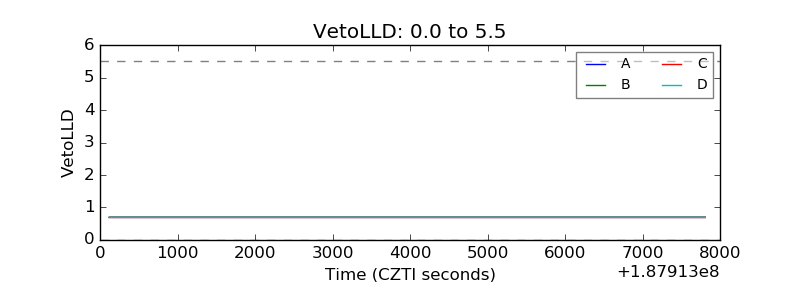 |
| Alpha Counter | 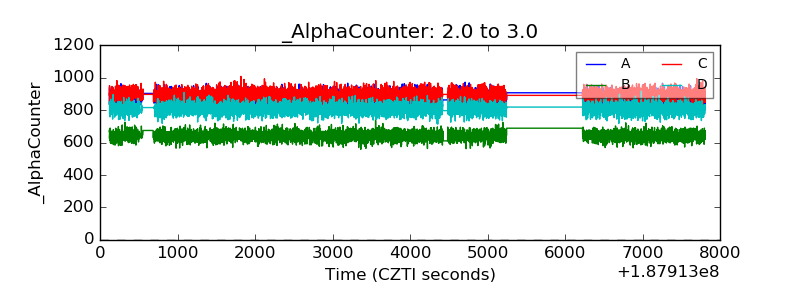 |
| _CPM_Rate | 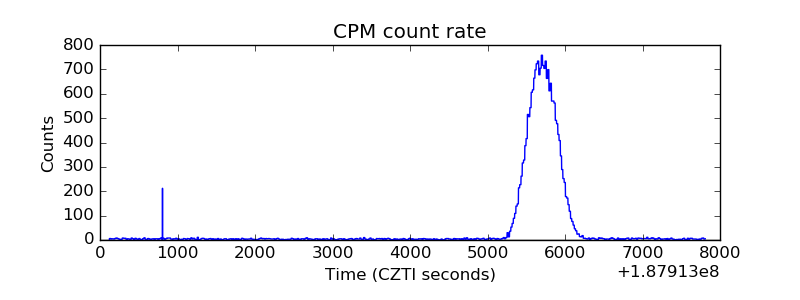 |
| CZT Counter | 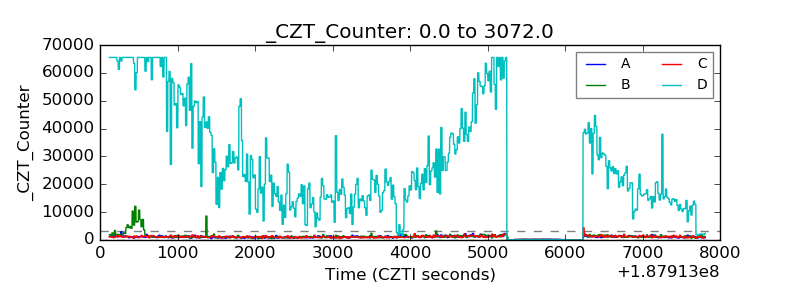 |
| +2.5 Volts monitor |  |
| +5 Volts monitor |  |
| _ROLL_ROT | 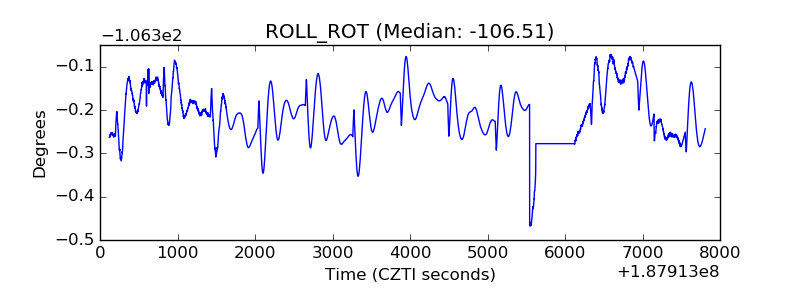 |
| _Roll_DEC | 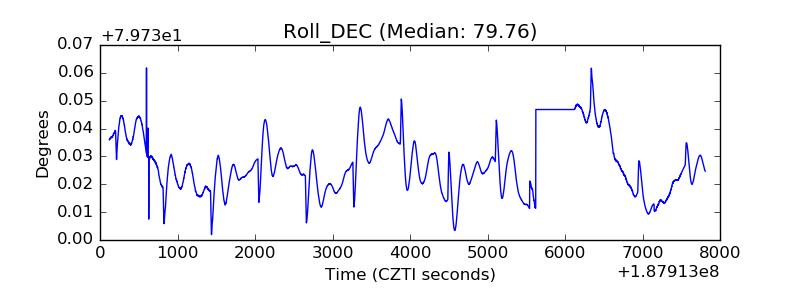 |
| _Roll_RA | 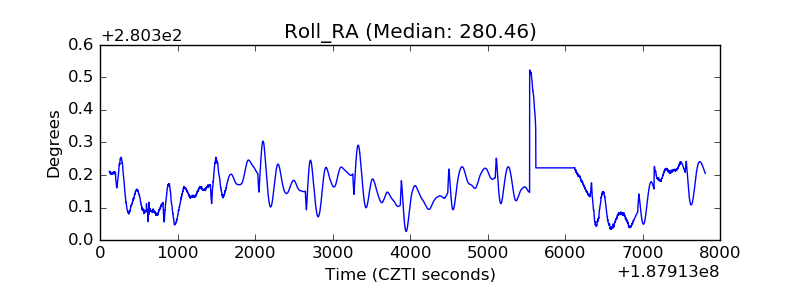 |
| Veto Counter | 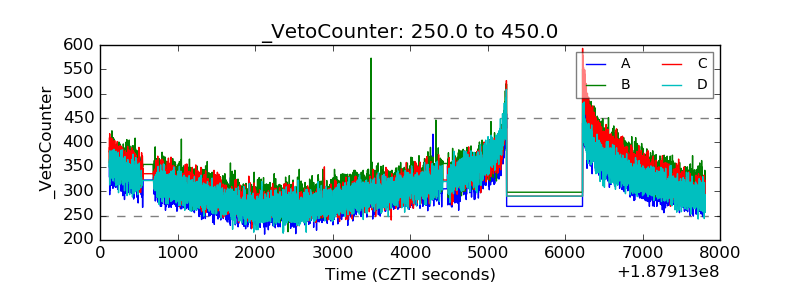 |