| Param | Original file | Final file |
|---|---|---|
| Filename | modeM0/AS1P01_997T03_9000000216_01169cztM0_level2.evt | modeM0/AS1P01_997T03_9000000216_01169cztM0_level2_quad_clean.evt |
| Size (bytes) | 1,488,499,200 | 86,083,200 |
| Size | 1.4 GB | 82.1 MB |
| Events in quadrant A | 8,583,394 | 652,053 |
| Events in quadrant B | 8,523,377 | 666,742 |
| Events in quadrant C | 7,826,723 | 653,191 |
| Events in quadrant D | 19,706,050 | 167,561 |
| Mode M0 | |||
|---|---|---|---|
| Quadrant | BADHDUFLAG | Total packets | Discarded packets |
| A | 0 | 30266 | 3 |
| B | 0 | 30051 | 2 |
| C | 0 | 28004 | 2 |
| D | 0 | 64222 | 2 |
| Mode SS | |||
|---|---|---|---|
| Quadrant | BADHDUFLAG | Total packets | Discarded packets |
| A | 0 | 136 | 0 |
| B | 0 | 136 | 0 |
| C | 0 | 136 | 0 |
| D | 0 | 136 | 0 |
| Mode M9 | |||
|---|---|---|---|
| Quadrant | BADHDUFLAG | Total packets | Discarded packets |
| A | 0 | 11 | 0 |
| B | 0 | 11 | 0 |
| C | 0 | 11 | 0 |
| D | 0 | 12 | 0 |
| Quadrant | Total seconds | Saturated seconds | Saturation percentage |
|---|---|---|---|
| A | 6659 | 220 | 3.303799% |
| B | 6659 | 20 | 0.300345% |
| C | 6659 | 15 | 0.225259% |
| D | 6659 | 5907 | 88.707013% |
Noise dominated data is calculated using 1-second bins in cleaned event files. If a bin has >2000 counts, and if more than 50% of those come from <1% of pixels, then it is considered to be noise-dominated and hence unusable.
| Quadrant | # 1 sec bins | Bins with >0 counts | Bins with >2000 counts | High rate bins dominated by noise | Noise dominated (total time) | Noise dominated (detector-on time) | Marked lightcurve |
|---|---|---|---|---|---|---|---|
| A | 7753 | 6658 | 560 | 560 | 7.22% | 8.41% | 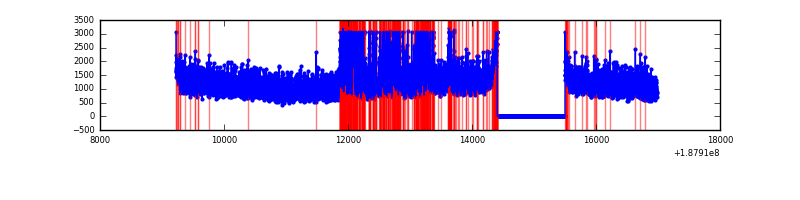 |
| B | 7753 | 6658 | 293 | 293 | 3.78% | 4.40% | 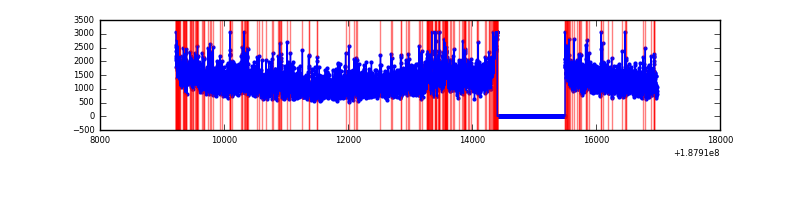 |
| C | 7753 | 6658 | 150 | 150 | 1.93% | 2.25% | 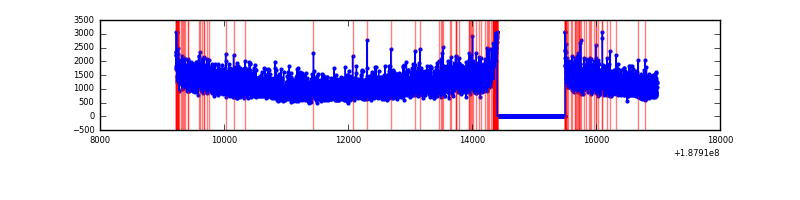 |
| D | 7753 | 6658 | 6306 | 6306 | 81.34% | 94.71% | 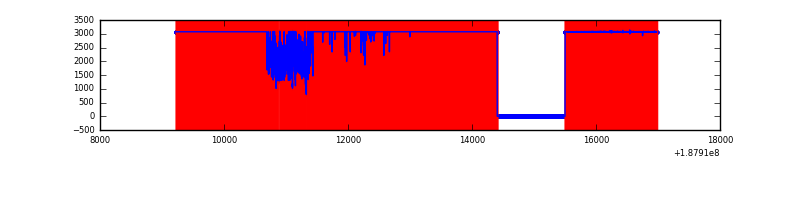 |
Top three noisy pixels from each quadrant. If the there are fewer than three noisy pixels in the level2.evt file, extra rows are filled as -1
| Pixel properties | Quadrant properties | ||||||
|---|---|---|---|---|---|---|---|
| Quadrant | DetID | PixID | Counts | Sigma | Mean | Median | Sigma |
| A | 0 | 175 | 958048 | 2008.23 | 1983 | 2004 | 476.1 |
| A | 12 | 243 | 10799 | 18.47 | 1983 | 2004 | 476.1 |
| A | 13 | 164 | 8193 | 13.0 | 1983 | 2004 | 476.1 |
| B | 2 | 32 | 291854 | 583.4 | 2115 | 2125 | 496.6 |
| B | 5 | 191 | 52268 | 100.97 | 2115 | 2125 | 496.6 |
| B | 5 | 249 | 35907 | 68.02 | 2115 | 2125 | 496.6 |
| C | 15 | 241 | 326460 | 614.17 | 1897 | 1963 | 528.4 |
| C | 9 | 83 | 32515 | 57.82 | 1897 | 1963 | 528.4 |
| C | 3 | 111 | 21299 | 36.6 | 1897 | 1963 | 528.4 |
| D | 1 | 239 | 17297570 | 88910.89 | 629 | 649 | 194.5 |
| D | 2 | 16 | 21509 | 107.23 | 629 | 649 | 194.5 |
| D | 13 | 25 | 16116 | 79.5 | 629 | 649 | 194.5 |
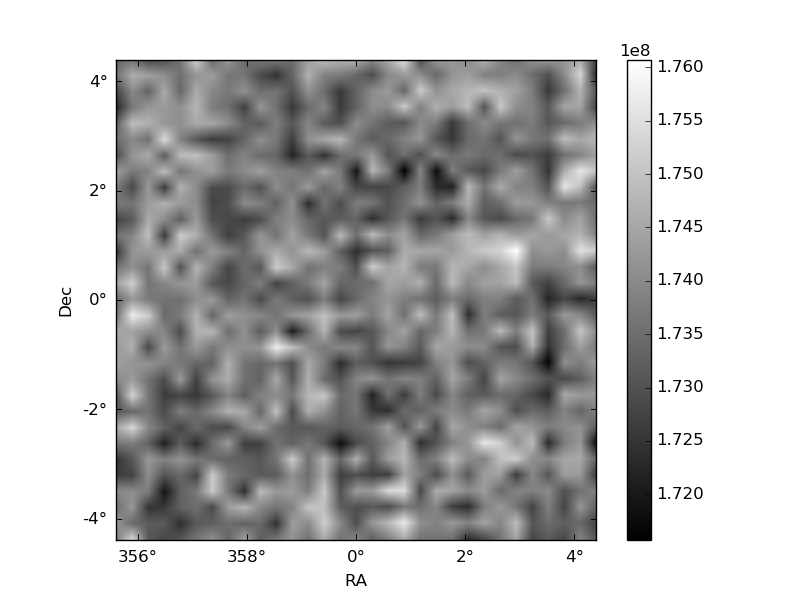
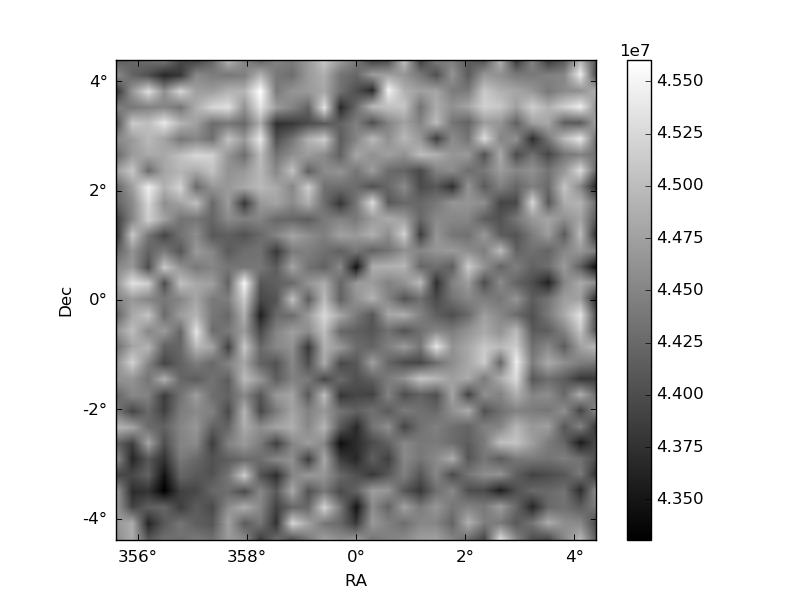
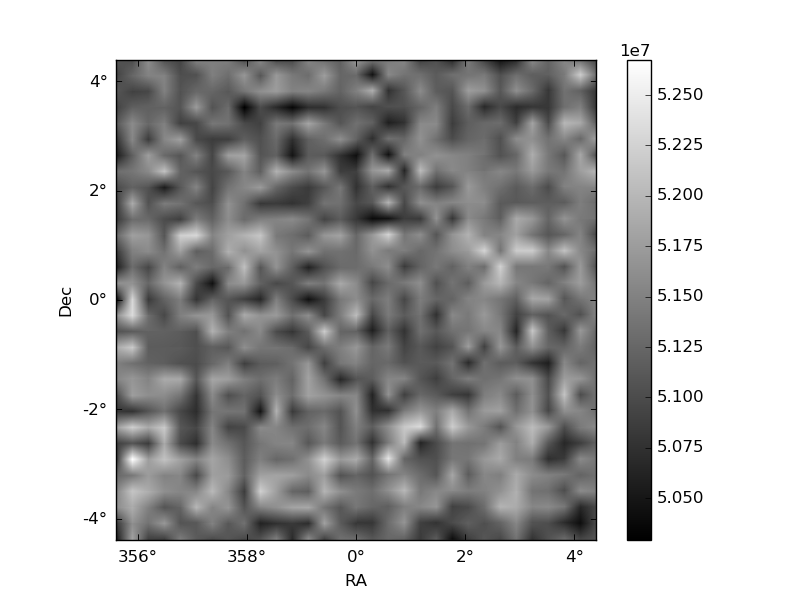
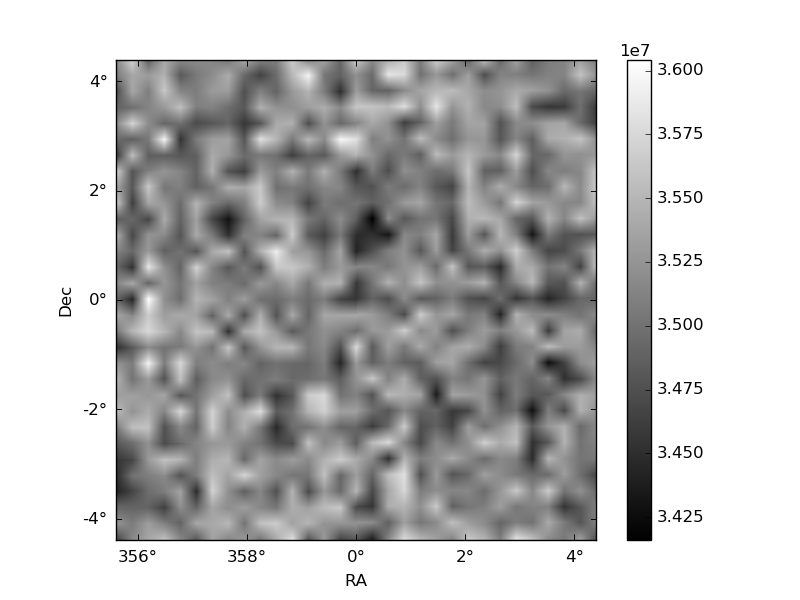
Histogram calculated using DETX and DETY for each event in the final _common_clean file
| Quadrant A | 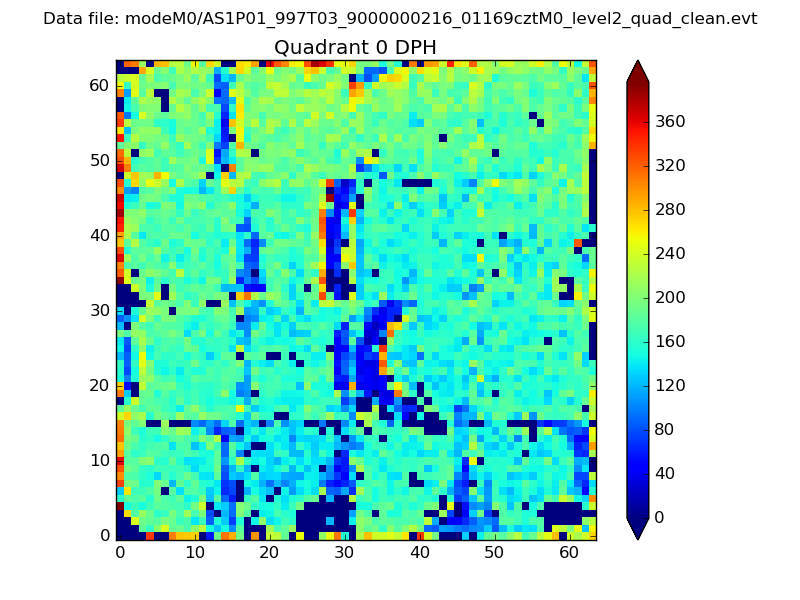 |
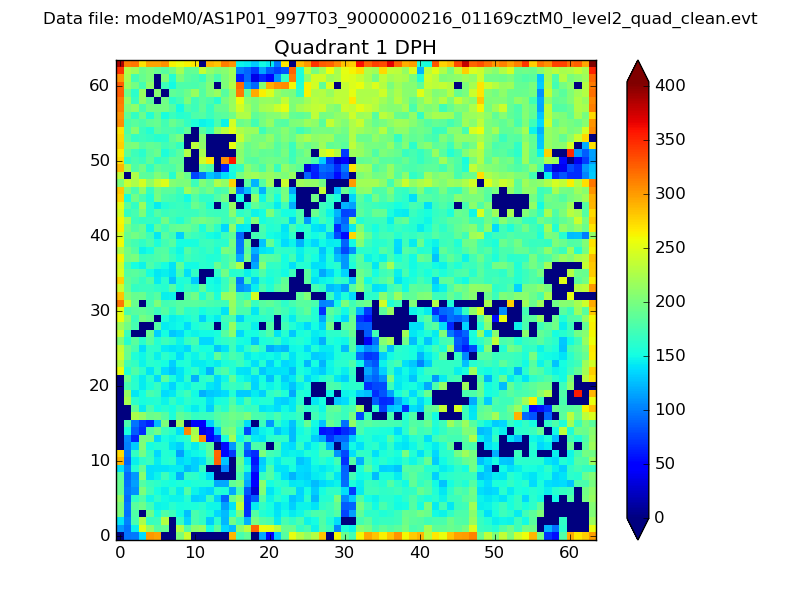 |
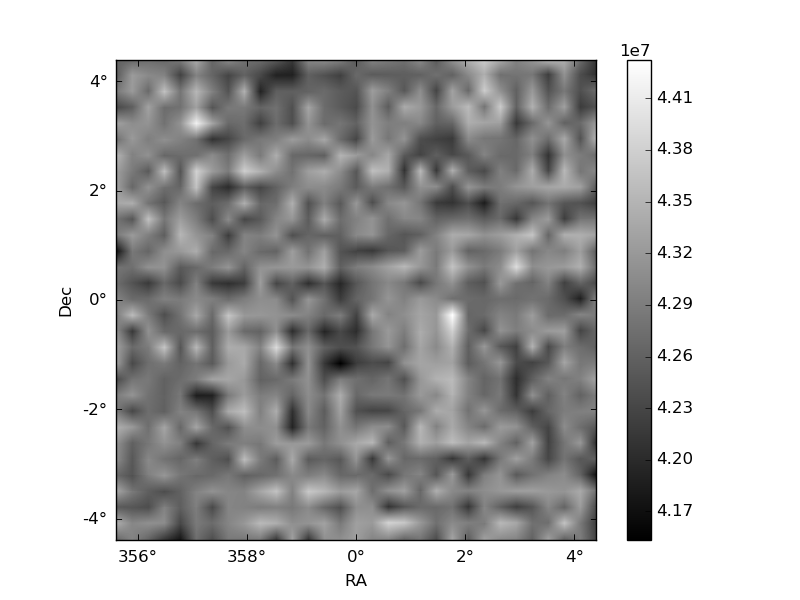
Quadrant B |
|---|---|---|---|
| Quadrant D | 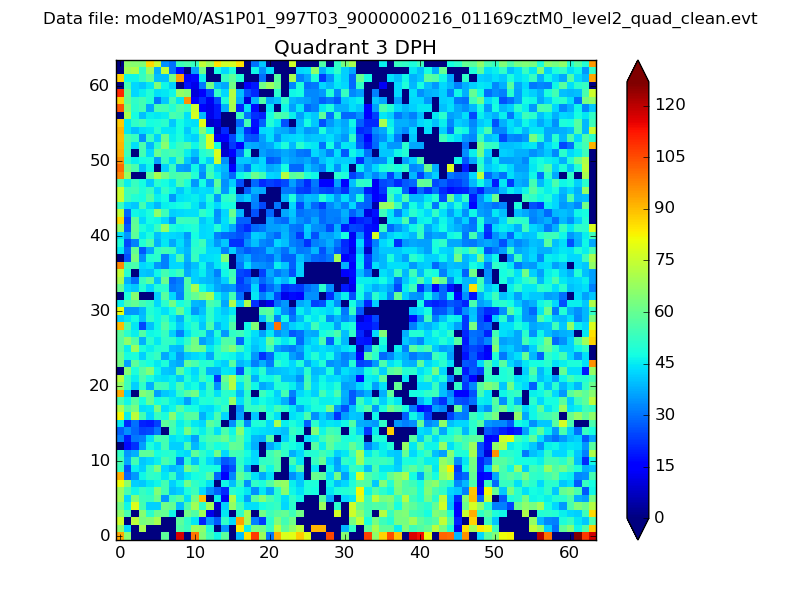 |
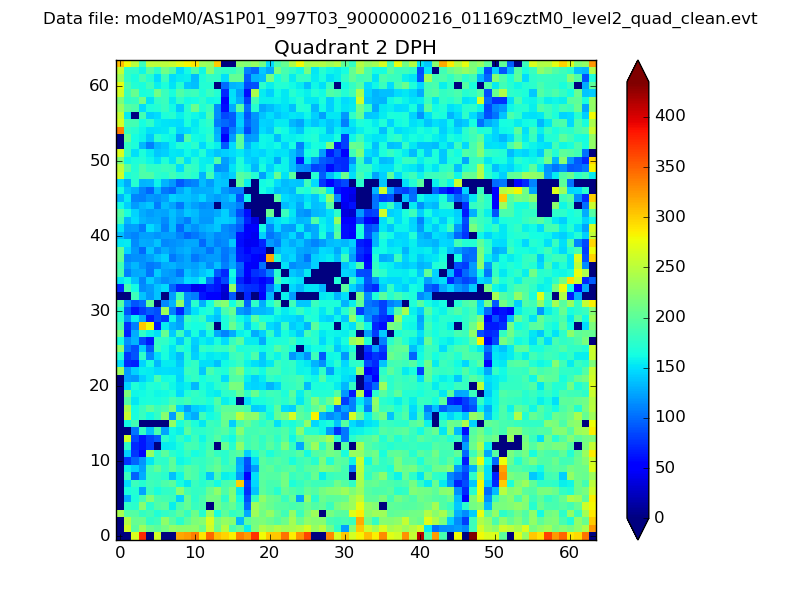 |
Quadrant C |
| Plot type | Count rate plots | Images |
|---|---|---|
| Comparison with Poisson distribution Blue bars denote a histogram of data divided into 1 sec bins. Red curve is a Poisson curve with rate = median count rate of data. |
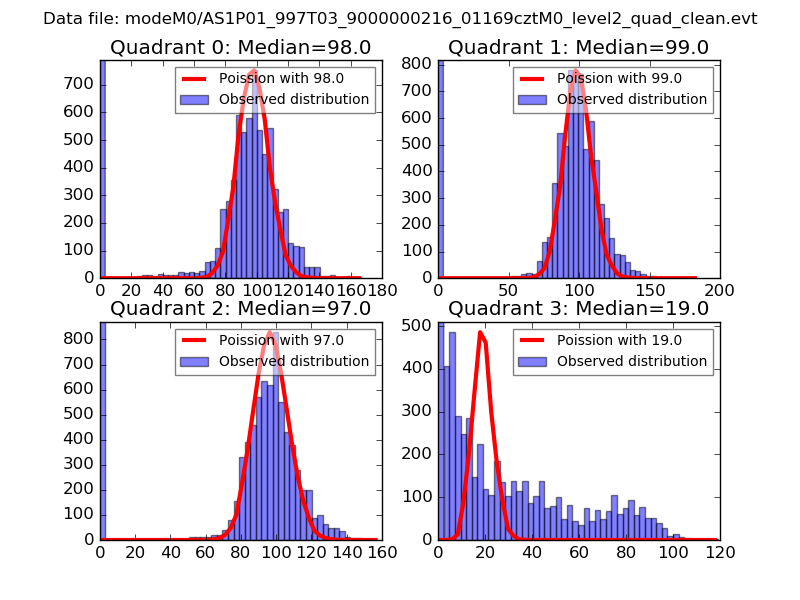 |
 |
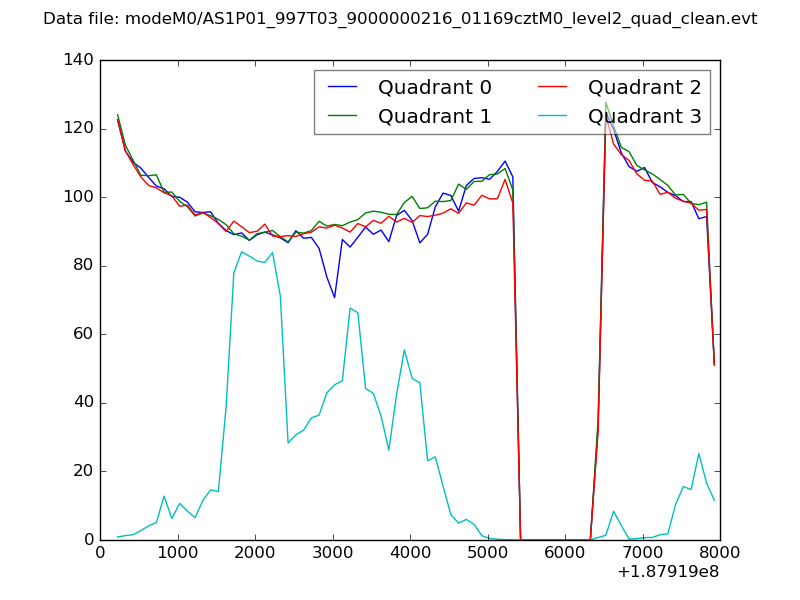
| Quadrant-wise count rates Data is divided into 100 sec bins |
 |
|
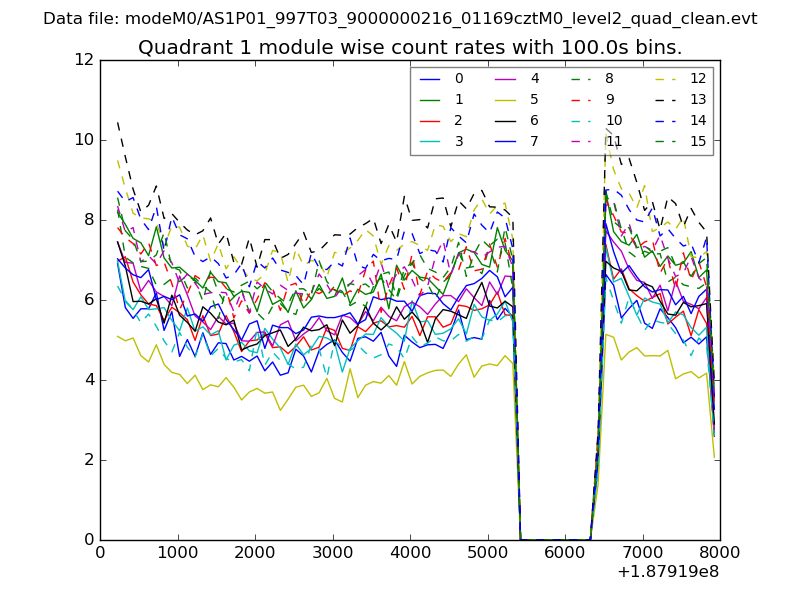
| Module-wise count rates for Quadrant A Data is divided into 100 sec bins |
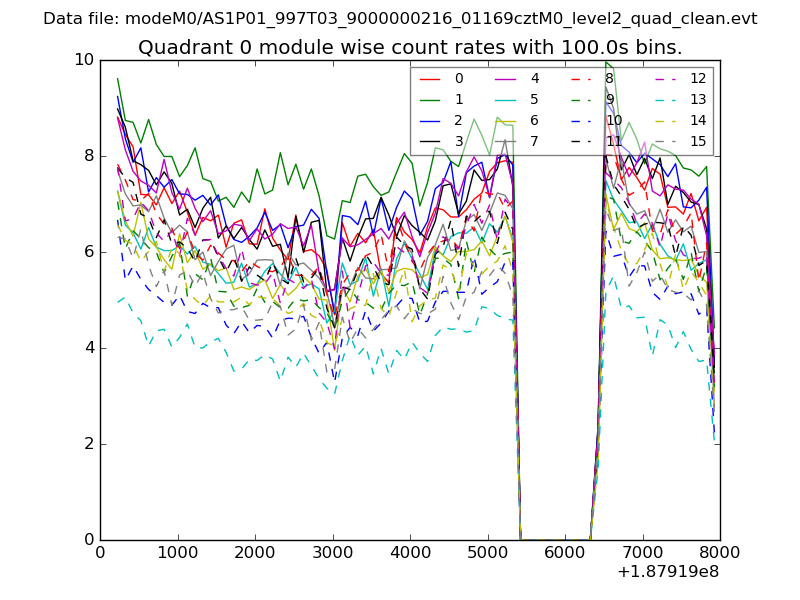 |
 |
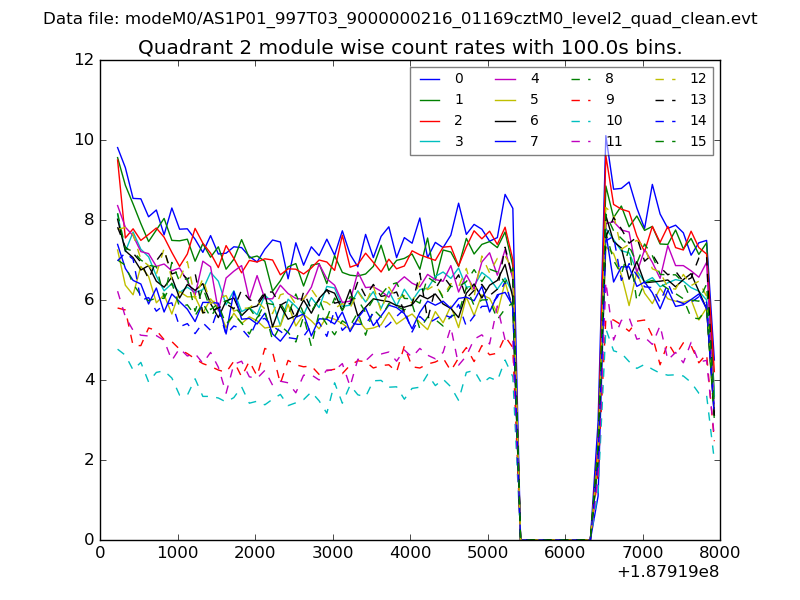
| Module-wise count rates for Quadrant B Data is divided into 100 sec bins |
 |
 |
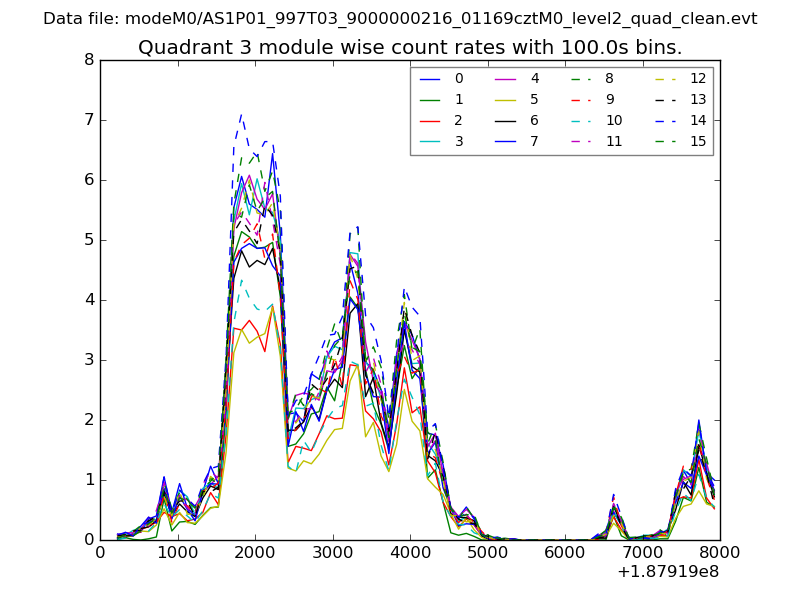
| Module-wise count rates for Quadrant C Data is divided into 100 sec bins |
 |
 |
| Module-wise count rates for Quadrant D Data is divided into 100 sec bins |
 |
 |
| Parameter | Plot |
|---|---|
| CZT HV Monitor | 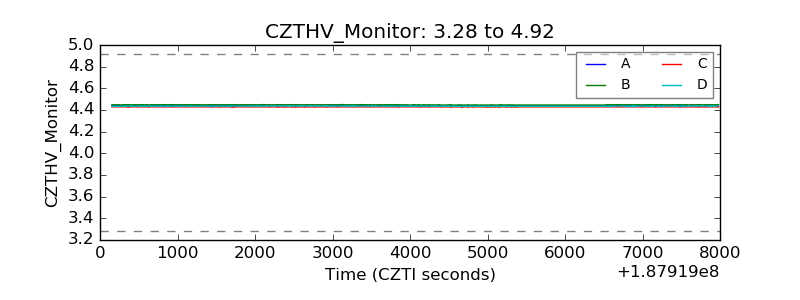 |
| D_VDD | 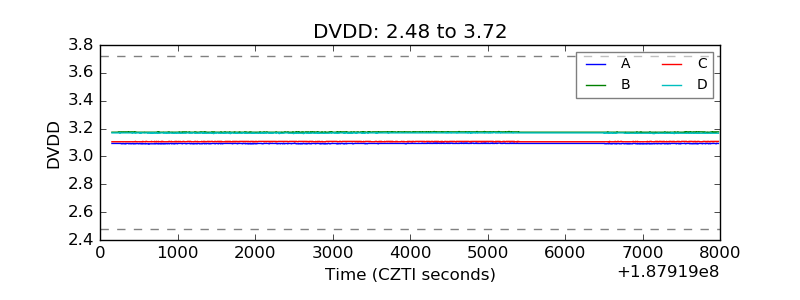 |
| Temperature 1 | 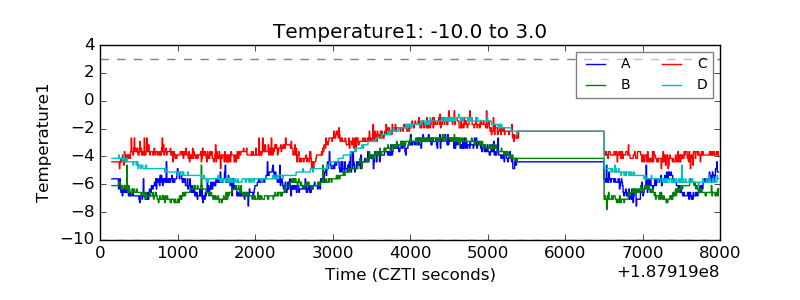 |
| Veto HV Monitor | 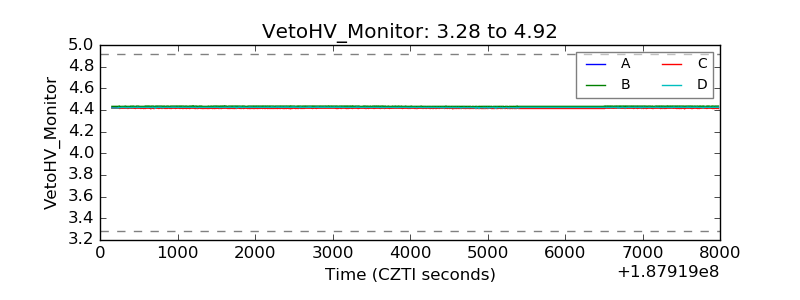 |
| Veto LLD | 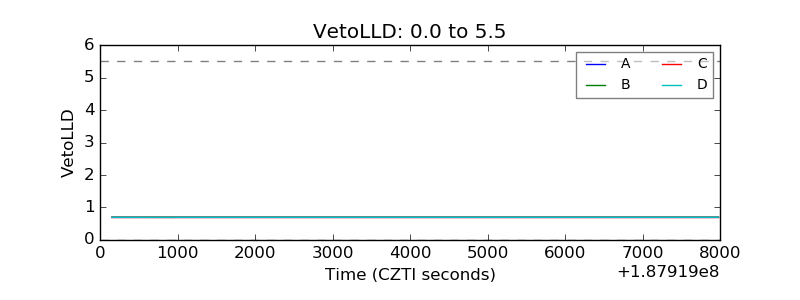 |
| Alpha Counter | 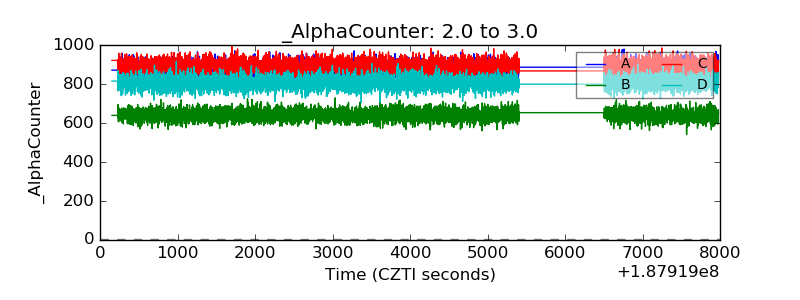 |
| _CPM_Rate | 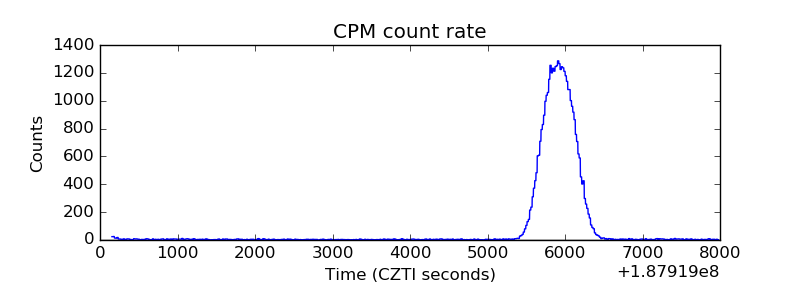 |
| CZT Counter | 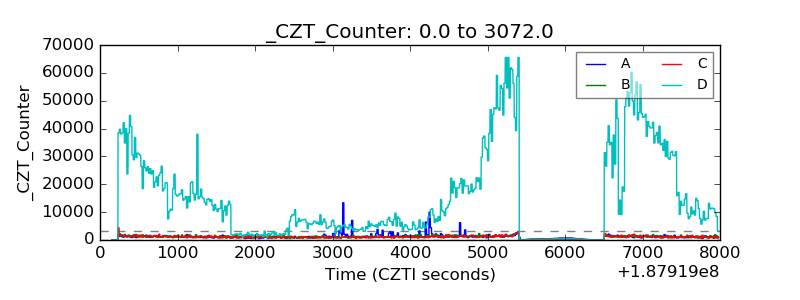 |
| +2.5 Volts monitor |  |
| +5 Volts monitor |  |
| _ROLL_ROT | 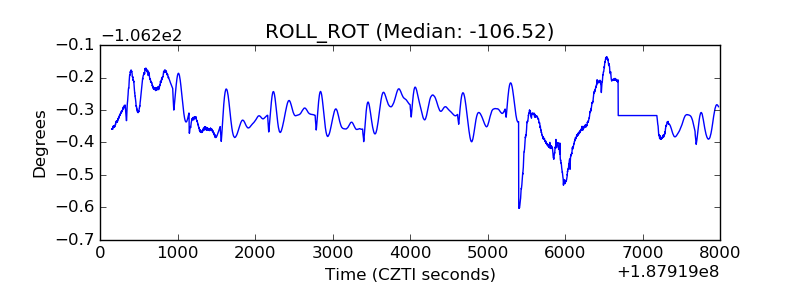 |
| _Roll_DEC | 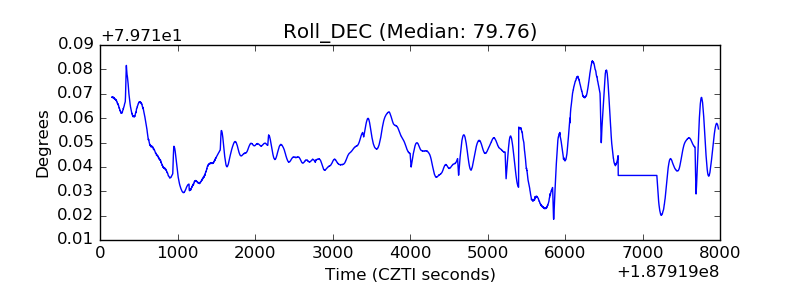 |
| _Roll_RA | 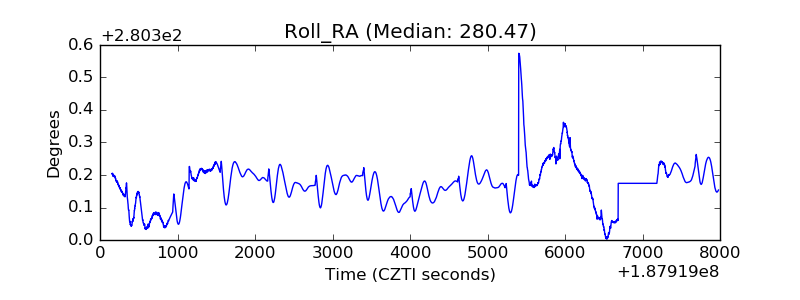 |
| Veto Counter | 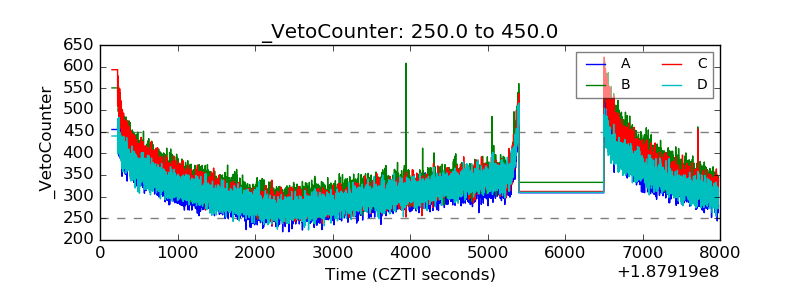 |