| Param | Original file | Final file |
|---|---|---|
| Filename | modeM0/AS1P01_997T03_9000000216_01170cztM0_level2.evt | modeM0/AS1P01_997T03_9000000216_01170cztM0_level2_quad_clean.evt |
| Size (bytes) | 901,535,040 | 60,707,520 |
| Size | 859.8 MB | 57.9 MB |
| Events in quadrant A | 5,033,634 | 433,485 |
| Events in quadrant B | 5,150,859 | 436,504 |
| Events in quadrant C | 4,911,390 | 418,789 |
| Events in quadrant D | 11,918,587 | 242,046 |
| Mode M0 | |||
|---|---|---|---|
| Quadrant | BADHDUFLAG | Total packets | Discarded packets |
| A | 0 | 18047 | 0 |
| B | 0 | 18352 | 0 |
| C | 0 | 17676 | 0 |
| D | 0 | 38895 | 0 |
| Mode SS | |||
|---|---|---|---|
| Quadrant | BADHDUFLAG | Total packets | Discarded packets |
| A | 0 | 88 | 0 |
| B | 0 | 88 | 0 |
| C | 0 | 88 | 0 |
| D | 0 | 88 | 0 |
| Mode M9 | |||
|---|---|---|---|
| Quadrant | BADHDUFLAG | Total packets | Discarded packets |
| A | 0 | 11 | 0 |
| B | 0 | 11 | 0 |
| C | 0 | 11 | 0 |
| D | 0 | 11 | 0 |
| Quadrant | Total seconds | Saturated seconds | Saturation percentage |
|---|---|---|---|
| A | 4351 | 9 | 0.206849% |
| B | 4351 | 6 | 0.137899% |
| C | 4351 | 5 | 0.114916% |
| D | 4351 | 2723 | 62.583314% |
Noise dominated data is calculated using 1-second bins in cleaned event files. If a bin has >2000 counts, and if more than 50% of those come from <1% of pixels, then it is considered to be noise-dominated and hence unusable.
| Quadrant | # 1 sec bins | Bins with >0 counts | Bins with >2000 counts | High rate bins dominated by noise | Noise dominated (total time) | Noise dominated (detector-on time) | Marked lightcurve |
|---|---|---|---|---|---|---|---|
| A | 4350 | 4350 | 93 | 93 | 2.14% | 2.14% | 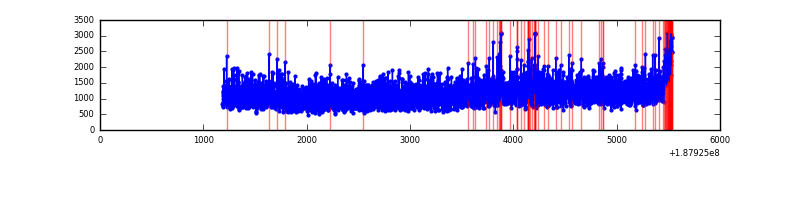 |
| B | 4350 | 4350 | 101 | 101 | 2.32% | 2.32% | 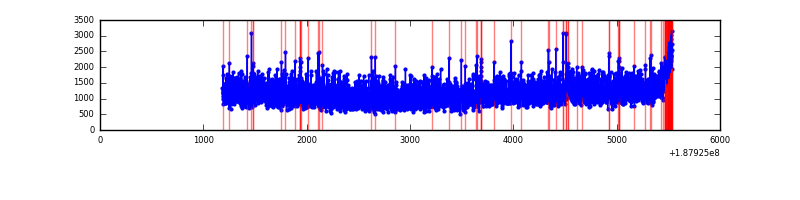 |
| C | 4350 | 4350 | 98 | 98 | 2.25% | 2.25% | 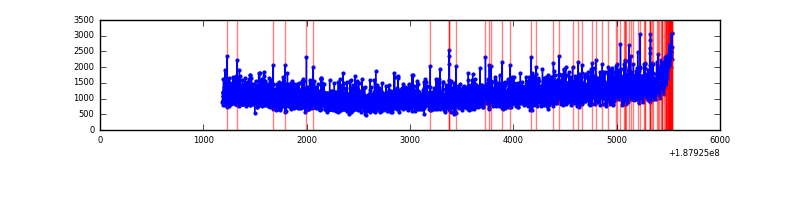 |
| D | 4351 | 4351 | 3757 | 3757 | 86.35% | 86.35% | 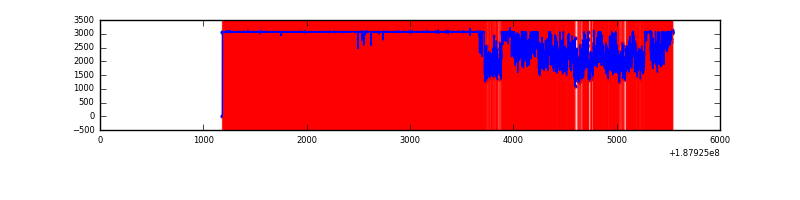 |
Top three noisy pixels from each quadrant. If the there are fewer than three noisy pixels in the level2.evt file, extra rows are filled as -1
| Pixel properties | Quadrant properties | ||||||
|---|---|---|---|---|---|---|---|
| Quadrant | DetID | PixID | Counts | Sigma | Mean | Median | Sigma |
| A | 8 | 14 | 67943 | 214.2 | 1291 | 1300 | 311.1 |
| A | 11 | 79 | 5539 | 13.62 | 1291 | 1300 | 311.1 |
| A | 3 | 111 | 4214 | 9.37 | 1291 | 1300 | 311.1 |
| B | 4 | 187 | 23650 | 71.29 | 1324 | 1329 | 313.1 |
| B | 6 | 53 | 22934 | 69.0 | 1324 | 1329 | 313.1 |
| B | 5 | 191 | 22495 | 67.6 | 1324 | 1329 | 313.1 |
| C | 15 | 241 | 207293 | 627.95 | 1180 | 1219 | 328.2 |
| C | 9 | 83 | 71362 | 213.74 | 1180 | 1219 | 328.2 |
| C | 3 | 111 | 14166 | 39.45 | 1180 | 1219 | 328.2 |
| D | 1 | 239 | 8809516 | 34583.2 | 820 | 846 | 254.7 |
| D | 2 | 16 | 15702 | 58.32 | 820 | 846 | 254.7 |
| D | 10 | 125 | 14321 | 52.9 | 820 | 846 | 254.7 |
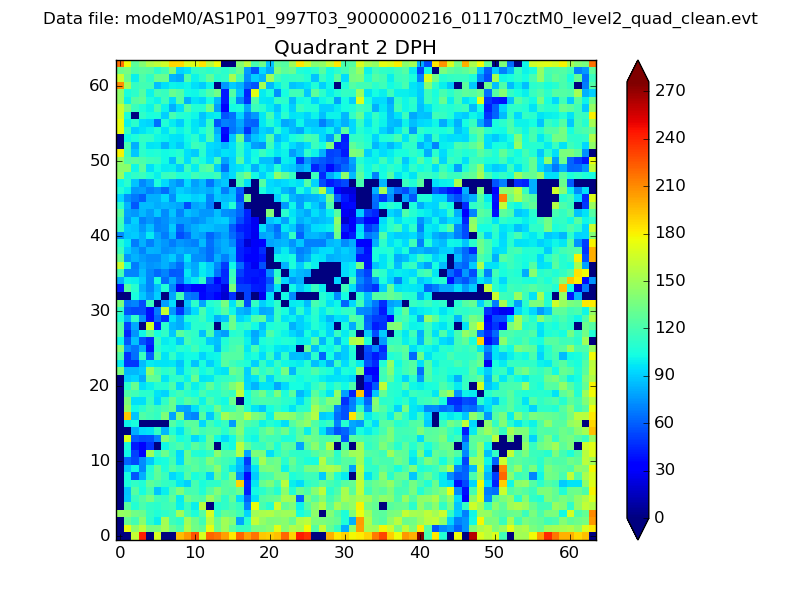
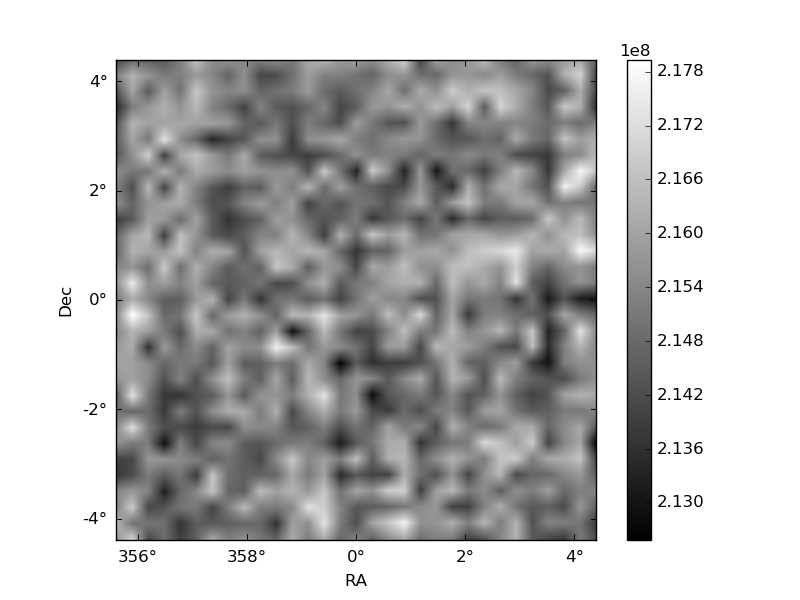
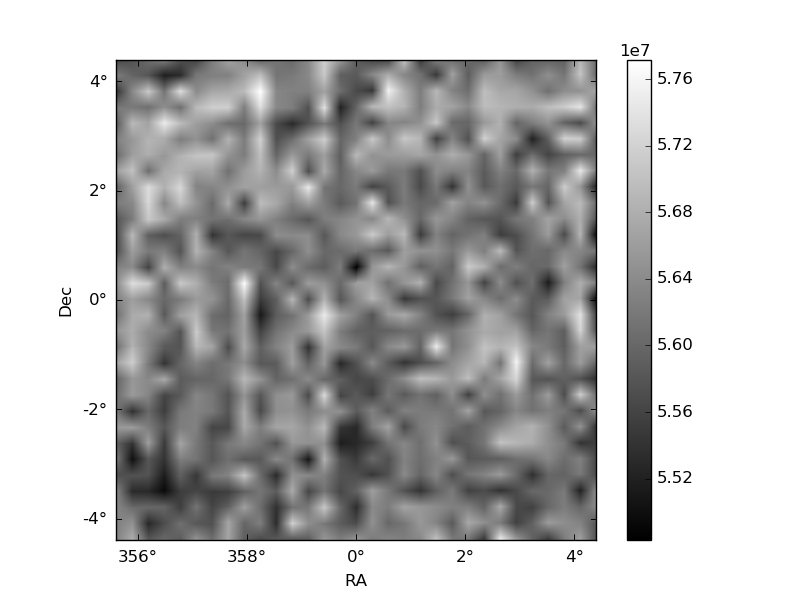
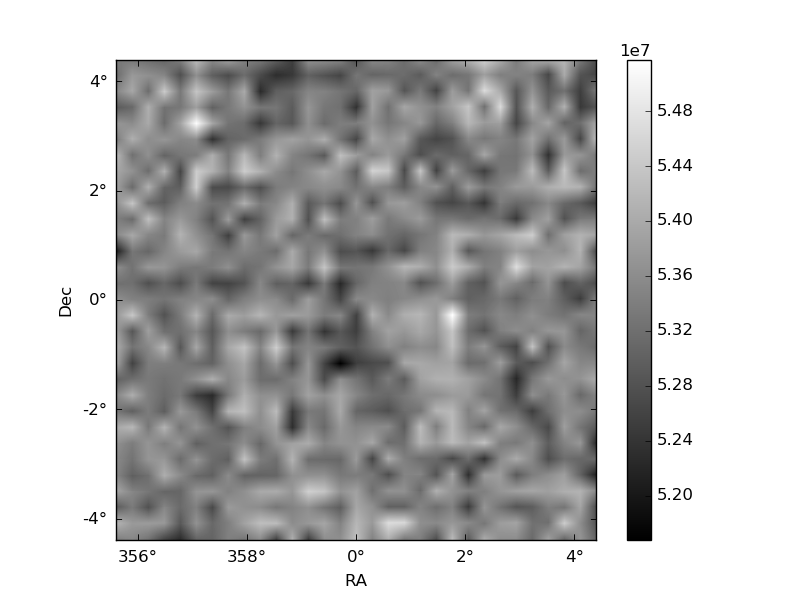
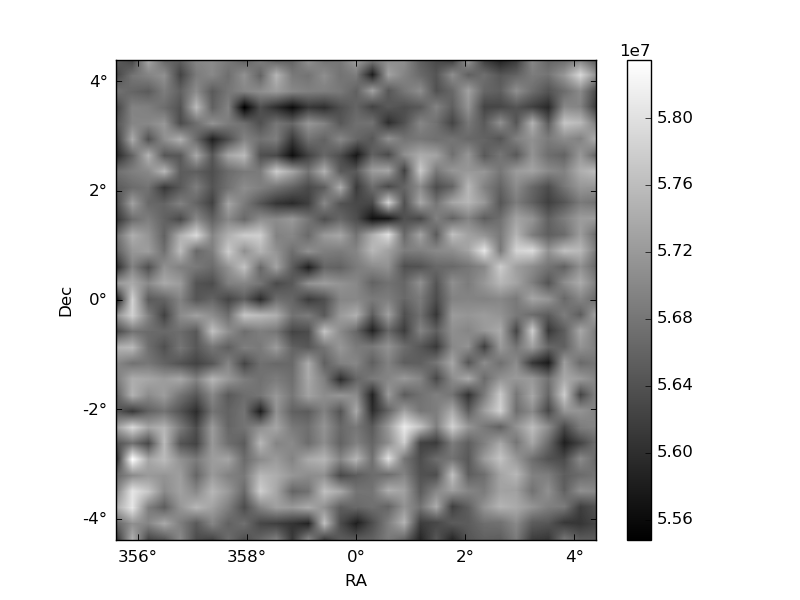
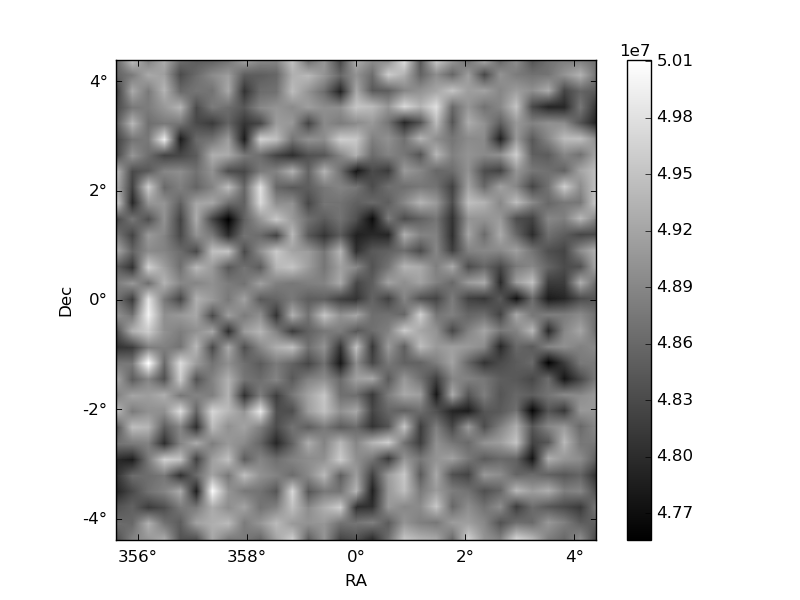
Histogram calculated using DETX and DETY for each event in the final _common_clean file
| Quadrant A | 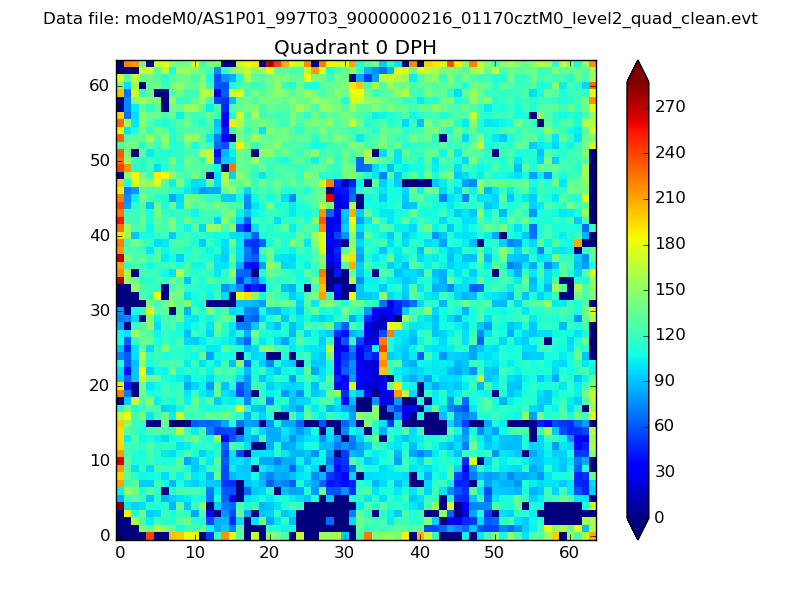 |
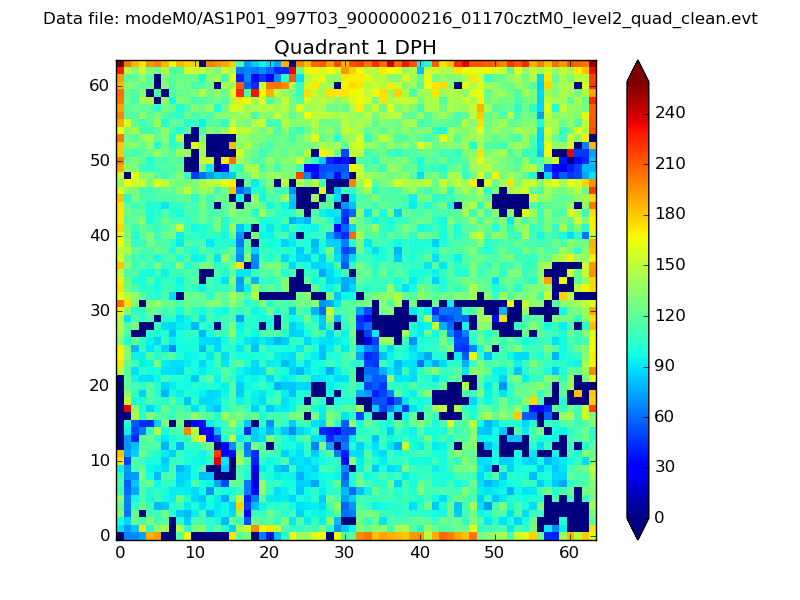 |
Quadrant B |
|---|---|---|---|
| Quadrant D | 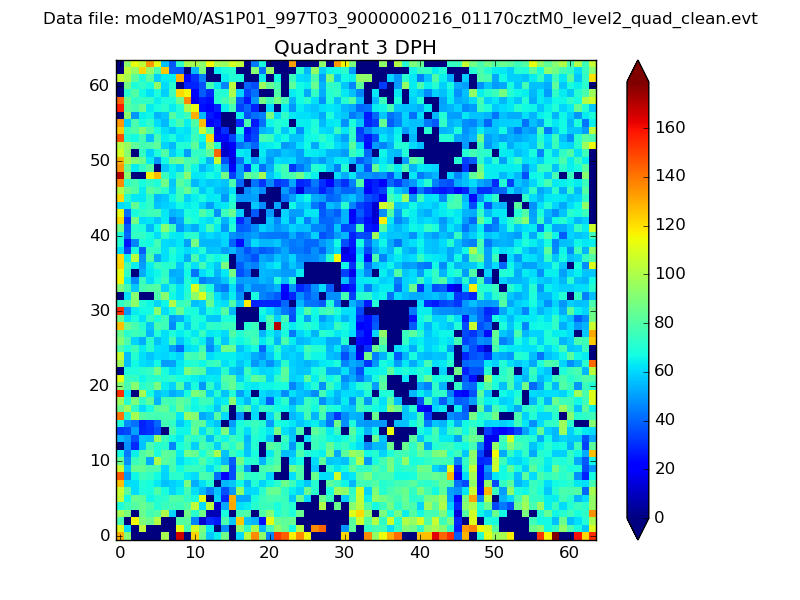 |
 |
Quadrant C |
| Plot type | Count rate plots | Images |
|---|---|---|
| Comparison with Poisson distribution Blue bars denote a histogram of data divided into 1 sec bins. Red curve is a Poisson curve with rate = median count rate of data. |
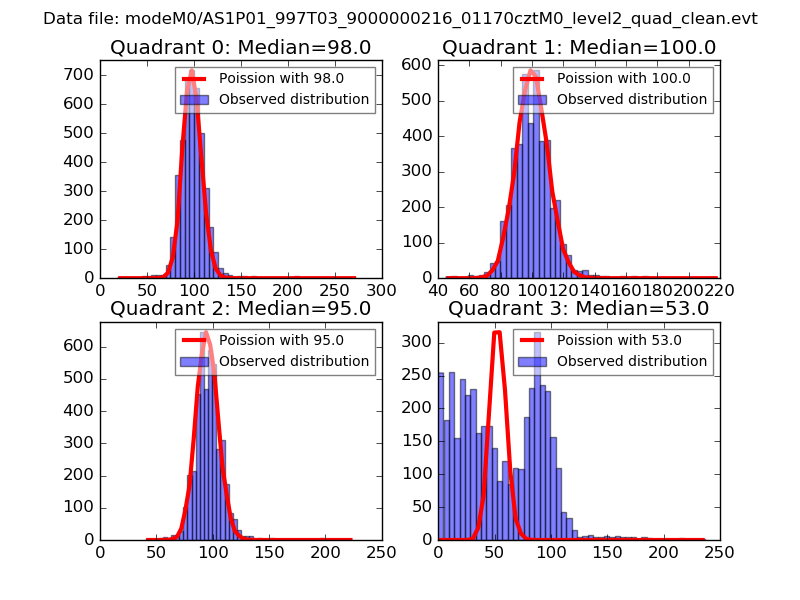 |
 |
| Quadrant-wise count rates Data is divided into 100 sec bins |
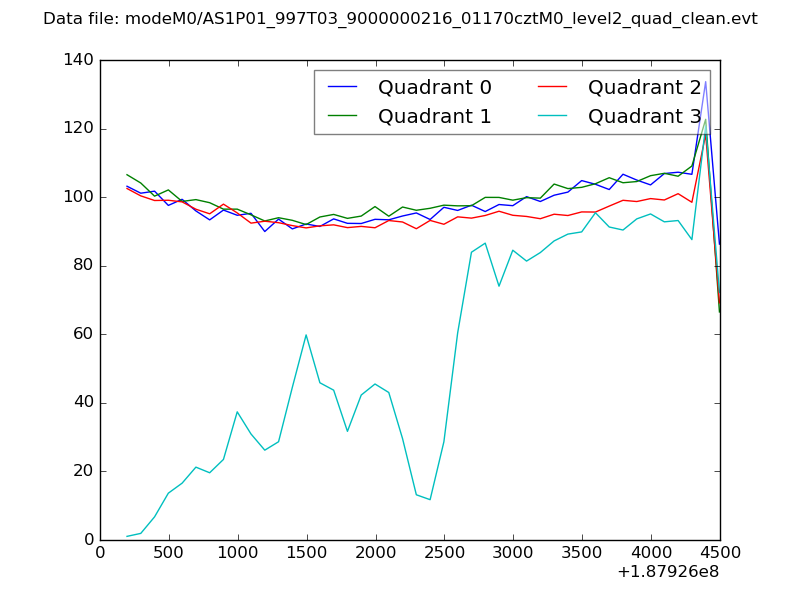 |
|
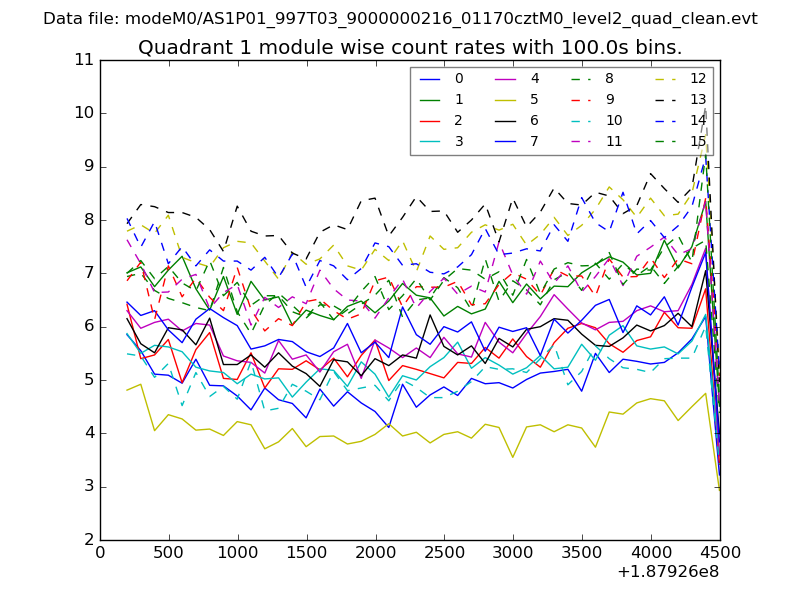
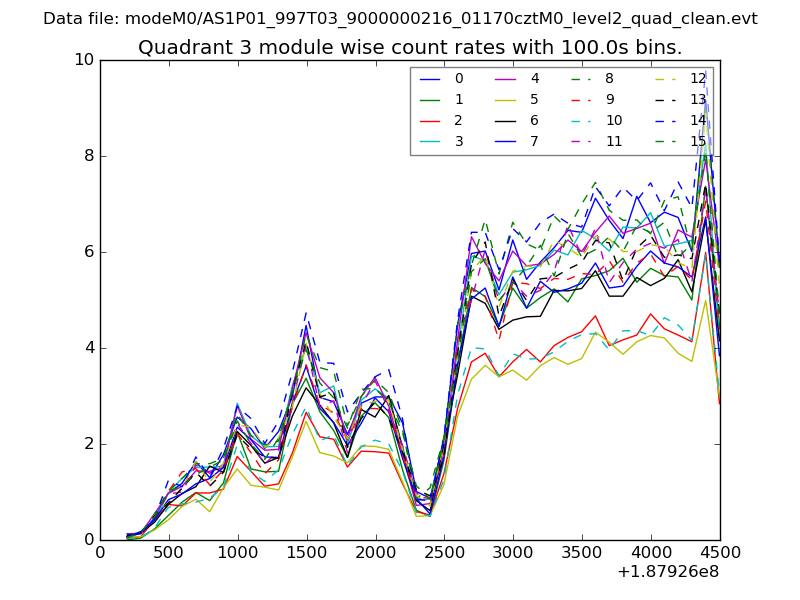
| Module-wise count rates for Quadrant A Data is divided into 100 sec bins |
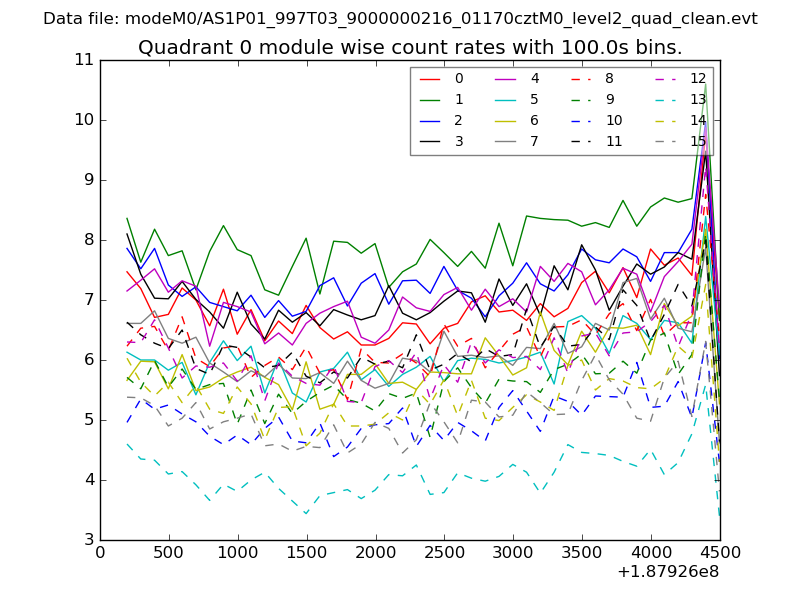 |
 |
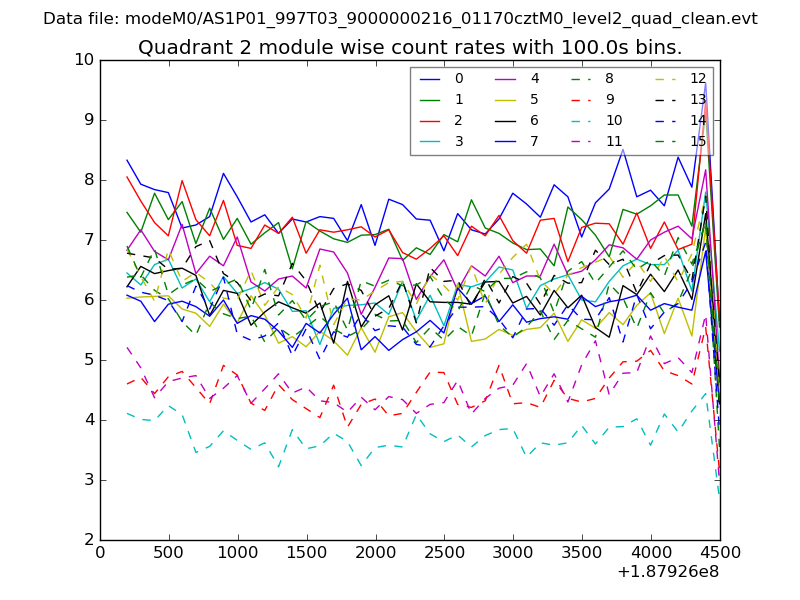
| Module-wise count rates for Quadrant B Data is divided into 100 sec bins |
 |
 |
| Module-wise count rates for Quadrant C Data is divided into 100 sec bins |
 |
 |
| Module-wise count rates for Quadrant D Data is divided into 100 sec bins |
 |
 |
| Parameter | Plot |
|---|---|
| CZT HV Monitor | 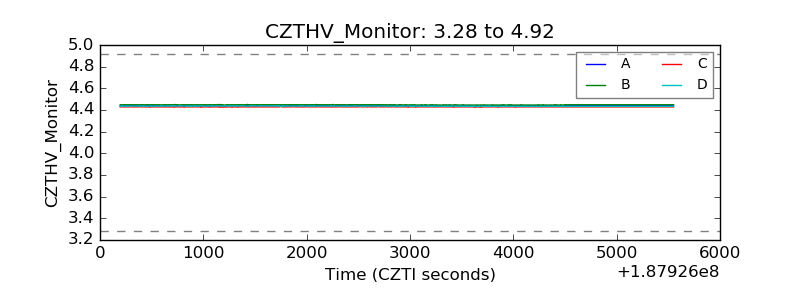 |
| D_VDD | 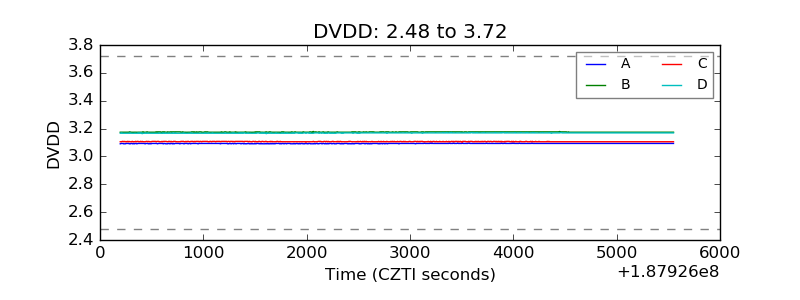 |
| Temperature 1 | 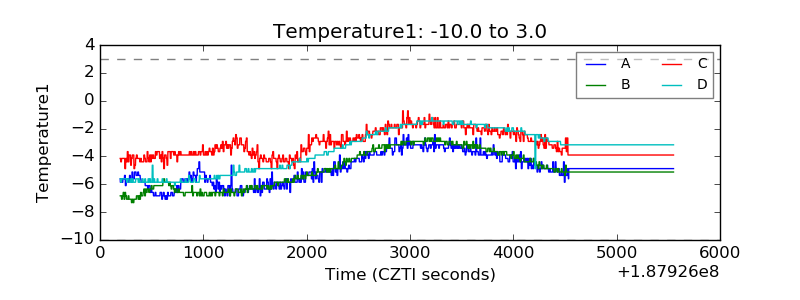 |
| Veto HV Monitor | 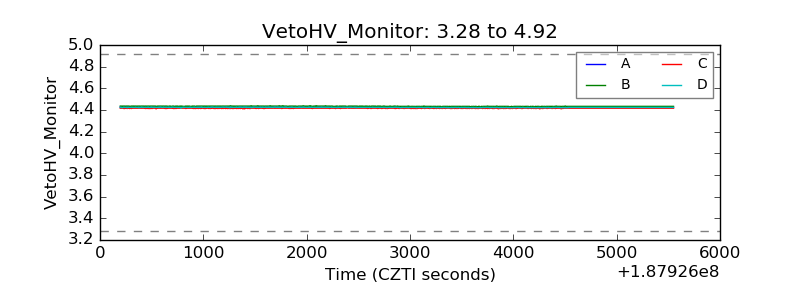 |
| Veto LLD | 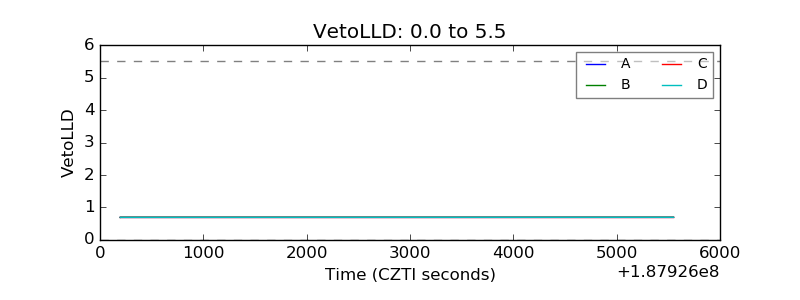 |
| Alpha Counter | 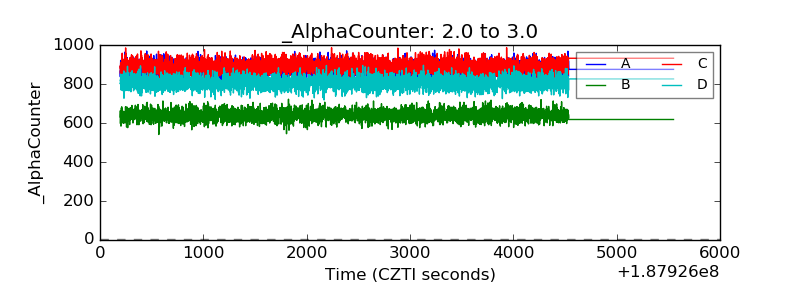 |
| _CPM_Rate | 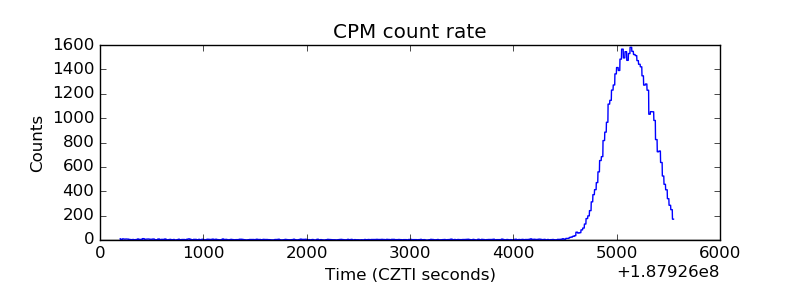 |
| CZT Counter | 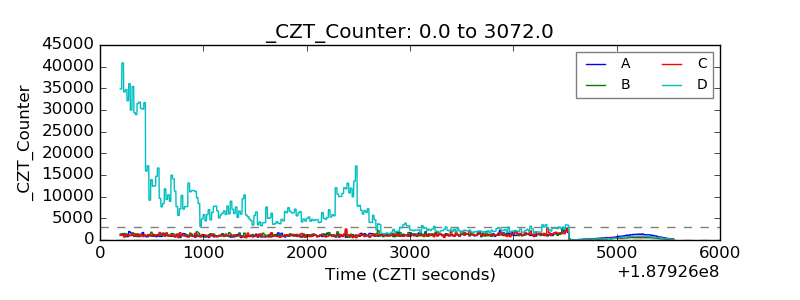 |
| +2.5 Volts monitor | 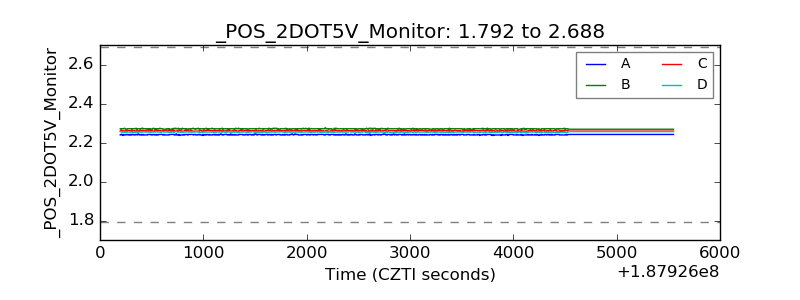 |
| +5 Volts monitor |  |
| _ROLL_ROT | 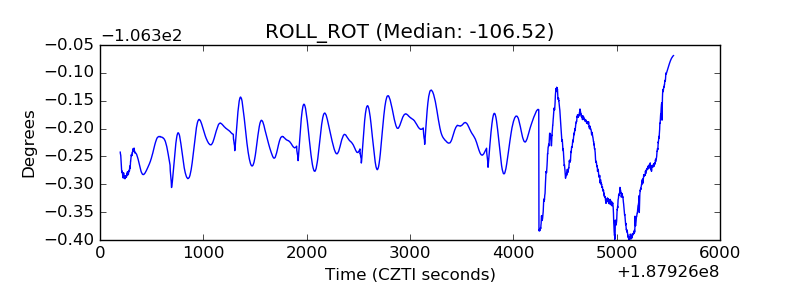 |
| _Roll_DEC | 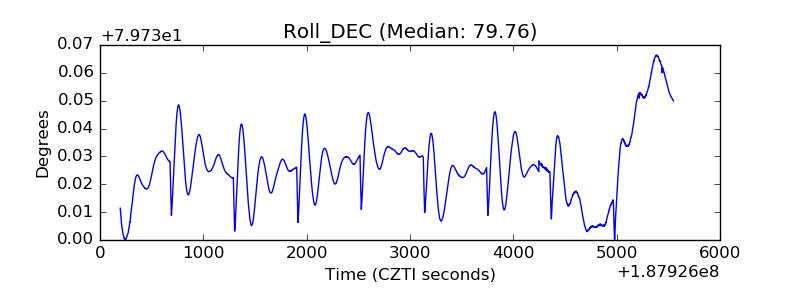 |
| _Roll_RA | 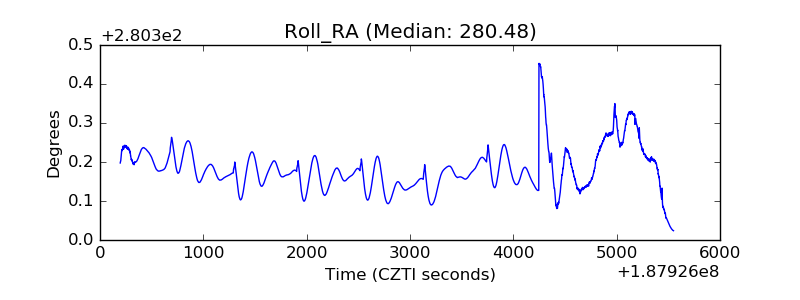 |
| Veto Counter | 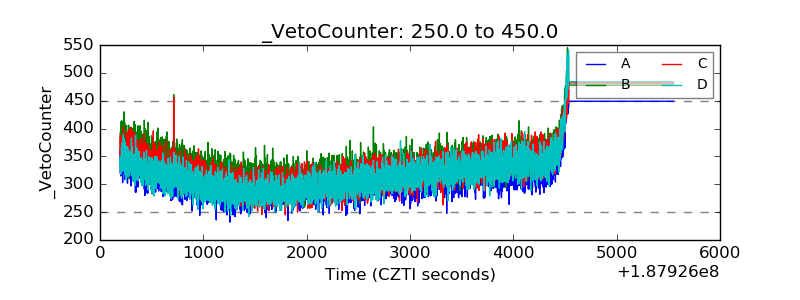 |