| Param | Original file | Final file |
|---|---|---|
| Filename | modeM0/AS1P01_997T02_9000000218cztM0_level2.fits | modeM0/AS1P01_997T02_9000000218cztM0_level2_quad_clean.evt |
| Size (bytes) | 531,221,760 | 770,463,360 |
| Size | 506.6 MB | 734.8 MB |
| Events in quadrant A | 3,158,436 | 5,425,860 |
| Events in quadrant B | 3,081,514 | 5,339,860 |
| Events in quadrant C | 3,058,710 | 5,084,497 |
| Events in quadrant D | 2,181,872 | 2,891,654 |
| Mode M9 | |||
|---|---|---|---|
| Quadrant | BADHDUFLAG | Total packets | Discarded packets |
| A | 0 | 77 | 0 |
| B | 0 | 77 | 0 |
| C | 0 | 77 | 0 |
| D | 0 | 77 | 0 |
| Mode M0 | |||
|---|---|---|---|
| Quadrant | BADHDUFLAG | Total packets | Discarded packets |
| A | 0 | 286453 | 0 |
| B | 0 | 308448 | 0 |
| C | 0 | 287225 | 0 |
| D | 0 | 488265 | 0 |
| Mode SS | |||
|---|---|---|---|
| Quadrant | BADHDUFLAG | Total packets | Discarded packets |
| A | 0 | 1360 | 0 |
| B | 0 | 1360 | 0 |
| C | 0 | 1360 | 0 |
| D | 0 | 1360 | 0 |
| Quadrant | Total seconds | Saturated seconds | Saturation percentage |
|---|---|---|---|
| A | 66986 | 446 | 0.665811% |
| B | 66984 | 1468 | 2.191568% |
| C | 66987 | 273 | 0.407542% |
| D | 66981 | 26643 | 39.776952% |
Noise dominated data is calculated using 1-second bins in cleaned event files. If a bin has >2000 counts, and if more than 50% of those come from <1% of pixels, then it is considered to be noise-dominated and hence unusable.
| Quadrant | # 1 sec bins | Bins with >0 counts | Bins with >2000 counts | High rate bins dominated by noise | Noise dominated (total time) | Noise dominated (detector-on time) | Marked lightcurve |
|---|---|---|---|---|---|---|---|
| A | 82330 | 66971 | 0 | 0 | 0.00% | 0.00% | 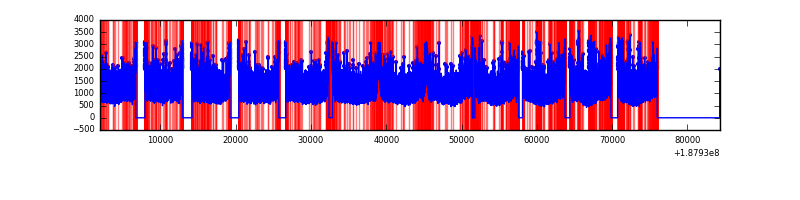 |
| B | 82330 | 66944 | 0 | 0 | 0.00% | 0.00% |  |
| C | 82330 | 66978 | 0 | 0 | 0.00% | 0.00% |  |
| D | 82330 | 66778 | 0 | 0 | 0.00% | 0.00% |  |
Top three noisy pixels from each quadrant. If the there are fewer than three noisy pixels in the level2.evt file, extra rows are filled as -1
| Pixel properties | Quadrant properties | ||||||
|---|---|---|---|---|---|---|---|
| Quadrant | DetID | PixID | Counts | Sigma | Mean | Median | Sigma |
| A | 0 | 29 | 3023 | 11.98 | 818 | 764 | 188.5 |
| A | 7 | 110 | 2889 | 11.27 | 818 | 764 | 188.5 |
| A | 14 | 188 | 2364 | 8.49 | 818 | 764 | 188.5 |
| B | 2 | 9 | 2435 | 11.37 | 814 | 776 | 145.9 |
| B | 14 | 254 | 2095 | 9.04 | 814 | 776 | 145.9 |
| B | 5 | 128 | 2062 | 8.81 | 814 | 776 | 145.9 |
| C | 12 | 241 | 2179 | 7.28 | 808 | 747 | 196.6 |
| C | 2 | 191 | 2048 | 6.62 | 808 | 747 | 196.6 |
| C | 9 | 242 | 1960 | 6.17 | 808 | 747 | 196.6 |
| D | 1 | 19 | 1577 | 6.78 | 622 | 571 | 148.4 |
| D | 11 | 82 | 1569 | 6.73 | 622 | 571 | 148.4 |
| D | 6 | 231 | 1545 | 6.57 | 622 | 571 | 148.4 |
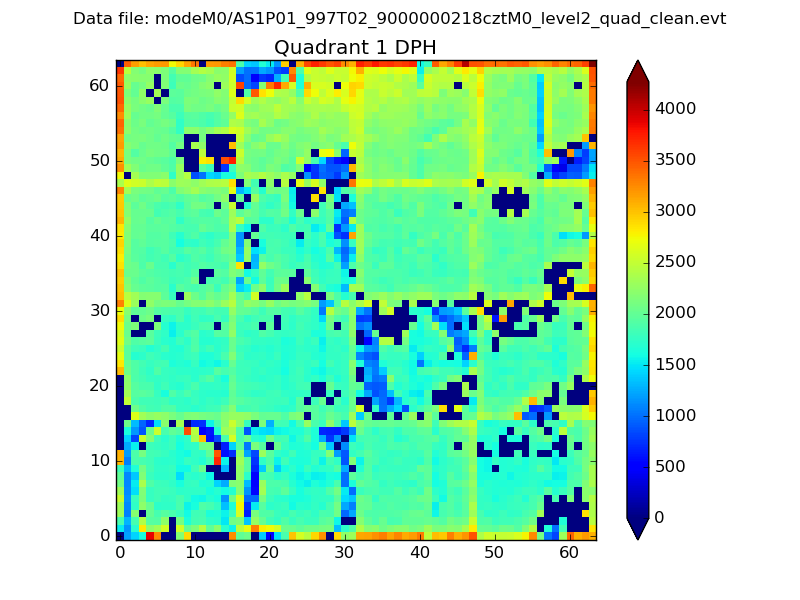
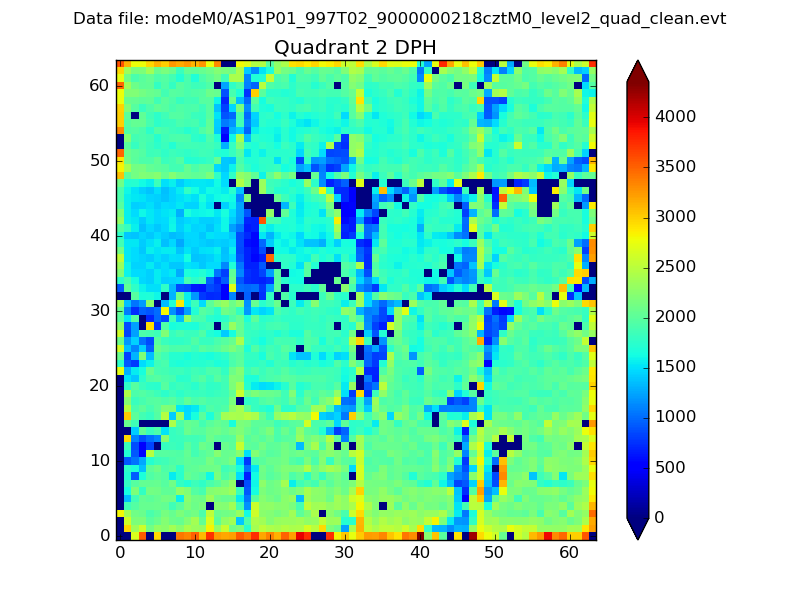
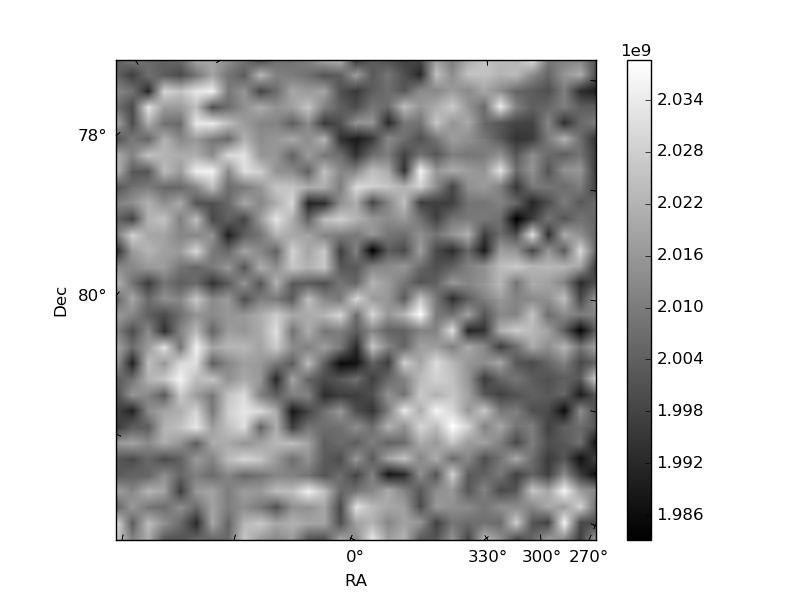
Histogram calculated using DETX and DETY for each event in the final _common_clean file
| Quadrant A |  |
 |
Quadrant B |
|---|---|---|---|
| Quadrant D |  |
 |
Quadrant C |
| Plot type | Count rate plots | Images |
|---|---|---|
| Comparison with Poisson distribution Blue bars denote a histogram of data divided into 1 sec bins. Red curve is a Poisson curve with rate = median count rate of data. |
 |
 |
| Quadrant-wise count rates Data is divided into 100 sec bins |
 |
|
| Module-wise count rates for Quadrant A Data is divided into 100 sec bins |
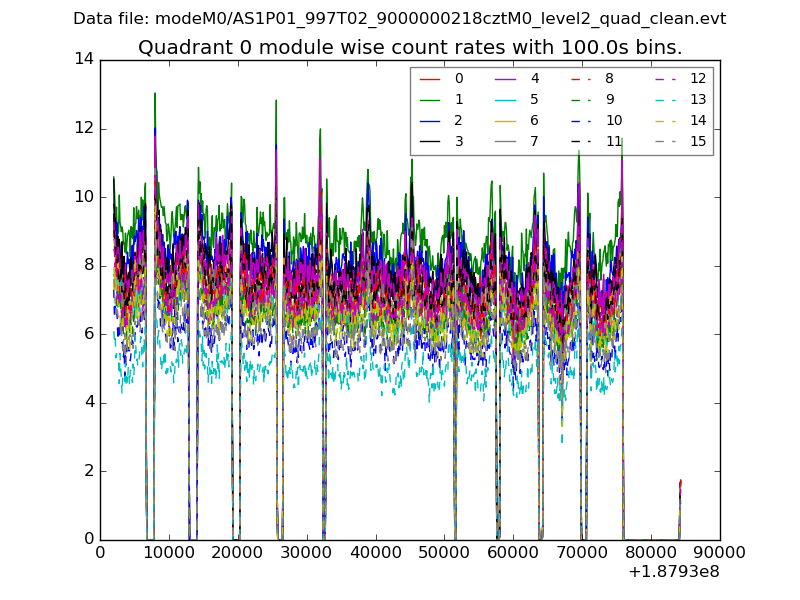 |
 |
| Module-wise count rates for Quadrant B Data is divided into 100 sec bins |
 |
 |
| Module-wise count rates for Quadrant C Data is divided into 100 sec bins |
 |
 |
| Module-wise count rates for Quadrant D Data is divided into 100 sec bins |
 |
 |
| Parameter | Plot |
|---|---|
| CZT HV Monitor |  |
| D_VDD | 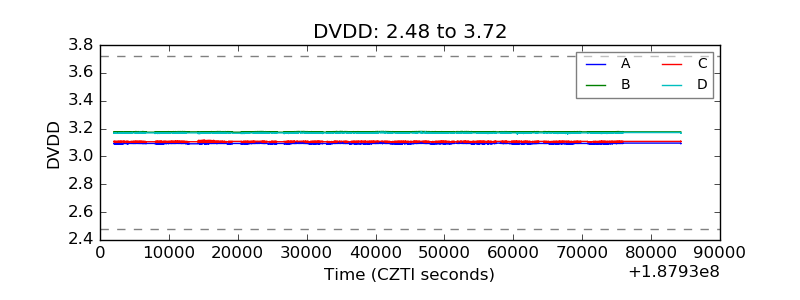 |
| Temperature 1 |  |
| Veto HV Monitor |  |
| Veto LLD | 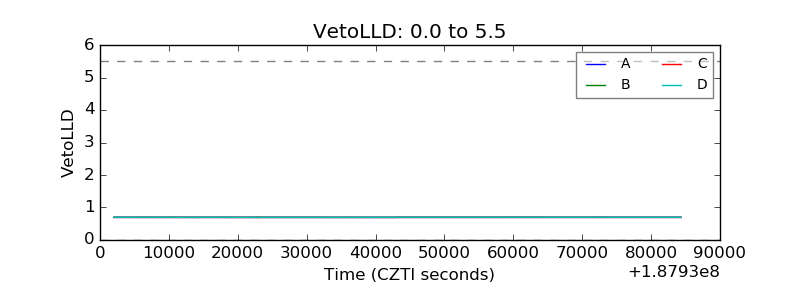 |
| Alpha Counter |  |
| _CPM_Rate |  |
| CZT Counter | 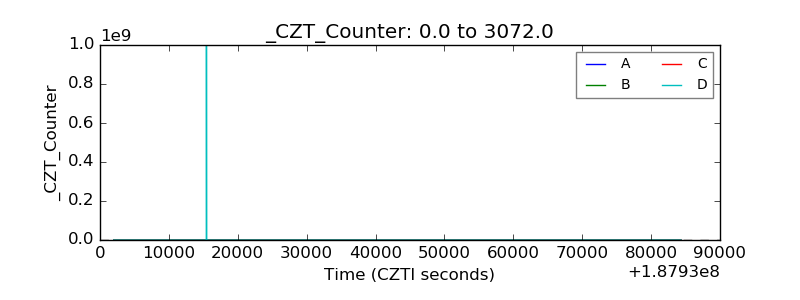 |
| +2.5 Volts monitor |  |
| +5 Volts monitor |  |
| _ROLL_ROT |  |
| _Roll_DEC |  |
| _Roll_RA |  |
| Veto Counter |  |