| Param | Original file | Final file |
|---|---|---|
| Filename | modeM0/AS1P01_997T02_9000000218_01170cztM0_level2.evt | modeM0/AS1P01_997T02_9000000218_01170cztM0_level2_quad_clean.evt |
| Size (bytes) | 272,980,800 | 19,661,760 |
| Size | 260.3 MB | 18.8 MB |
| Events in quadrant A | 1,381,826 | 132,170 |
| Events in quadrant B | 1,549,198 | 134,435 |
| Events in quadrant C | 1,868,988 | 127,187 |
| Events in quadrant D | 3,382,984 | 107,622 |
| Mode M0 | |||
|---|---|---|---|
| Quadrant | BADHDUFLAG | Total packets | Discarded packets |
| A | 0 | 5009 | 1 |
| B | 0 | 5504 | 0 |
| C | 0 | 6427 | 0 |
| D | 0 | 10961 | 0 |
| Mode SS | |||
|---|---|---|---|
| Quadrant | BADHDUFLAG | Total packets | Discarded packets |
| A | 0 | 24 | 0 |
| B | 0 | 24 | 0 |
| C | 0 | 24 | 0 |
| D | 0 | 24 | 0 |
| Quadrant | Total seconds | Saturated seconds | Saturation percentage |
|---|---|---|---|
| A | 1239 | 1 | 0.080710% |
| B | 1239 | 4 | 0.322841% |
| C | 1239 | 56 | 4.519774% |
| D | 1239 | 476 | 38.418079% |
Noise dominated data is calculated using 1-second bins in cleaned event files. If a bin has >2000 counts, and if more than 50% of those come from <1% of pixels, then it is considered to be noise-dominated and hence unusable.
| Quadrant | # 1 sec bins | Bins with >0 counts | Bins with >2000 counts | High rate bins dominated by noise | Noise dominated (total time) | Noise dominated (detector-on time) | Marked lightcurve |
|---|---|---|---|---|---|---|---|
| A | 1239 | 1239 | 18 | 18 | 1.45% | 1.45% | 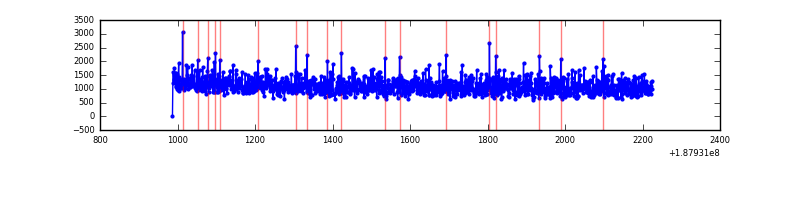 |
| B | 1238 | 1238 | 29 | 29 | 2.34% | 2.34% | 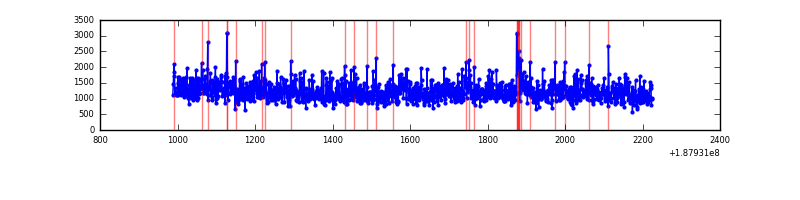 |
| C | 1239 | 1239 | 220 | 220 | 17.76% | 17.76% | 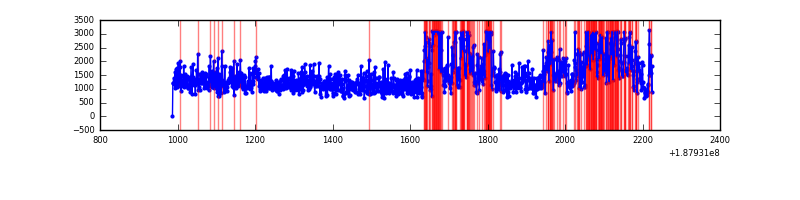 |
| D | 1239 | 1239 | 1165 | 1165 | 94.03% | 94.03% | 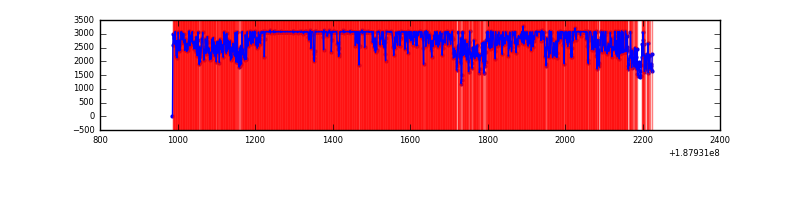 |
Top three noisy pixels from each quadrant. If the there are fewer than three noisy pixels in the level2.evt file, extra rows are filled as -1
| Pixel properties | Quadrant properties | ||||||
|---|---|---|---|---|---|---|---|
| Quadrant | DetID | PixID | Counts | Sigma | Mean | Median | Sigma |
| A | 13 | 9 | 1930 | 17.95 | 359 | 363 | 87.3 |
| A | 11 | 79 | 1818 | 16.67 | 359 | 363 | 87.3 |
| A | 3 | 111 | 1283 | 10.54 | 359 | 363 | 87.3 |
| B | 6 | 53 | 34137 | 369.81 | 389 | 393 | 91.2 |
| B | 2 | 32 | 16586 | 177.46 | 389 | 393 | 91.2 |
| B | 5 | 191 | 8715 | 91.2 | 389 | 393 | 91.2 |
| C | 9 | 83 | 506720 | 5466.67 | 332 | 343 | 92.6 |
| C | 15 | 241 | 59008 | 633.33 | 332 | 343 | 92.6 |
| C | 3 | 111 | 3102 | 29.79 | 332 | 343 | 92.6 |
| D | 1 | 239 | 2274432 | 24504.11 | 293 | 299 | 92.8 |
| D | 10 | 125 | 4723 | 47.67 | 293 | 299 | 92.8 |
| D | 2 | 170 | 4005 | 39.93 | 293 | 299 | 92.8 |
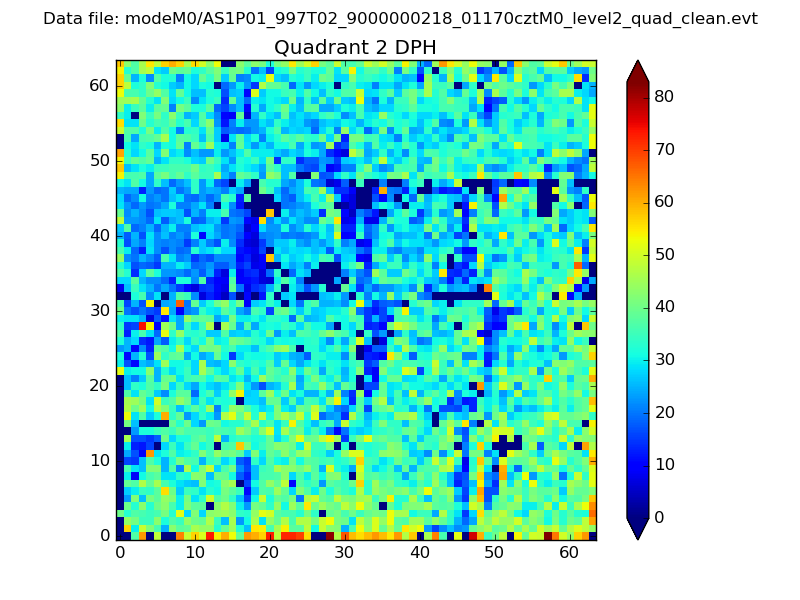
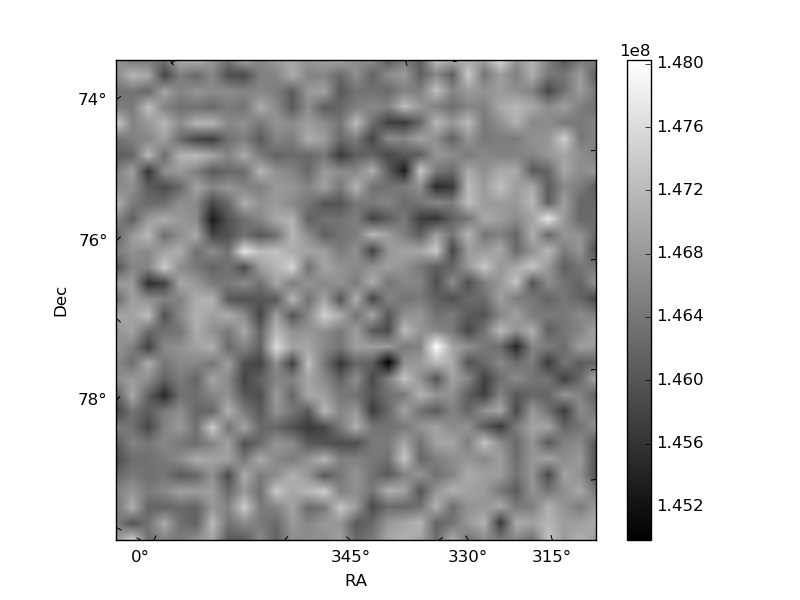
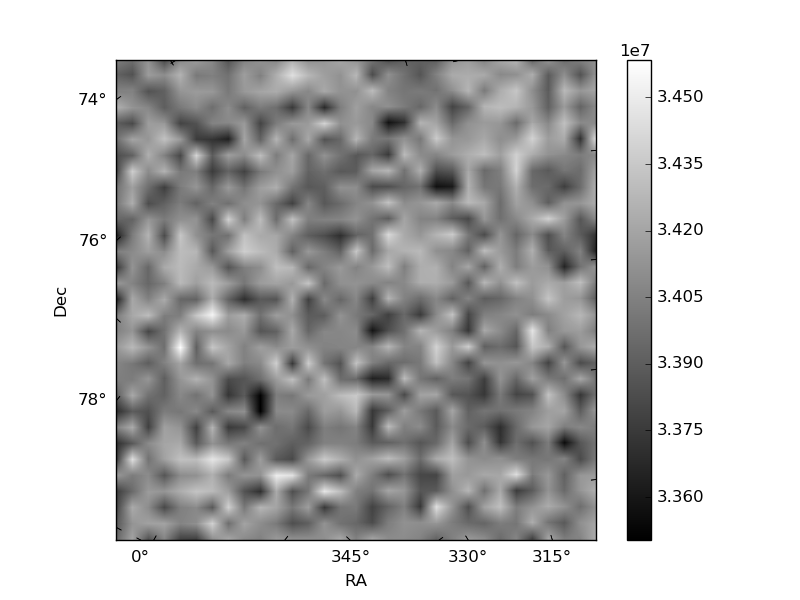
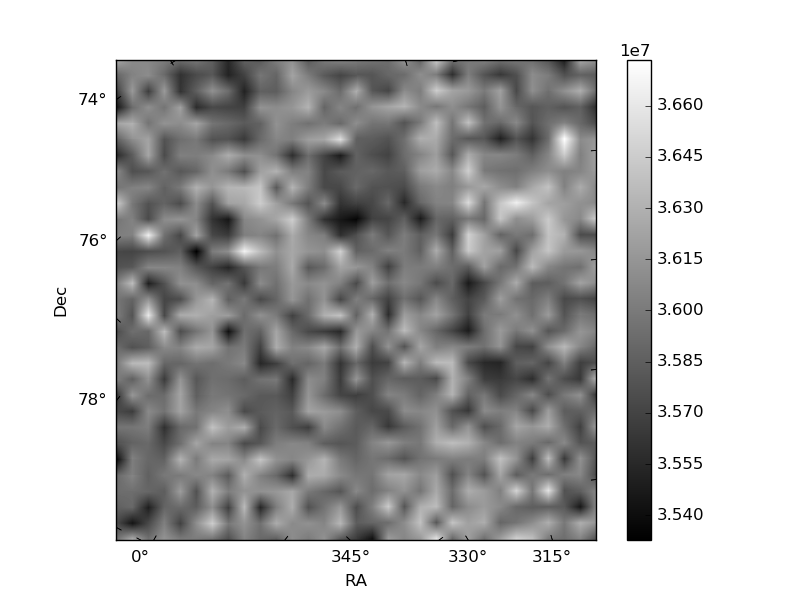
Histogram calculated using DETX and DETY for each event in the final _common_clean file
| Quadrant A | 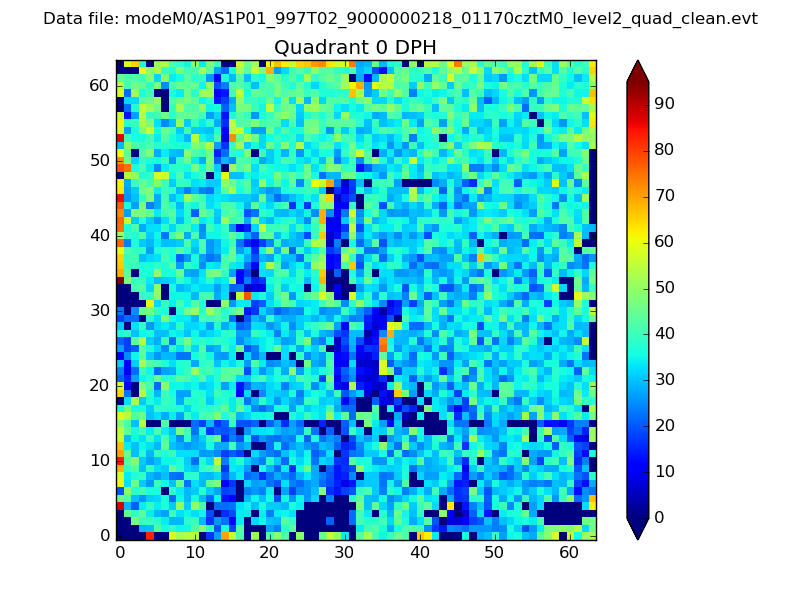 |
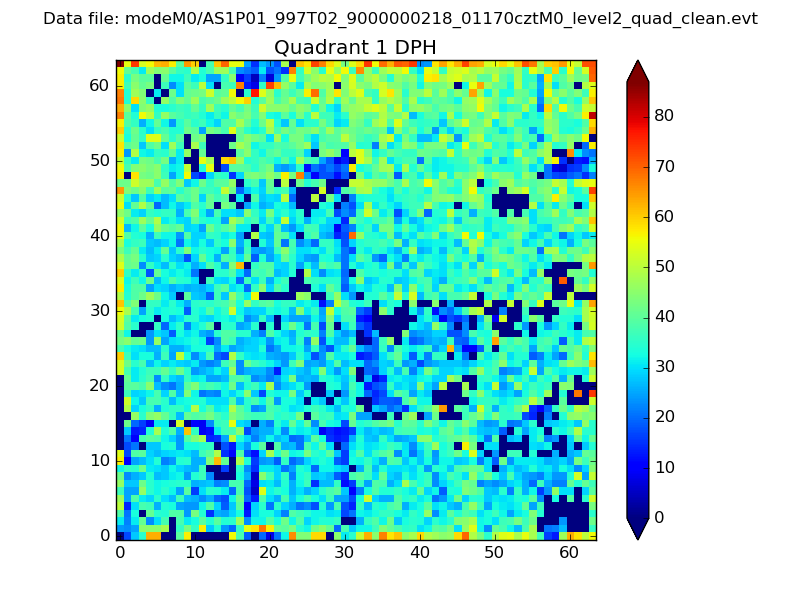 |
Quadrant B |
|---|---|---|---|
| Quadrant D | 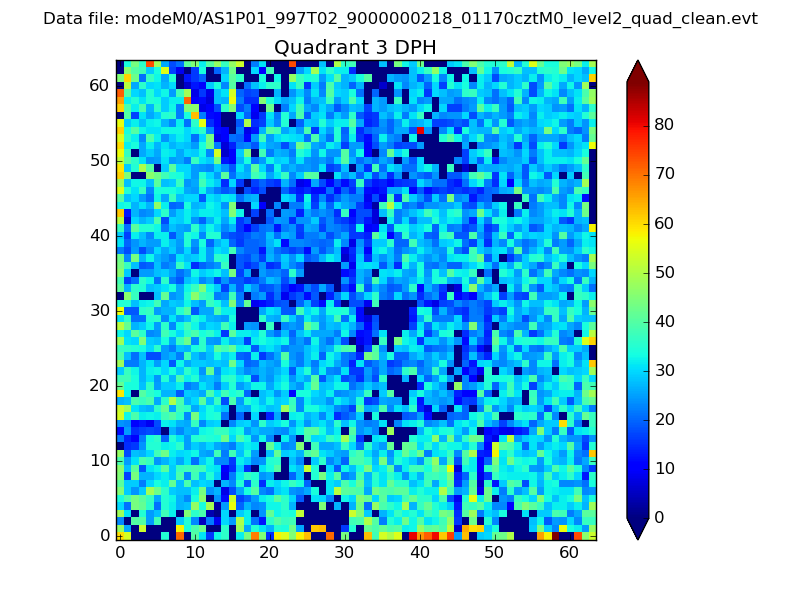 |
 |
Quadrant C |
| Plot type | Count rate plots | Images |
|---|---|---|
| Comparison with Poisson distribution Blue bars denote a histogram of data divided into 1 sec bins. Red curve is a Poisson curve with rate = median count rate of data. |
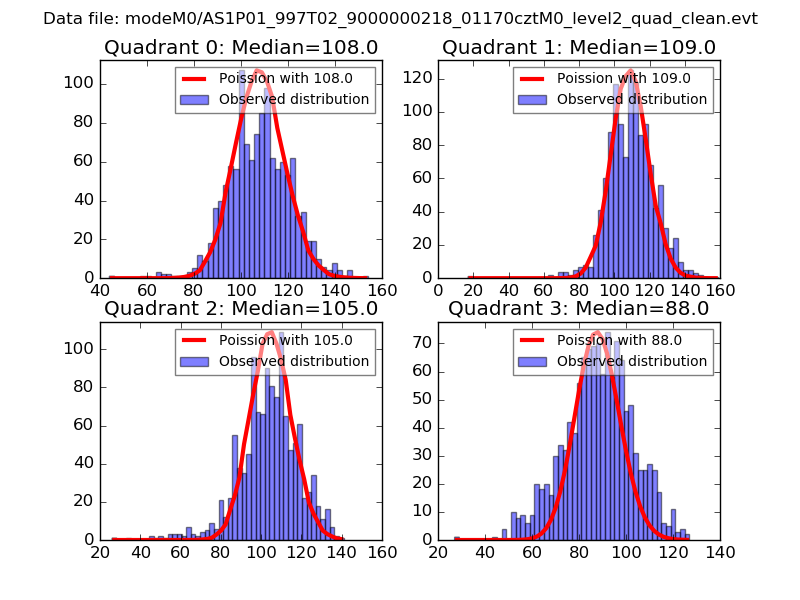 |
 |
| Quadrant-wise count rates Data is divided into 100 sec bins |
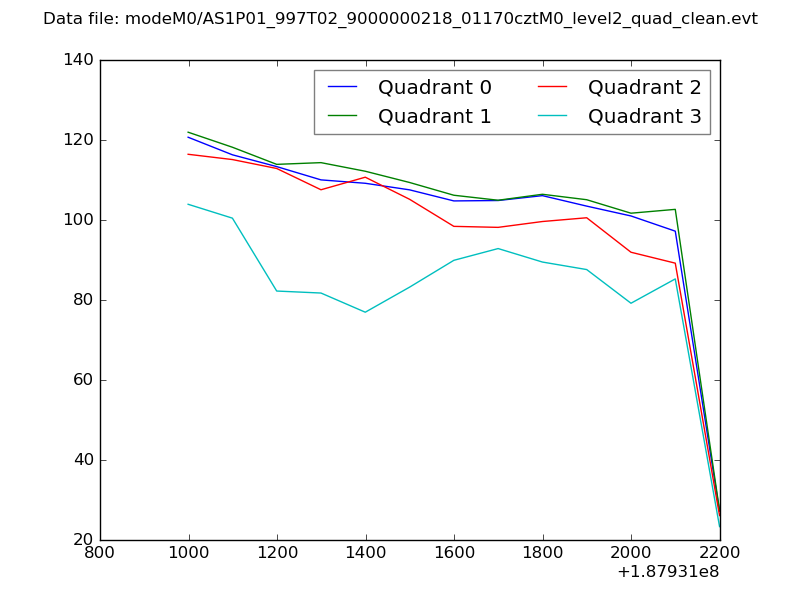 |
|
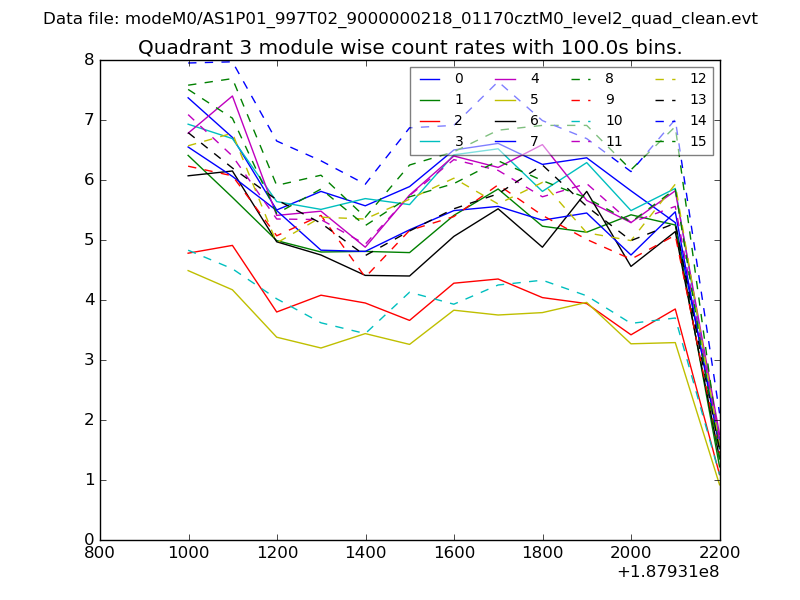
| Module-wise count rates for Quadrant A Data is divided into 100 sec bins |
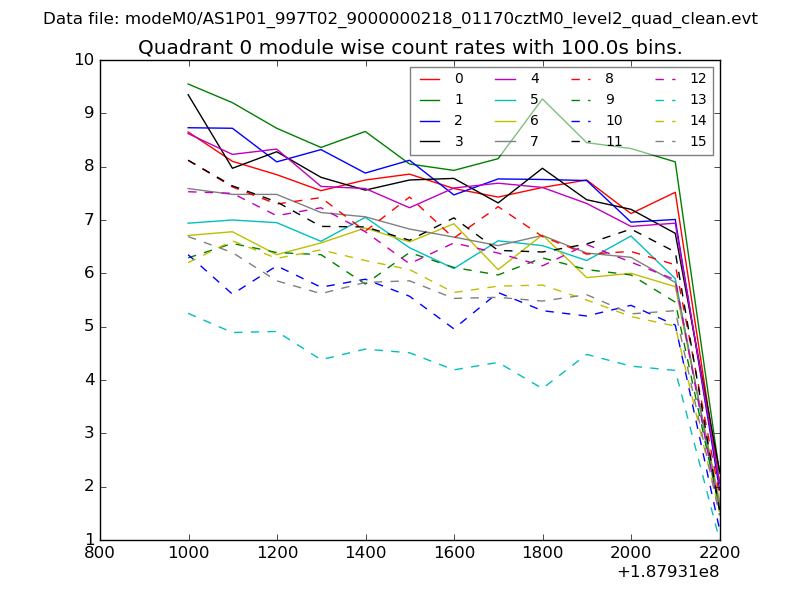 |
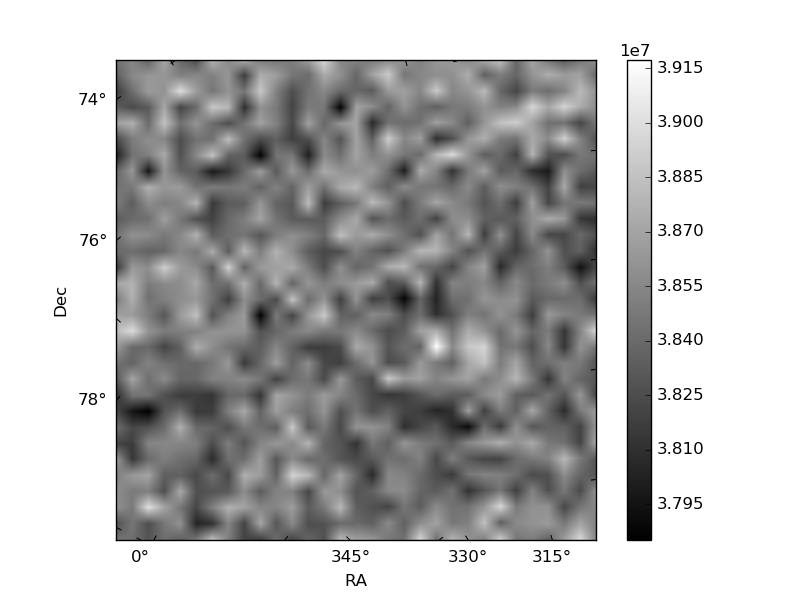 |
| Module-wise count rates for Quadrant B Data is divided into 100 sec bins |
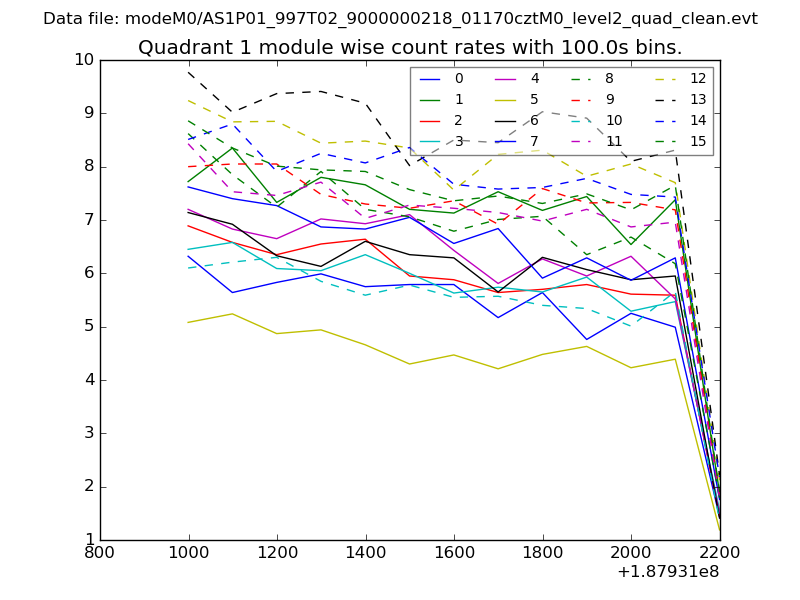 |
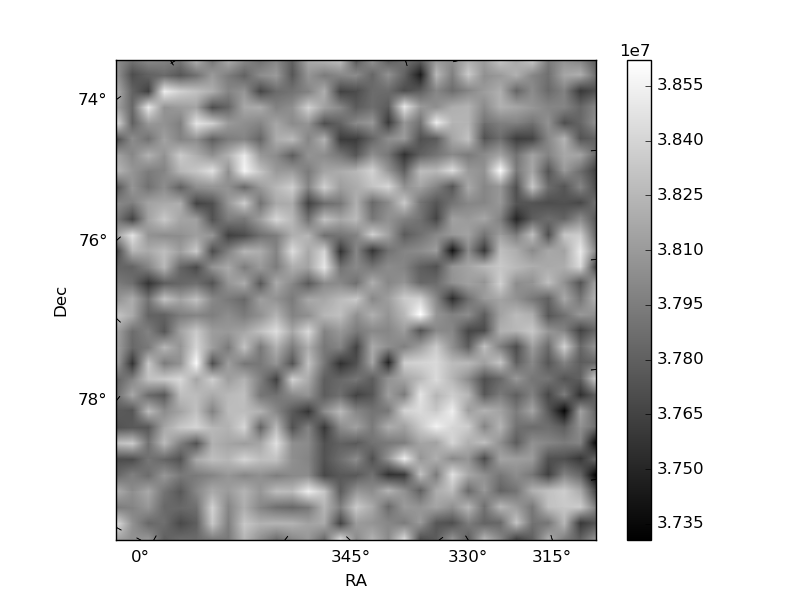 |
| Module-wise count rates for Quadrant C Data is divided into 100 sec bins |
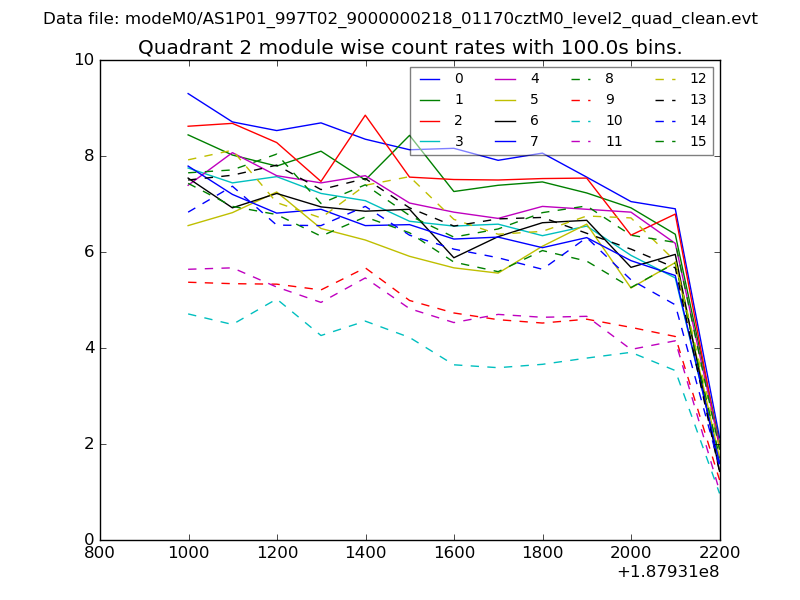 |
 |
| Module-wise count rates for Quadrant D Data is divided into 100 sec bins |
 |
 |
| Parameter | Plot |
|---|---|
| CZT HV Monitor | 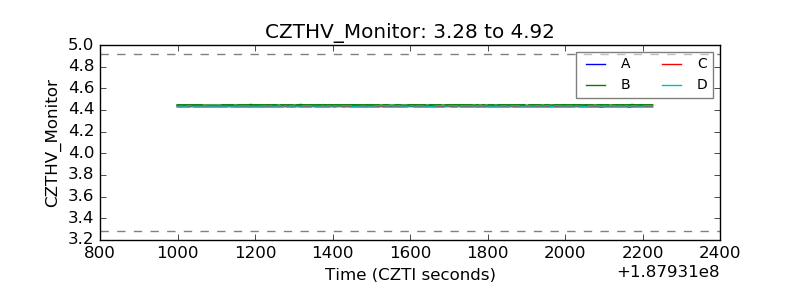 |
| D_VDD | 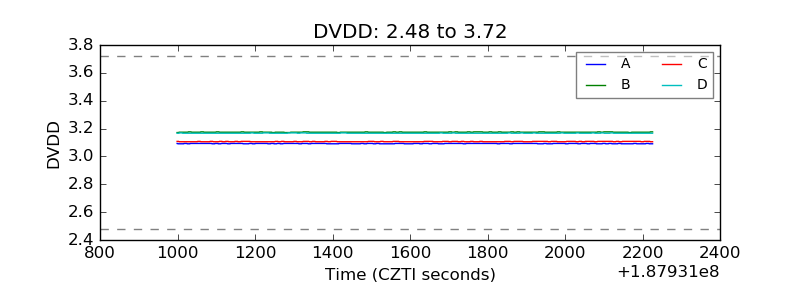 |
| Temperature 1 | 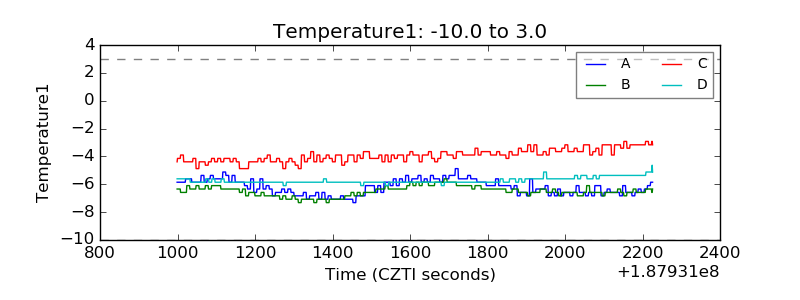 |
| Veto HV Monitor | 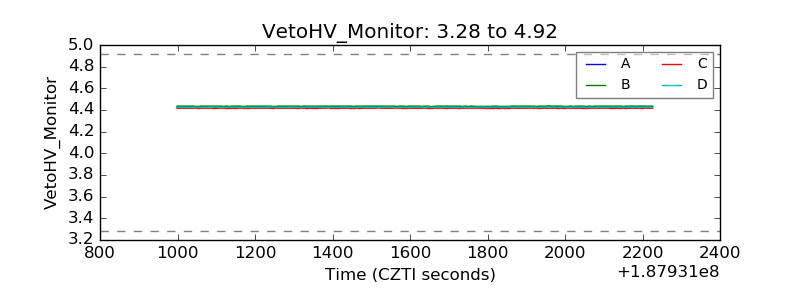 |
| Veto LLD | 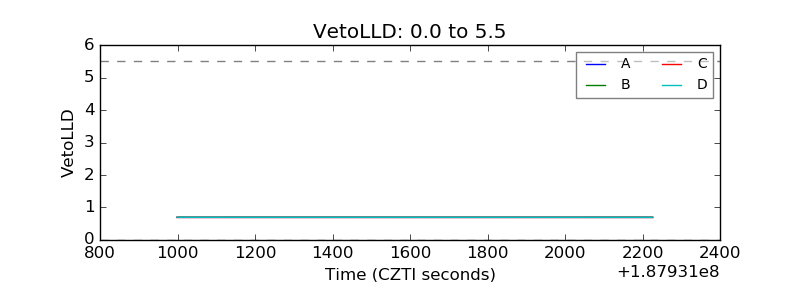 |
| Alpha Counter | 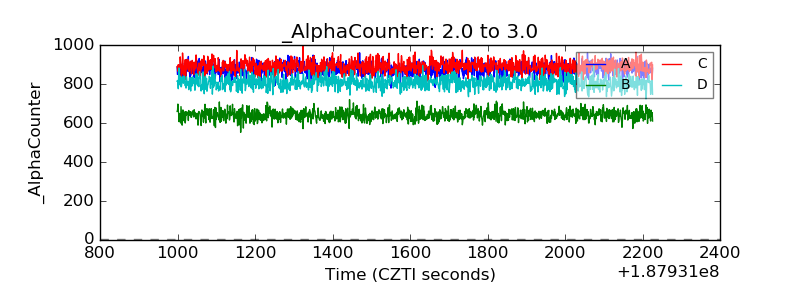 |
| _CPM_Rate | 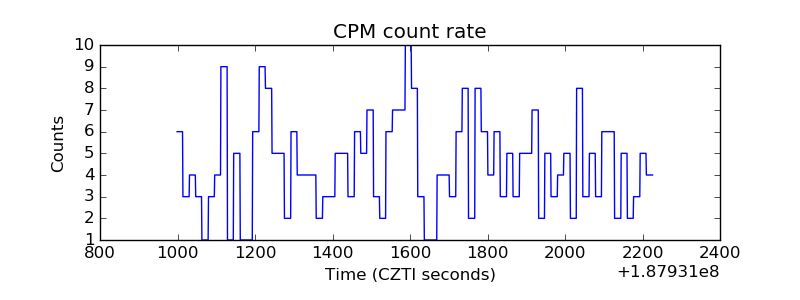 |
| CZT Counter | 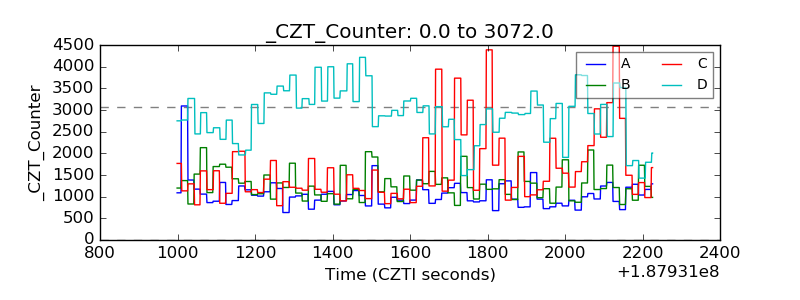 |
| +2.5 Volts monitor | 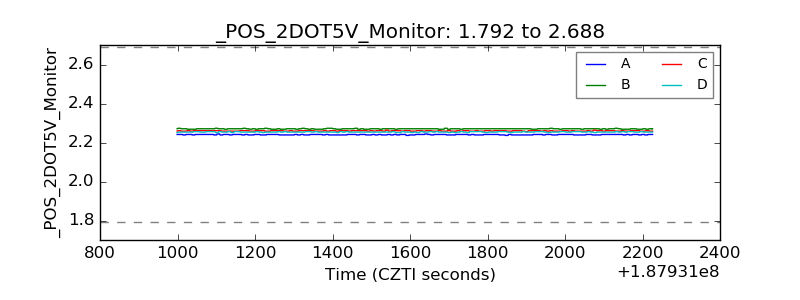 |
| +5 Volts monitor | 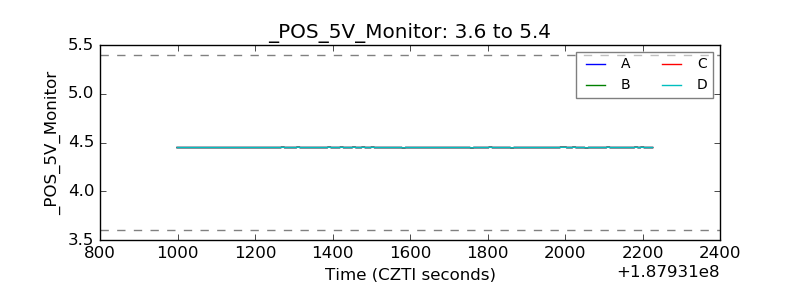 |
| _ROLL_ROT | 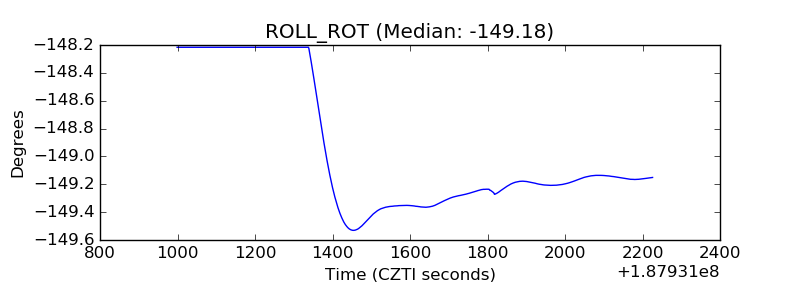 |
| _Roll_DEC | 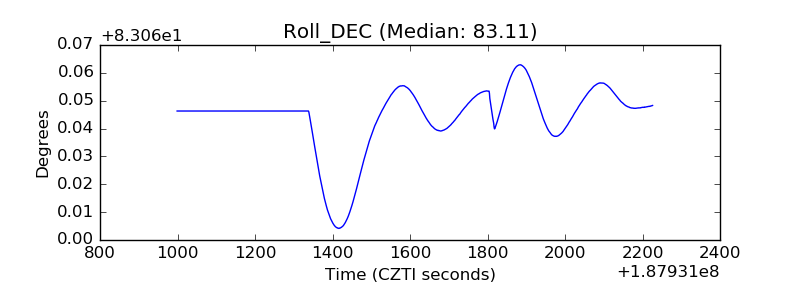 |
| _Roll_RA | 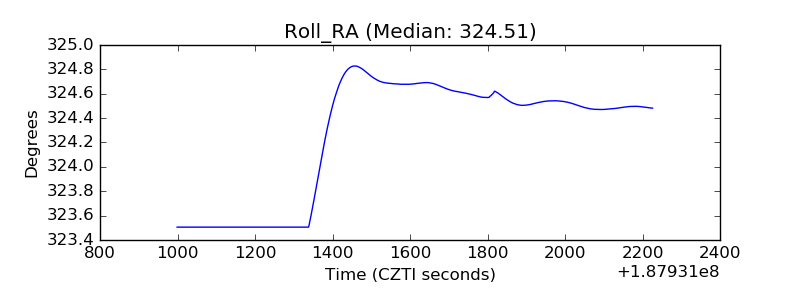 |
| Veto Counter | 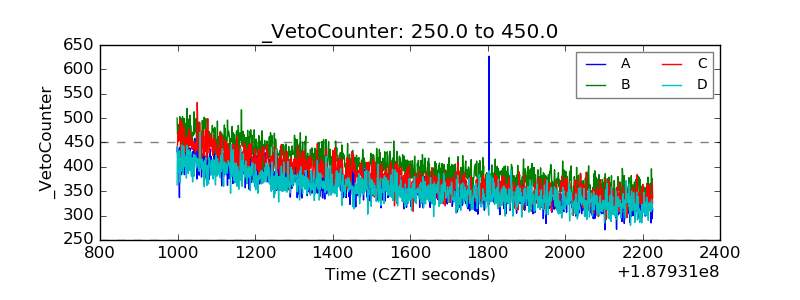 |