| Param | Original file | Final file |
|---|---|---|
| Filename | modeM0/AS1P01_997T02_9000000218_01171cztM0_level2.evt | modeM0/AS1P01_997T02_9000000218_01171cztM0_level2_quad_clean.evt |
| Size (bytes) | 1,275,716,160 | 88,646,400 |
| Size | 1.2 GB | 84.5 MB |
| Events in quadrant A | 6,806,940 | 609,399 |
| Events in quadrant B | 7,654,531 | 613,294 |
| Events in quadrant C | 7,493,674 | 581,829 |
| Events in quadrant D | 16,298,950 | 473,823 |
| Mode M9 | |||
|---|---|---|---|
| Quadrant | BADHDUFLAG | Total packets | Discarded packets |
| A | 0 | 13 | 0 |
| B | 0 | 13 | 0 |
| C | 0 | 13 | 0 |
| D | 0 | 13 | 0 |
| Mode M0 | |||
|---|---|---|---|
| Quadrant | BADHDUFLAG | Total packets | Discarded packets |
| A | 0 | 24356 | 2 |
| B | 0 | 26852 | 1 |
| C | 0 | 26387 | 1 |
| D | 0 | 52904 | 1 |
| Mode SS | |||
|---|---|---|---|
| Quadrant | BADHDUFLAG | Total packets | Discarded packets |
| A | 0 | 118 | 0 |
| B | 0 | 118 | 0 |
| C | 0 | 118 | 0 |
| D | 0 | 118 | 0 |
| Quadrant | Total seconds | Saturated seconds | Saturation percentage |
|---|---|---|---|
| A | 5791 | 15 | 0.259023% |
| B | 5791 | 22 | 0.379900% |
| C | 5791 | 84 | 1.450527% |
| D | 5791 | 2966 | 51.217406% |
Noise dominated data is calculated using 1-second bins in cleaned event files. If a bin has >2000 counts, and if more than 50% of those come from <1% of pixels, then it is considered to be noise-dominated and hence unusable.
| Quadrant | # 1 sec bins | Bins with >0 counts | Bins with >2000 counts | High rate bins dominated by noise | Noise dominated (total time) | Noise dominated (detector-on time) | Marked lightcurve |
|---|---|---|---|---|---|---|---|
| A | 7020 | 5790 | 170 | 170 | 2.42% | 2.94% | 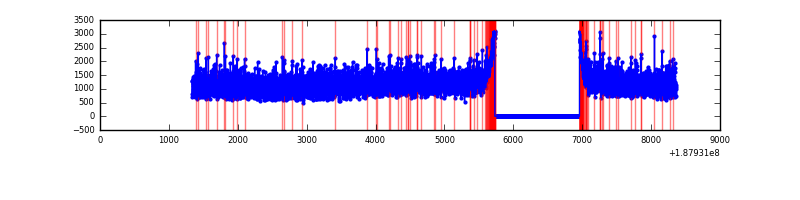 |
| B | 7020 | 5790 | 306 | 306 | 4.36% | 5.28% | 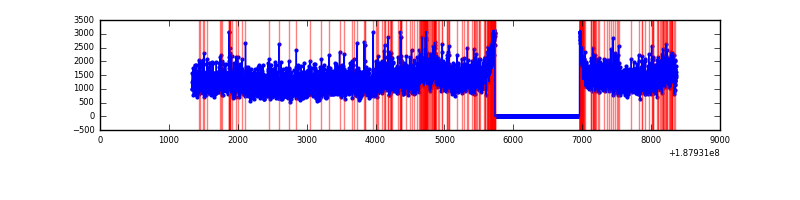 |
| C | 7020 | 5790 | 460 | 460 | 6.55% | 7.94% | 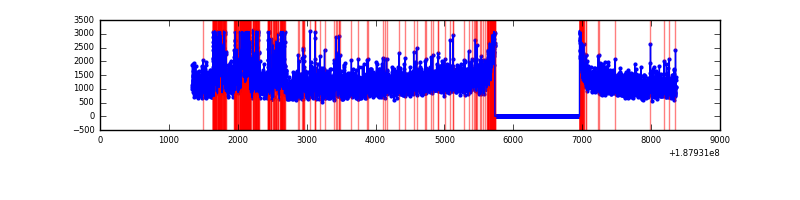 |
| D | 7021 | 5792 | 5567 | 5567 | 79.29% | 96.12% | 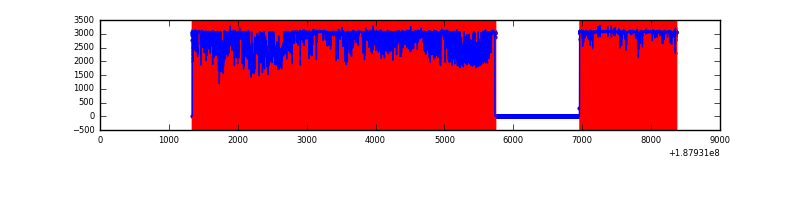 |
Top three noisy pixels from each quadrant. If the there are fewer than three noisy pixels in the level2.evt file, extra rows are filled as -1
| Pixel properties | Quadrant properties | ||||||
|---|---|---|---|---|---|---|---|
| Quadrant | DetID | PixID | Counts | Sigma | Mean | Median | Sigma |
| A | 12 | 243 | 16642 | 35.38 | 1765 | 1778 | 420.1 |
| A | 4 | 32 | 10155 | 19.94 | 1765 | 1778 | 420.1 |
| A | 12 | 251 | 6935 | 12.28 | 1765 | 1778 | 420.1 |
| B | 2 | 32 | 553646 | 1271.54 | 1835 | 1845 | 434.0 |
| B | 6 | 53 | 42659 | 94.05 | 1835 | 1845 | 434.0 |
| B | 15 | 22 | 22960 | 48.66 | 1835 | 1845 | 434.0 |
| C | 9 | 83 | 858606 | 1920.05 | 1618 | 1672 | 446.3 |
| C | 15 | 241 | 272107 | 605.94 | 1618 | 1672 | 446.3 |
| C | 3 | 111 | 17548 | 35.57 | 1618 | 1672 | 446.3 |
| D | 1 | 239 | 10604760 | 23782.36 | 1456 | 1506 | 445.8 |
| D | 2 | 16 | 123846 | 274.4 | 1456 | 1506 | 445.8 |
| D | 10 | 85 | 45220 | 98.05 | 1456 | 1506 | 445.8 |
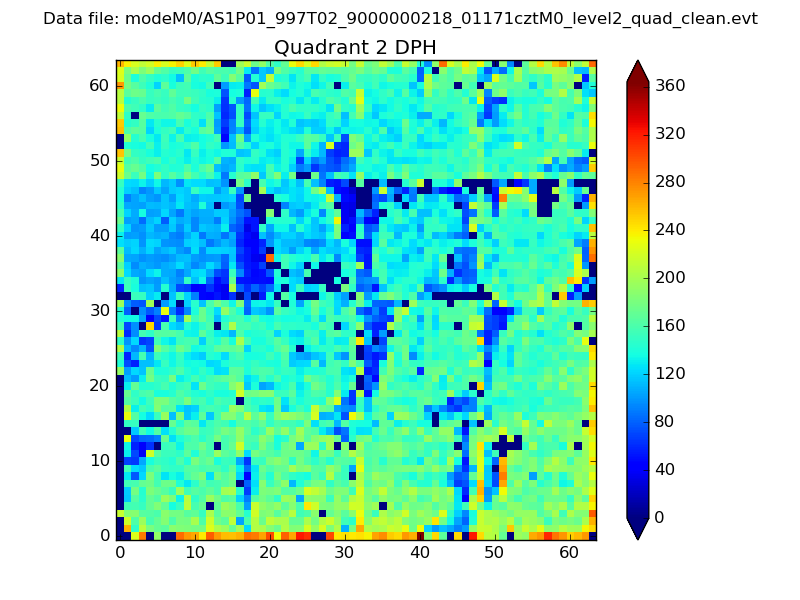
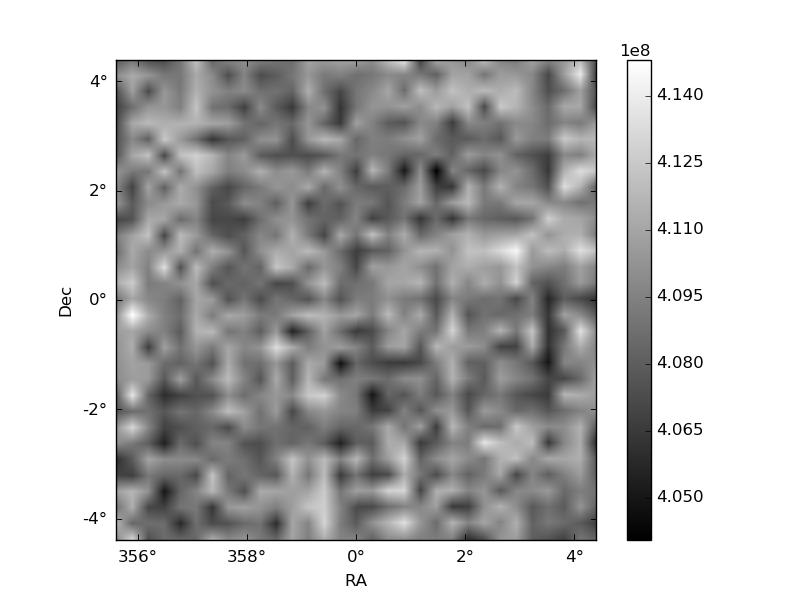
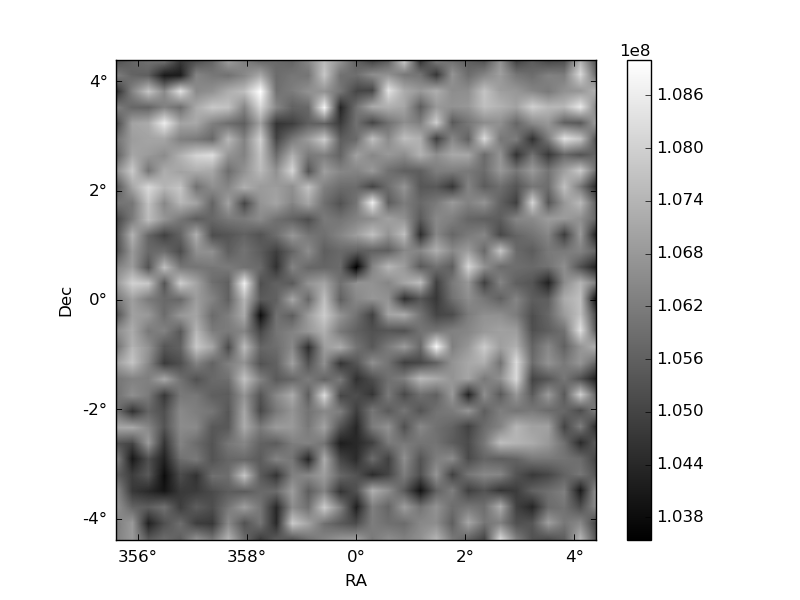
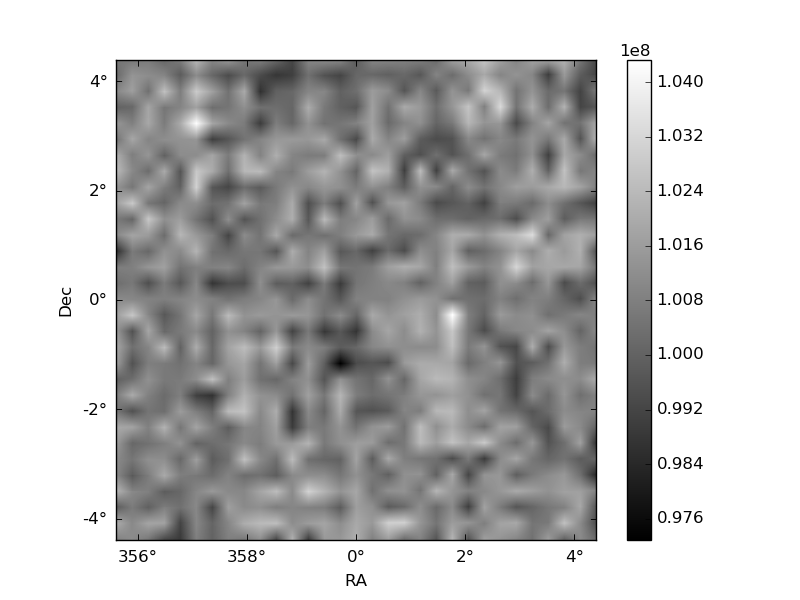
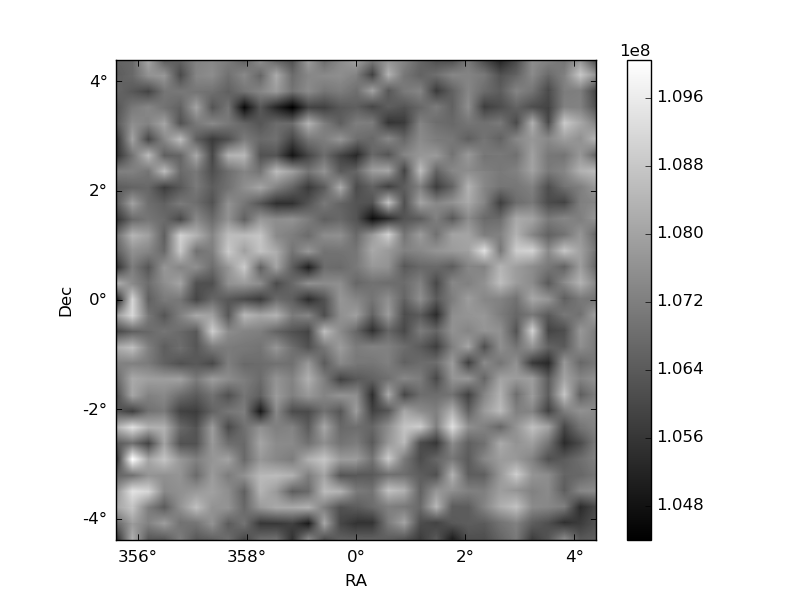
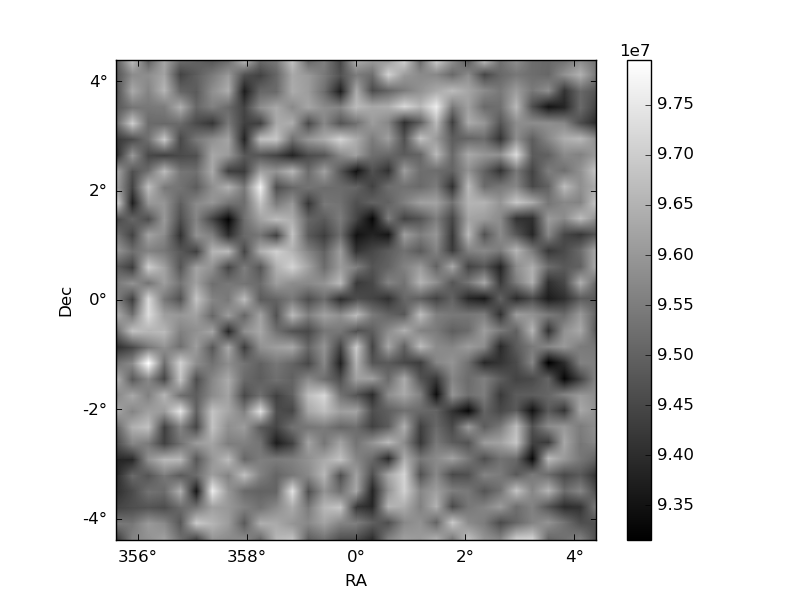
Histogram calculated using DETX and DETY for each event in the final _common_clean file
| Quadrant A | 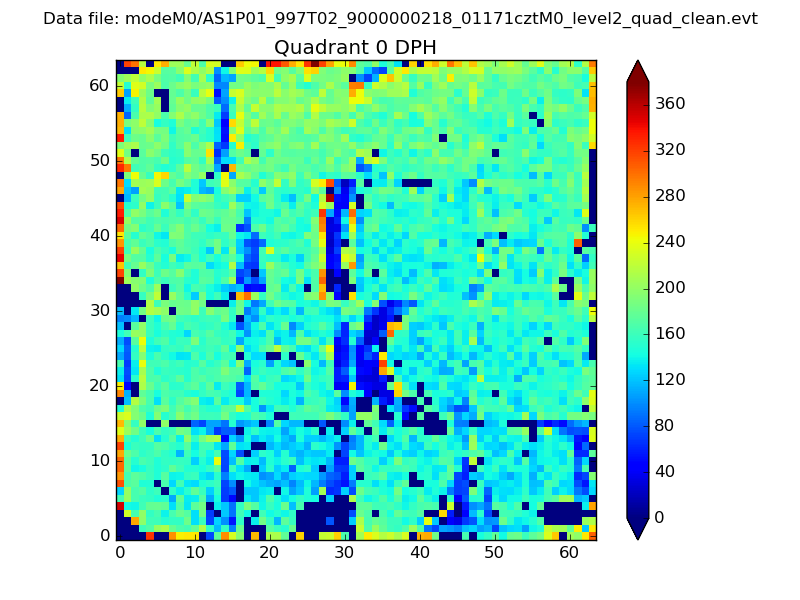 |
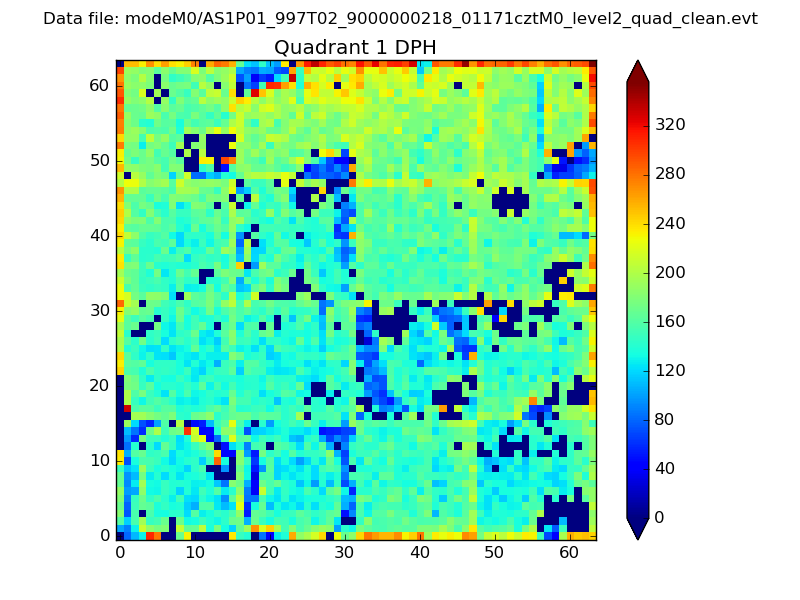 |
Quadrant B |
|---|---|---|---|
| Quadrant D | 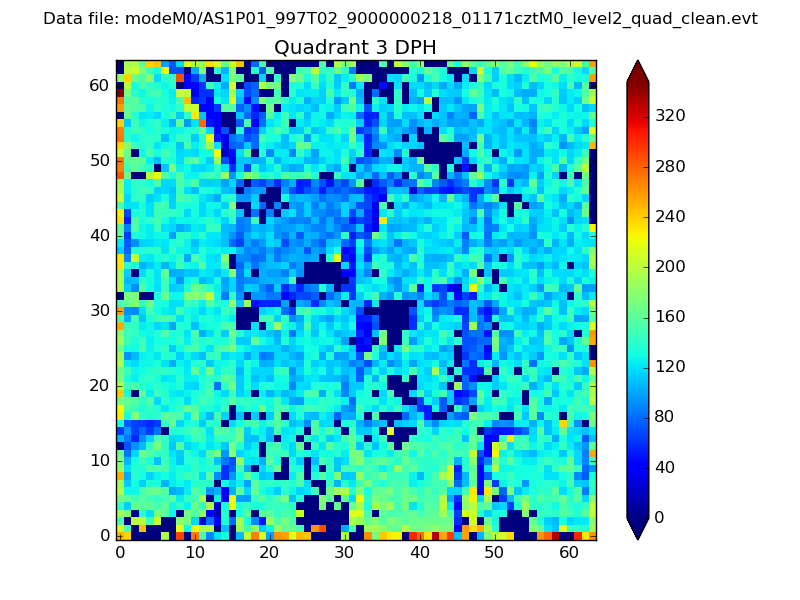 |
 |
Quadrant C |
| Plot type | Count rate plots | Images |
|---|---|---|
| Comparison with Poisson distribution Blue bars denote a histogram of data divided into 1 sec bins. Red curve is a Poisson curve with rate = median count rate of data. |
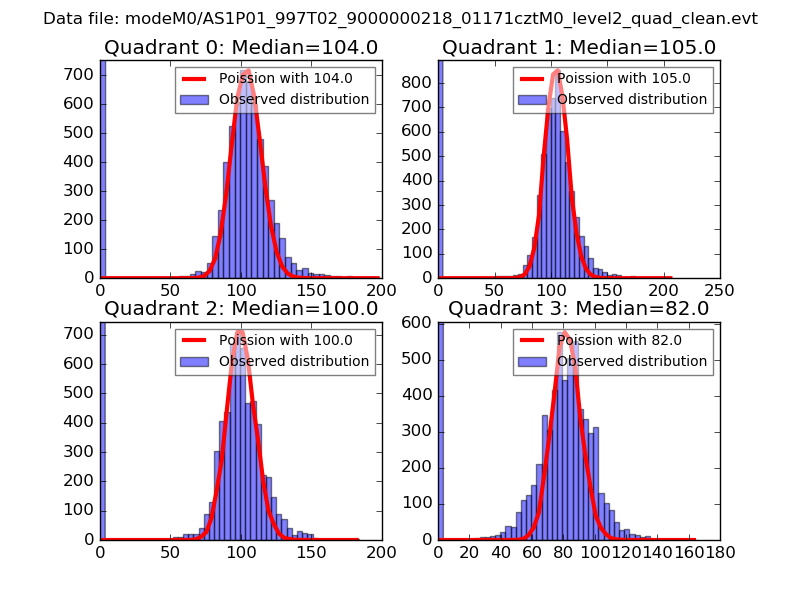 |
 |
| Quadrant-wise count rates Data is divided into 100 sec bins |
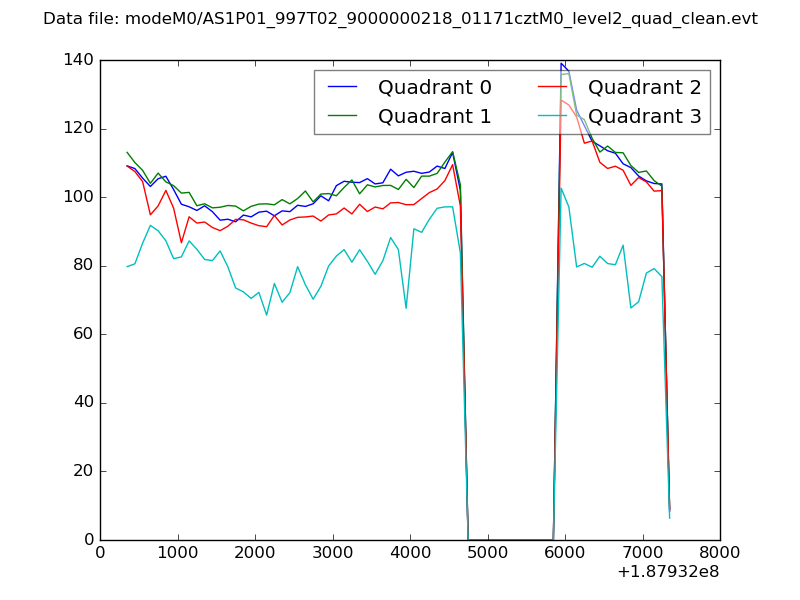 |
|
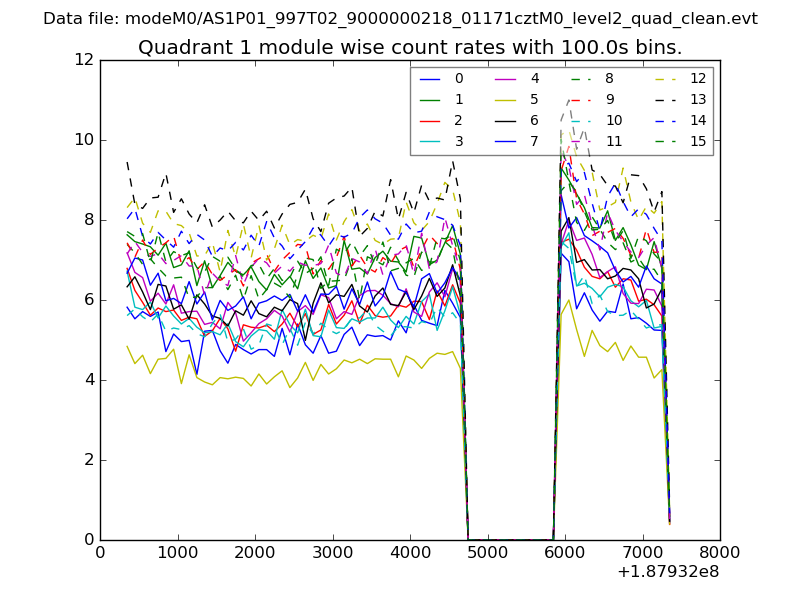
| Module-wise count rates for Quadrant A Data is divided into 100 sec bins |
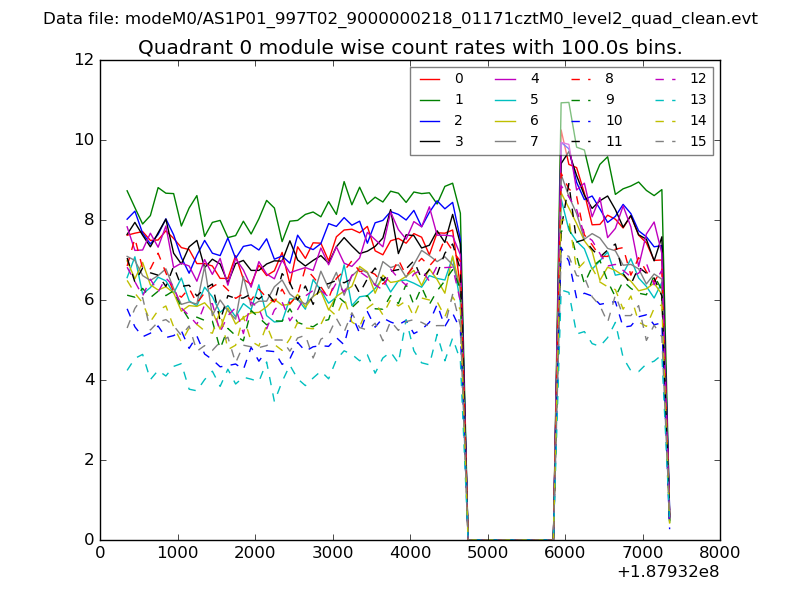 |
 |
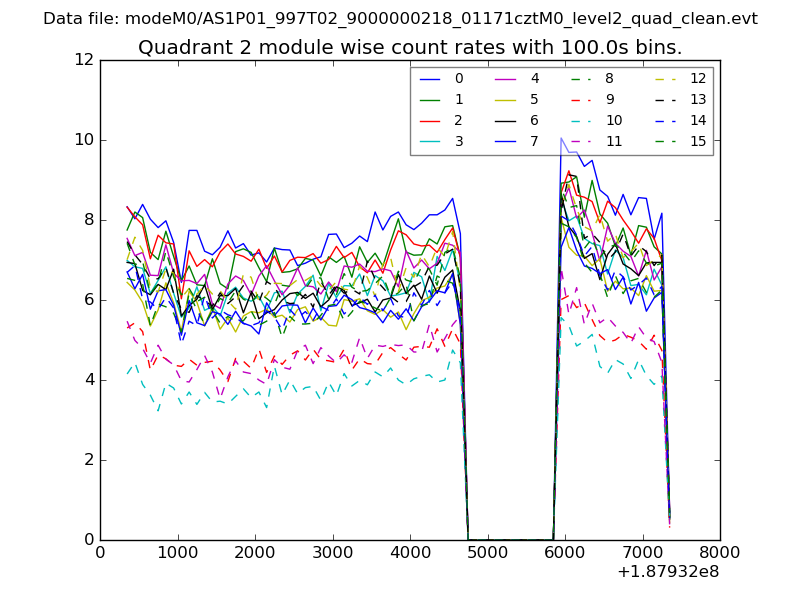
| Module-wise count rates for Quadrant B Data is divided into 100 sec bins |
 |
 |
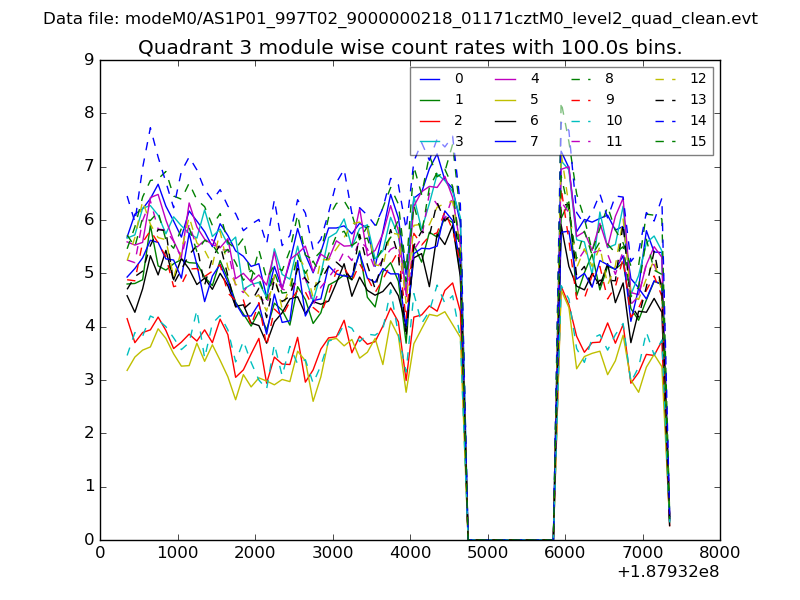
| Module-wise count rates for Quadrant C Data is divided into 100 sec bins |
 |
 |
| Module-wise count rates for Quadrant D Data is divided into 100 sec bins |
 |
 |
| Parameter | Plot |
|---|---|
| CZT HV Monitor | 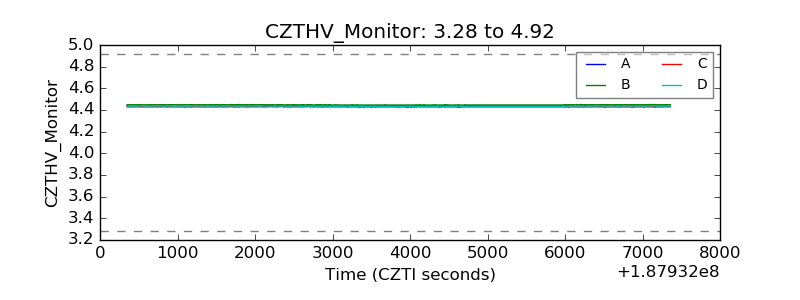 |
| D_VDD | 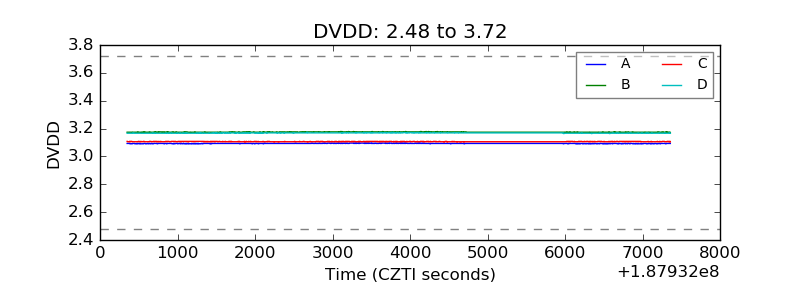 |
| Temperature 1 | 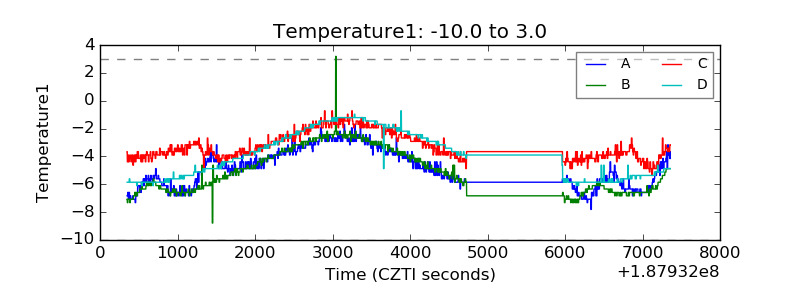 |
| Veto HV Monitor | 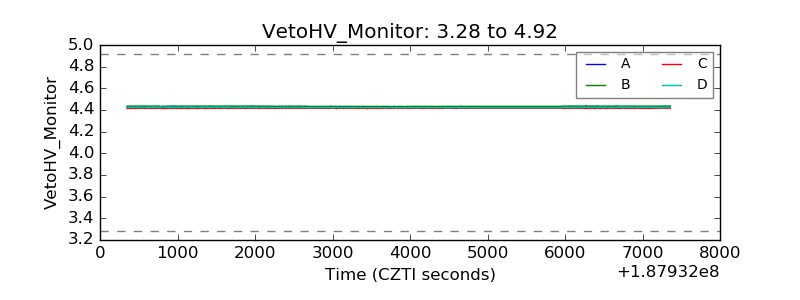 |
| Veto LLD | 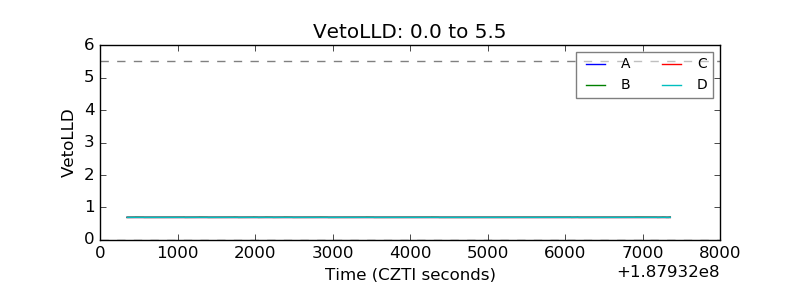 |
| Alpha Counter | 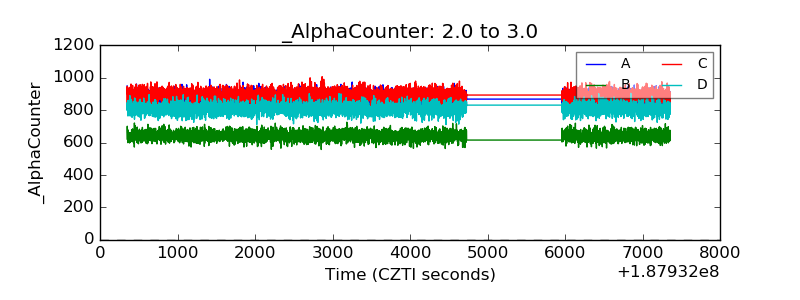 |
| _CPM_Rate | 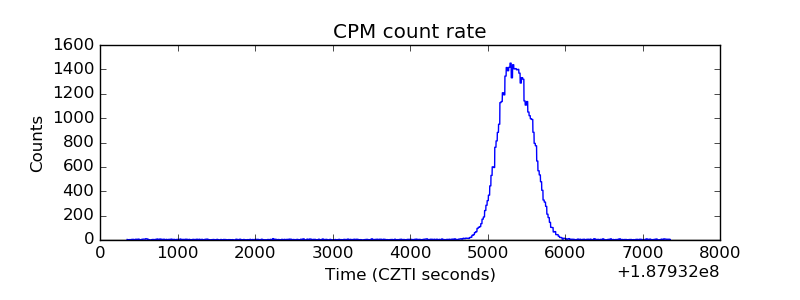 |
| CZT Counter |  |
| +2.5 Volts monitor |  |
| +5 Volts monitor |  |
| _ROLL_ROT | 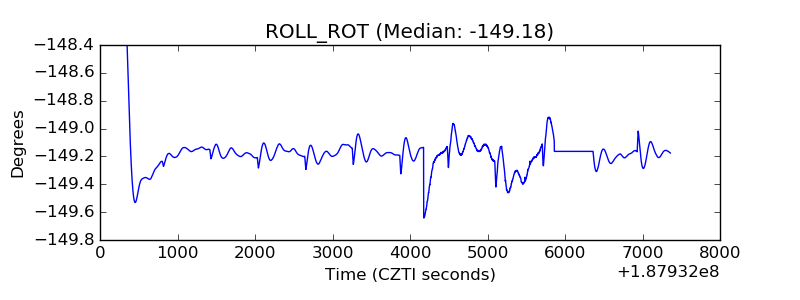 |
| _Roll_DEC | 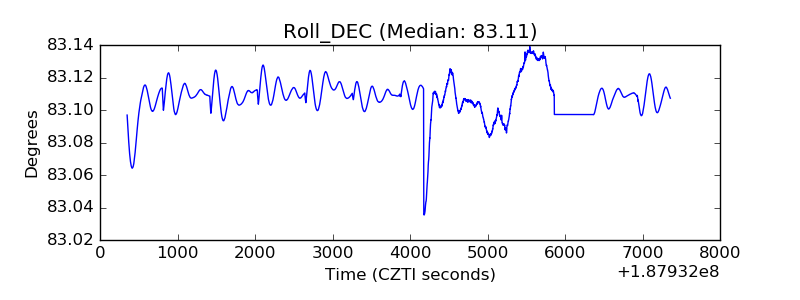 |
| _Roll_RA | 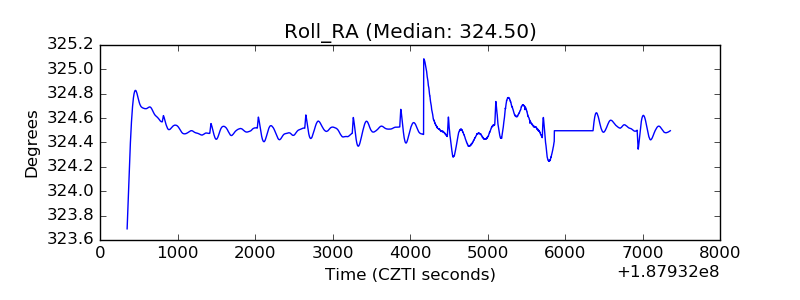 |
| Veto Counter |  |