| Param | Original file | Final file |
|---|---|---|
| Filename | modeM0/AS1P01_997T02_9000000218_01172cztM0_level2.evt | modeM0/AS1P01_997T02_9000000218_01172cztM0_level2_quad_clean.evt |
| Size (bytes) | 1,313,910,720 | 89,115,840 |
| Size | 1.2 GB | 85.0 MB |
| Events in quadrant A | 7,039,834 | 625,605 |
| Events in quadrant B | 7,923,459 | 627,259 |
| Events in quadrant C | 6,835,960 | 600,197 |
| Events in quadrant D | 17,603,594 | 431,456 |
| Mode M9 | |||
|---|---|---|---|
| Quadrant | BADHDUFLAG | Total packets | Discarded packets |
| A | 0 | 13 | 0 |
| B | 0 | 13 | 0 |
| C | 0 | 13 | 0 |
| D | 0 | 13 | 0 |
| Mode M0 | |||
|---|---|---|---|
| Quadrant | BADHDUFLAG | Total packets | Discarded packets |
| A | 0 | 25104 | 2 |
| B | 0 | 27693 | 1 |
| C | 0 | 24487 | 1 |
| D | 0 | 57192 | 1 |
| Mode SS | |||
|---|---|---|---|
| Quadrant | BADHDUFLAG | Total packets | Discarded packets |
| A | 0 | 118 | 0 |
| B | 0 | 118 | 0 |
| C | 0 | 118 | 0 |
| D | 0 | 118 | 0 |
| Quadrant | Total seconds | Saturated seconds | Saturation percentage |
|---|---|---|---|
| A | 5903 | 11 | 0.186346% |
| B | 5903 | 31 | 0.525157% |
| C | 5903 | 4 | 0.067762% |
| D | 5903 | 4541 | 76.926986% |
Noise dominated data is calculated using 1-second bins in cleaned event files. If a bin has >2000 counts, and if more than 50% of those come from <1% of pixels, then it is considered to be noise-dominated and hence unusable.
| Quadrant | # 1 sec bins | Bins with >0 counts | Bins with >2000 counts | High rate bins dominated by noise | Noise dominated (total time) | Noise dominated (detector-on time) | Marked lightcurve |
|---|---|---|---|---|---|---|---|
| A | 7173 | 5904 | 186 | 186 | 2.59% | 3.15% | 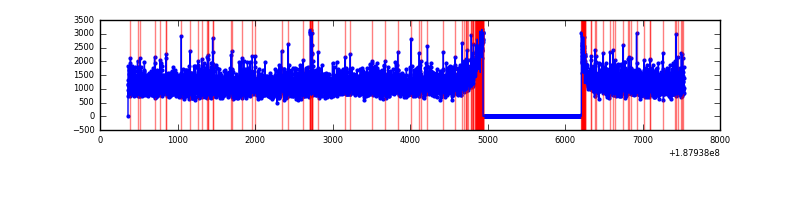 |
| B | 7173 | 5904 | 337 | 337 | 4.70% | 5.71% |  |
| C | 7173 | 5904 | 139 | 139 | 1.94% | 2.35% |  |
| D | 7173 | 5904 | 5863 | 5863 | 81.74% | 99.31% | 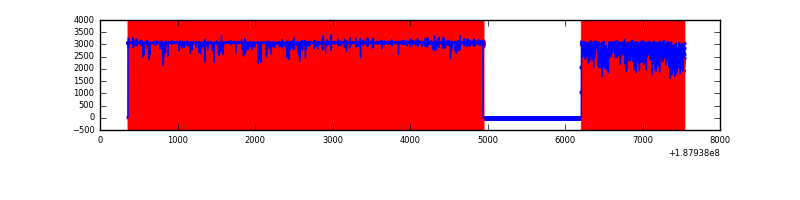 |
Top three noisy pixels from each quadrant. If the there are fewer than three noisy pixels in the level2.evt file, extra rows are filled as -1
| Pixel properties | Quadrant properties | ||||||
|---|---|---|---|---|---|---|---|
| Quadrant | DetID | PixID | Counts | Sigma | Mean | Median | Sigma |
| A | 12 | 243 | 46759 | 104.4 | 1810 | 1822 | 430.4 |
| A | 4 | 32 | 43734 | 97.37 | 1810 | 1822 | 430.4 |
| A | 11 | 79 | 7858 | 14.02 | 1810 | 1822 | 430.4 |
| B | 2 | 32 | 625518 | 1416.25 | 1874 | 1885 | 440.3 |
| B | 5 | 191 | 64041 | 141.15 | 1874 | 1885 | 440.3 |
| B | 6 | 53 | 38576 | 83.32 | 1874 | 1885 | 440.3 |
| C | 15 | 241 | 273437 | 590.32 | 1661 | 1714 | 460.3 |
| C | 9 | 83 | 36349 | 75.25 | 1661 | 1714 | 460.3 |
| C | 3 | 111 | 19376 | 38.37 | 1661 | 1714 | 460.3 |
| D | 1 | 239 | 12392663 | 30054.95 | 1353 | 1398 | 412.3 |
| D | 10 | 125 | 40719 | 95.37 | 1353 | 1398 | 412.3 |
| D | 13 | 25 | 32118 | 74.51 | 1353 | 1398 | 412.3 |
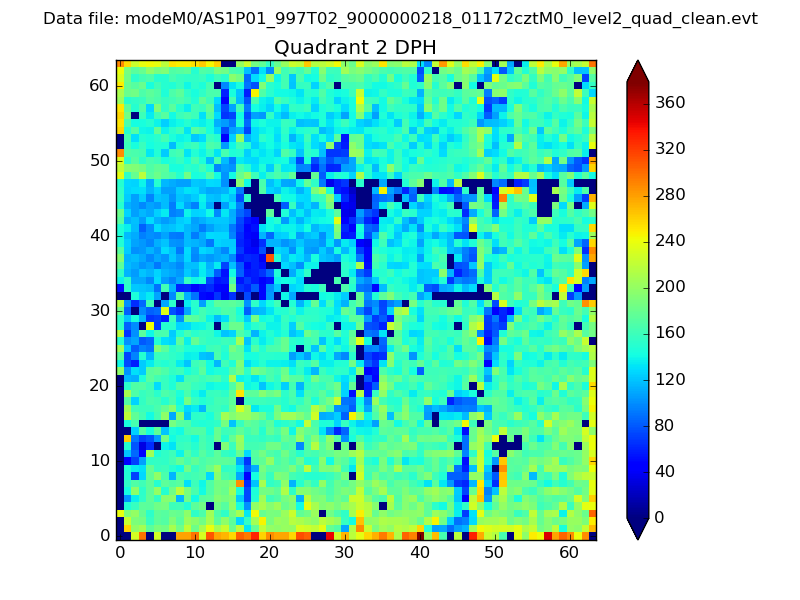
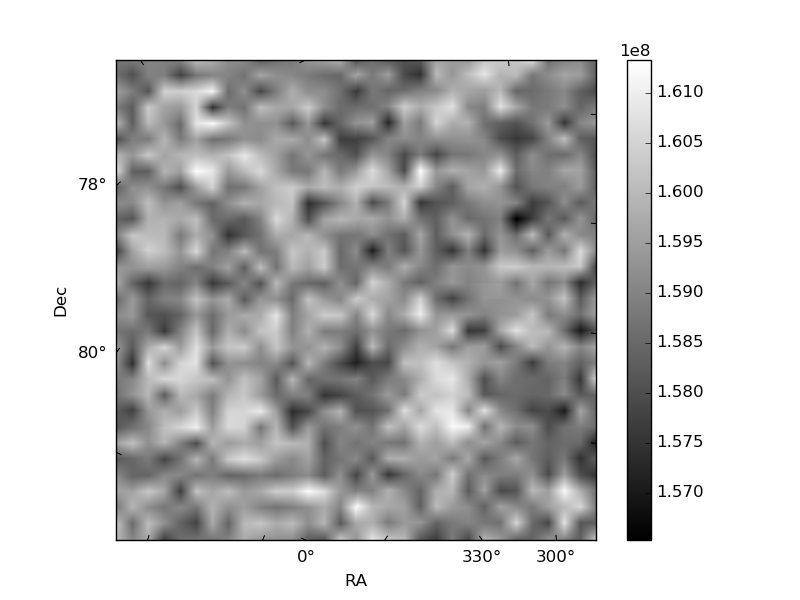
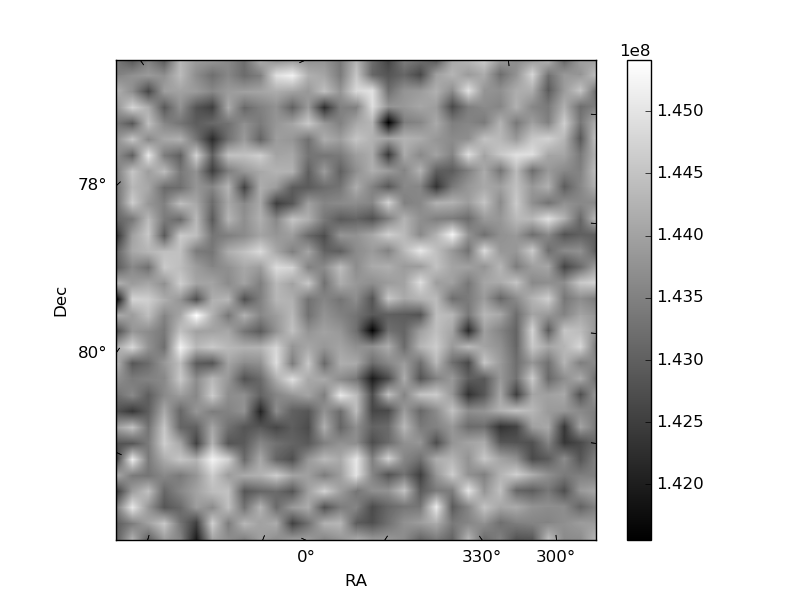
Histogram calculated using DETX and DETY for each event in the final _common_clean file
| Quadrant A | 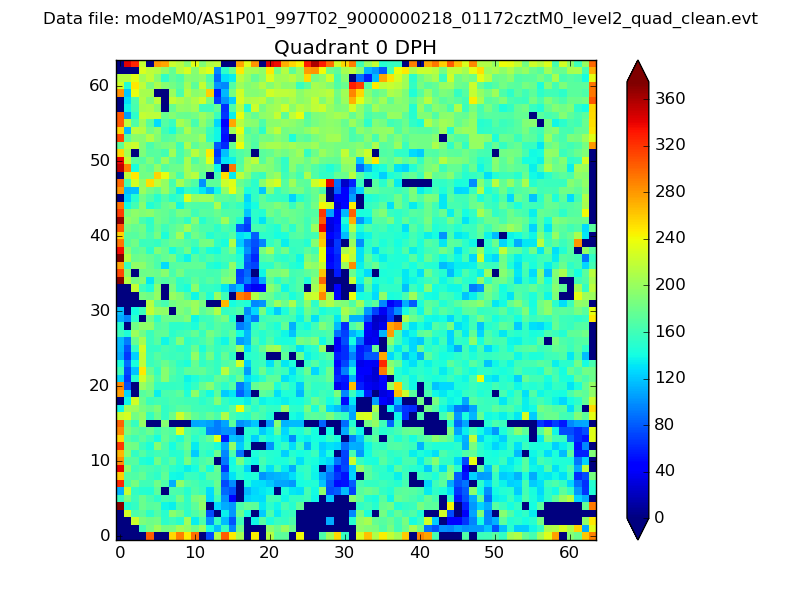 |
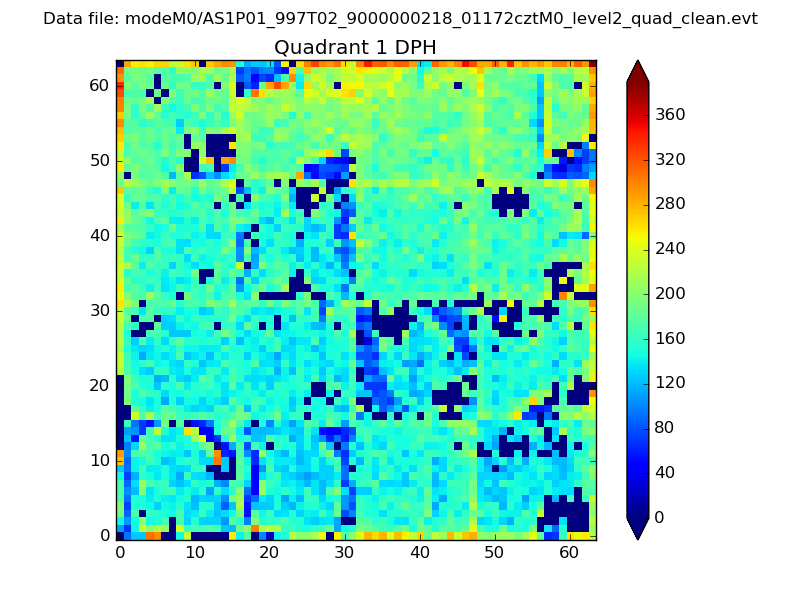 |
Quadrant B |
|---|---|---|---|
| Quadrant D | 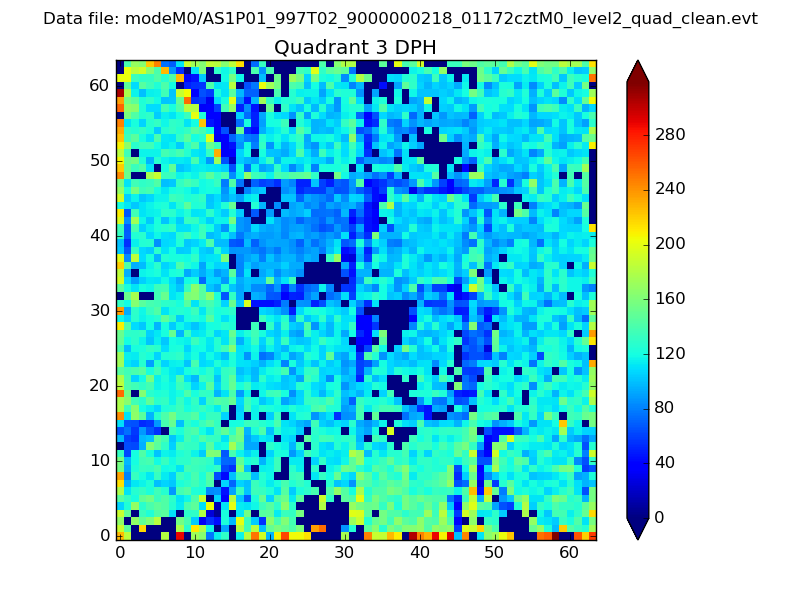 |
 |
Quadrant C |
| Plot type | Count rate plots | Images |
|---|---|---|
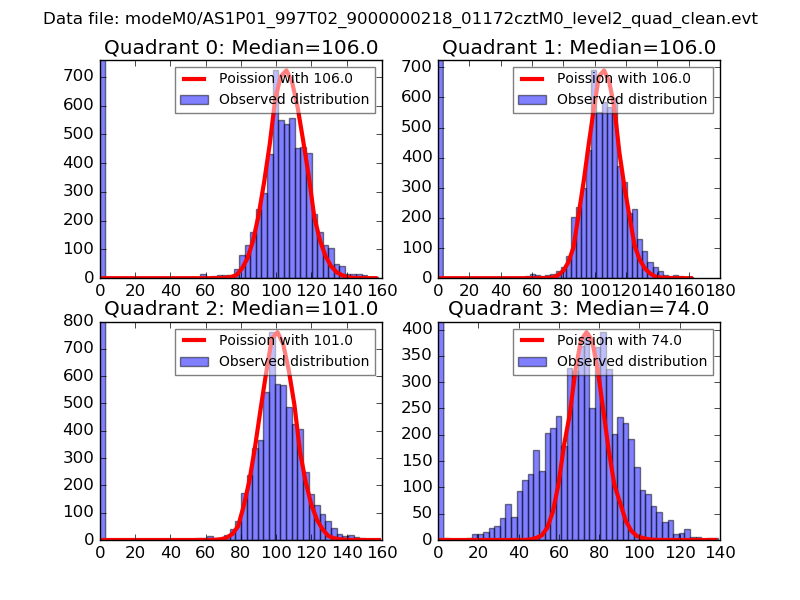
| Comparison with Poisson distribution Blue bars denote a histogram of data divided into 1 sec bins. Red curve is a Poisson curve with rate = median count rate of data. |
 |
 |
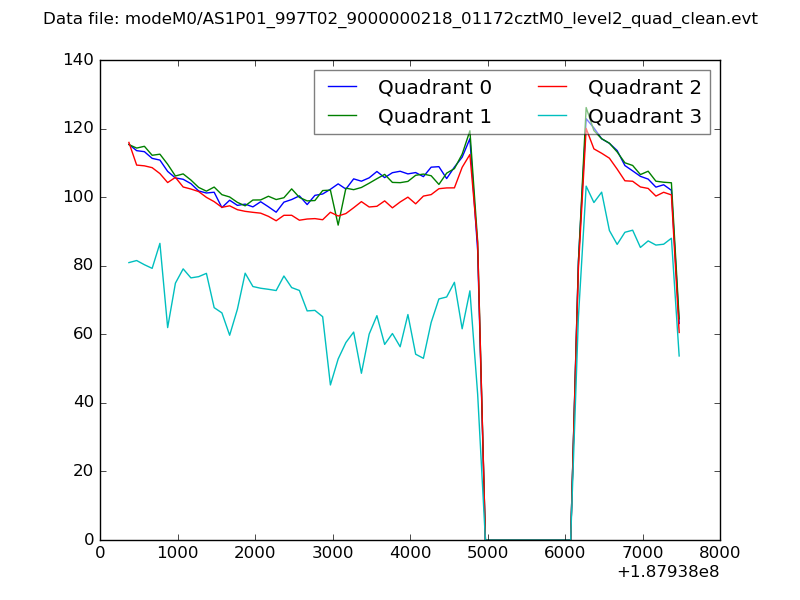
| Quadrant-wise count rates Data is divided into 100 sec bins |
 |
|
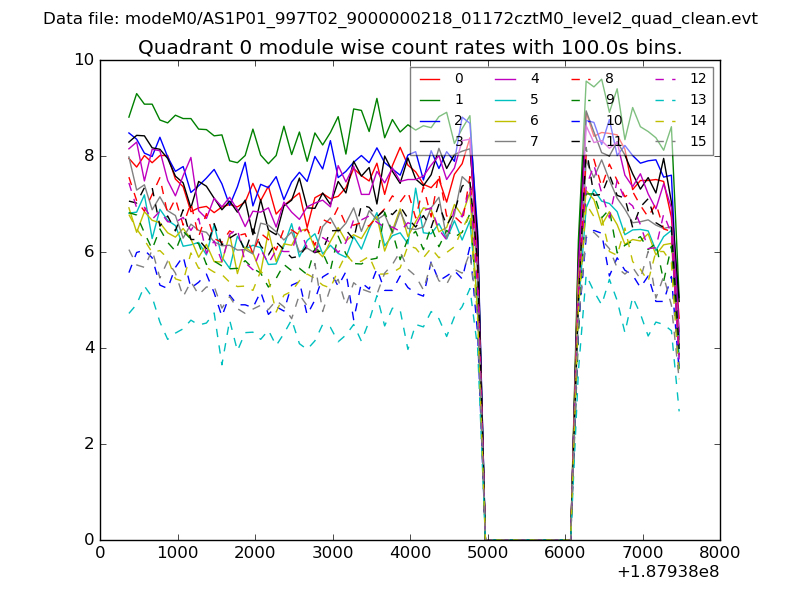
| Module-wise count rates for Quadrant A Data is divided into 100 sec bins |
 |
 |
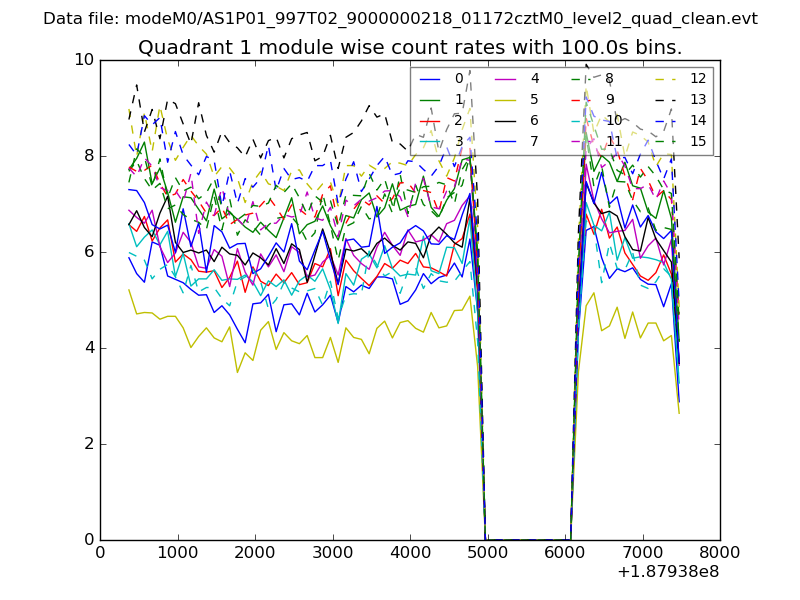
| Module-wise count rates for Quadrant B Data is divided into 100 sec bins |
 |
 |
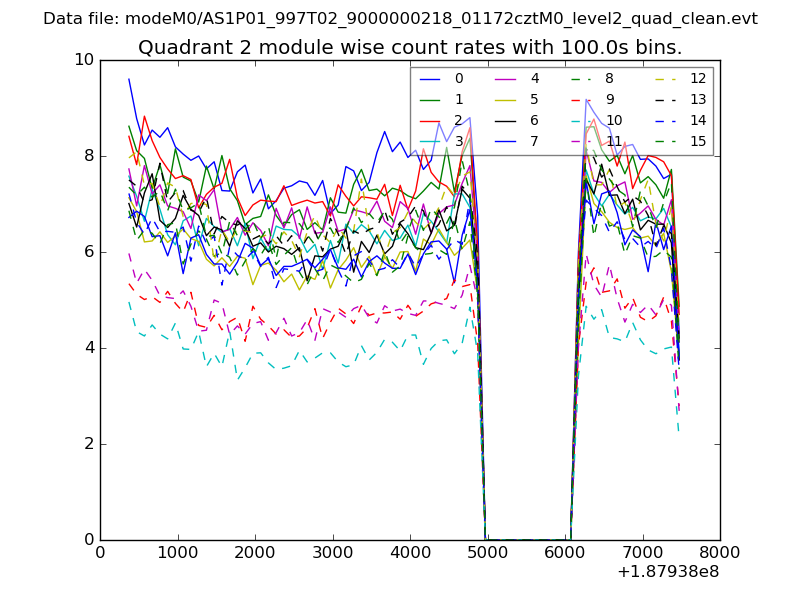
| Module-wise count rates for Quadrant C Data is divided into 100 sec bins |
 |
 |
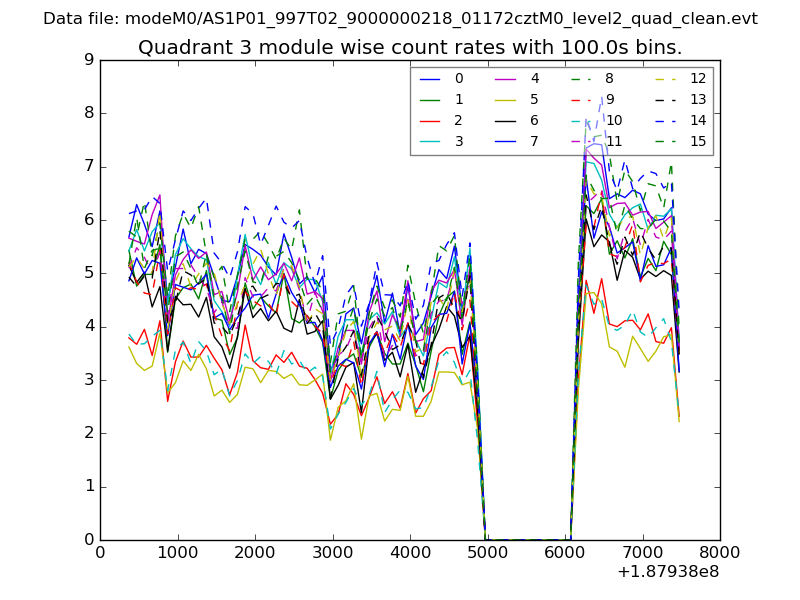
| Module-wise count rates for Quadrant D Data is divided into 100 sec bins |
 |
 |
| Parameter | Plot |
|---|---|
| CZT HV Monitor | 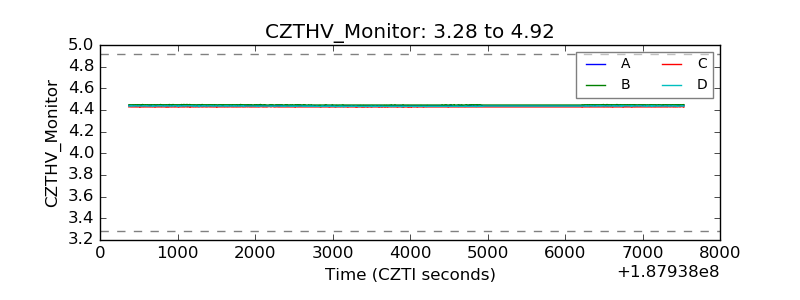 |
| D_VDD | 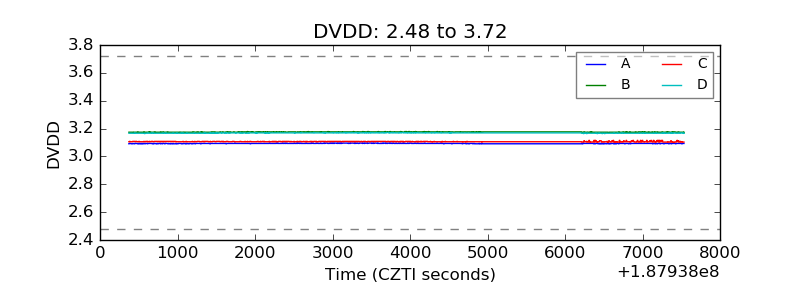 |
| Temperature 1 | 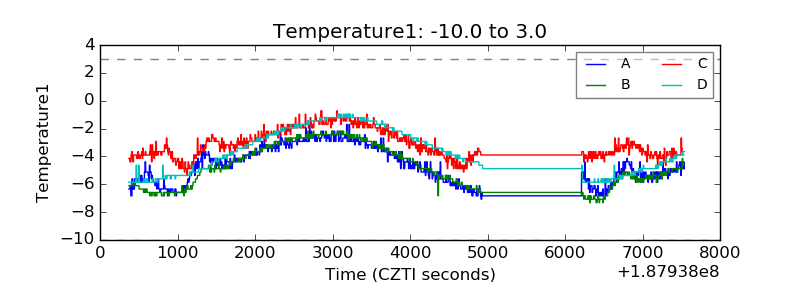 |
| Veto HV Monitor | 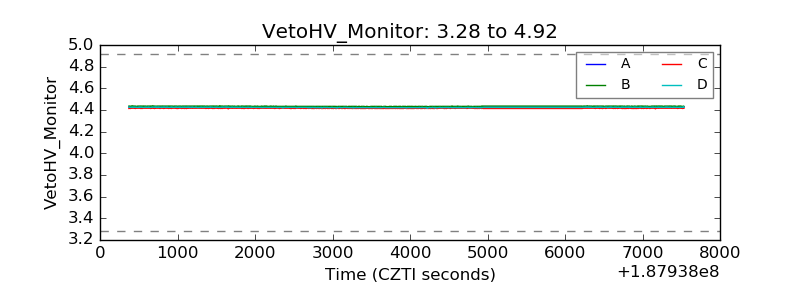 |
| Veto LLD |  |
| Alpha Counter | 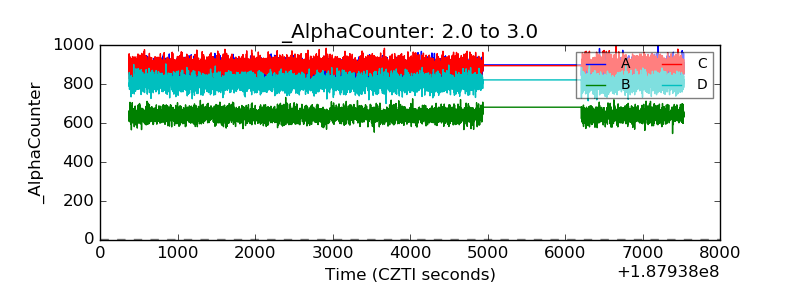 |
| _CPM_Rate | 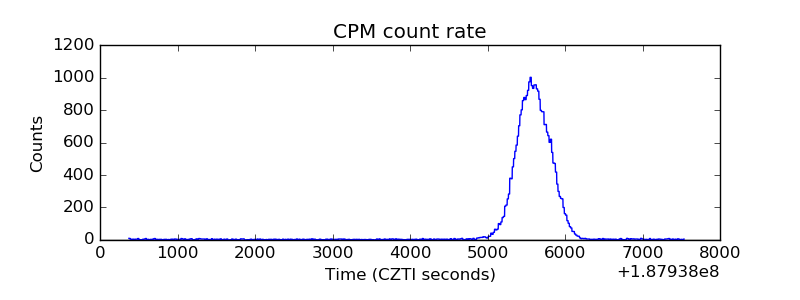 |
| CZT Counter | 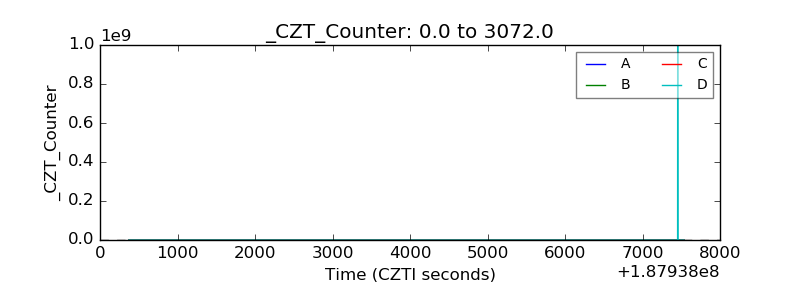 |
| +2.5 Volts monitor |  |
| +5 Volts monitor |  |
| _ROLL_ROT | 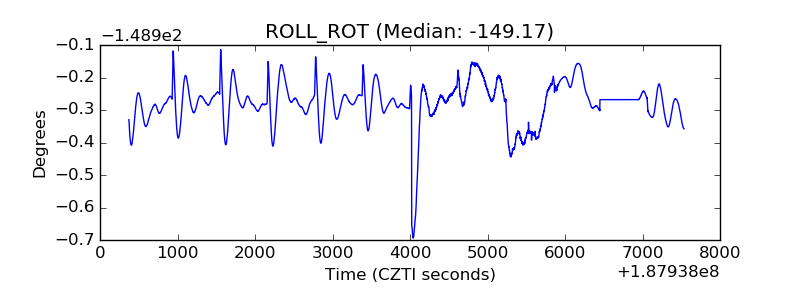 |
| _Roll_DEC | 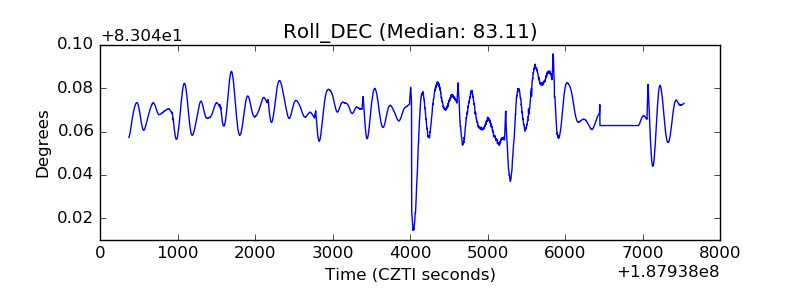 |
| _Roll_RA | 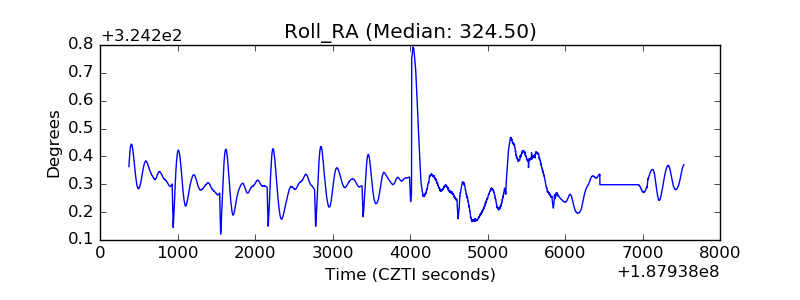 |
| Veto Counter | 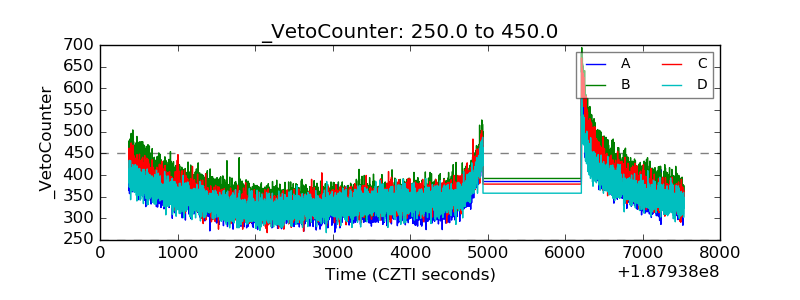 |