| Param | Original file | Final file |
|---|---|---|
| Filename | modeM0/AS1P01_997T02_9000000218_01173cztM0_level2.evt | modeM0/AS1P01_997T02_9000000218_01173cztM0_level2_quad_clean.evt |
| Size (bytes) | 1,277,081,280 | 81,990,720 |
| Size | 1.2 GB | 78.2 MB |
| Events in quadrant A | 6,947,225 | 591,955 |
| Events in quadrant B | 7,409,951 | 593,840 |
| Events in quadrant C | 6,945,820 | 563,669 |
| Events in quadrant D | 16,995,315 | 330,842 |
| Mode M9 | |||
|---|---|---|---|
| Quadrant | BADHDUFLAG | Total packets | Discarded packets |
| A | 0 | 12 | 0 |
| B | 0 | 12 | 0 |
| C | 0 | 12 | 0 |
| D | 0 | 12 | 0 |
| Mode M0 | |||
|---|---|---|---|
| Quadrant | BADHDUFLAG | Total packets | Discarded packets |
| A | 0 | 24717 | 2 |
| B | 0 | 26047 | 1 |
| C | 0 | 24669 | 1 |
| D | 0 | 55316 | 1 |
| Mode SS | |||
|---|---|---|---|
| Quadrant | BADHDUFLAG | Total packets | Discarded packets |
| A | 0 | 118 | 0 |
| B | 0 | 118 | 0 |
| C | 0 | 118 | 0 |
| D | 0 | 118 | 0 |
| Quadrant | Total seconds | Saturated seconds | Saturation percentage |
|---|---|---|---|
| A | 5721 | 17 | 0.297151% |
| B | 5721 | 19 | 0.332110% |
| C | 5721 | 38 | 0.664220% |
| D | 5721 | 4818 | 84.216046% |
Noise dominated data is calculated using 1-second bins in cleaned event files. If a bin has >2000 counts, and if more than 50% of those come from <1% of pixels, then it is considered to be noise-dominated and hence unusable.
| Quadrant | # 1 sec bins | Bins with >0 counts | Bins with >2000 counts | High rate bins dominated by noise | Noise dominated (total time) | Noise dominated (detector-on time) | Marked lightcurve |
|---|---|---|---|---|---|---|---|
| A | 6906 | 5722 | 205 | 205 | 2.97% | 3.58% | 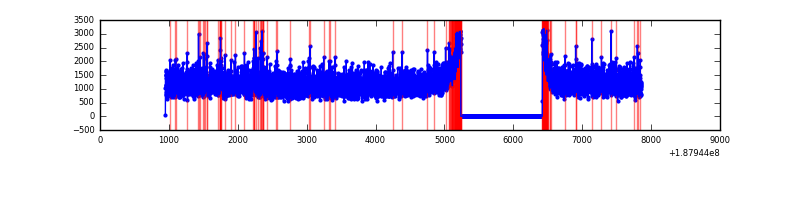 |
| B | 6906 | 5722 | 304 | 304 | 4.40% | 5.31% |  |
| C | 6906 | 5722 | 241 | 241 | 3.49% | 4.21% |  |
| D | 6906 | 5722 | 5584 | 5584 | 80.86% | 97.59% | 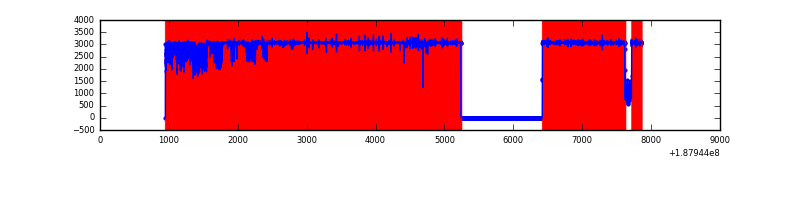 |
Top three noisy pixels from each quadrant. If the there are fewer than three noisy pixels in the level2.evt file, extra rows are filled as -1
| Pixel properties | Quadrant properties | ||||||
|---|---|---|---|---|---|---|---|
| Quadrant | DetID | PixID | Counts | Sigma | Mean | Median | Sigma |
| A | 12 | 243 | 113869 | 263.09 | 1778 | 1791 | 426.0 |
| A | 9 | 17 | 9888 | 19.01 | 1778 | 1791 | 426.0 |
| A | 11 | 79 | 7996 | 14.57 | 1778 | 1791 | 426.0 |
| B | 2 | 32 | 256180 | 592.68 | 1819 | 1832 | 429.1 |
| B | 15 | 22 | 88350 | 201.61 | 1819 | 1832 | 429.1 |
| B | 0 | 230 | 38537 | 85.53 | 1819 | 1832 | 429.1 |
| C | 9 | 83 | 274890 | 602.38 | 1629 | 1684 | 453.5 |
| C | 15 | 241 | 270316 | 592.29 | 1629 | 1684 | 453.5 |
| C | 3 | 111 | 19567 | 39.43 | 1629 | 1684 | 453.5 |
| D | 1 | 239 | 12698125 | 36698.23 | 1124 | 1163 | 346.0 |
| D | 10 | 125 | 61485 | 174.35 | 1124 | 1163 | 346.0 |
| D | 2 | 152 | 11137 | 28.83 | 1124 | 1163 | 346.0 |
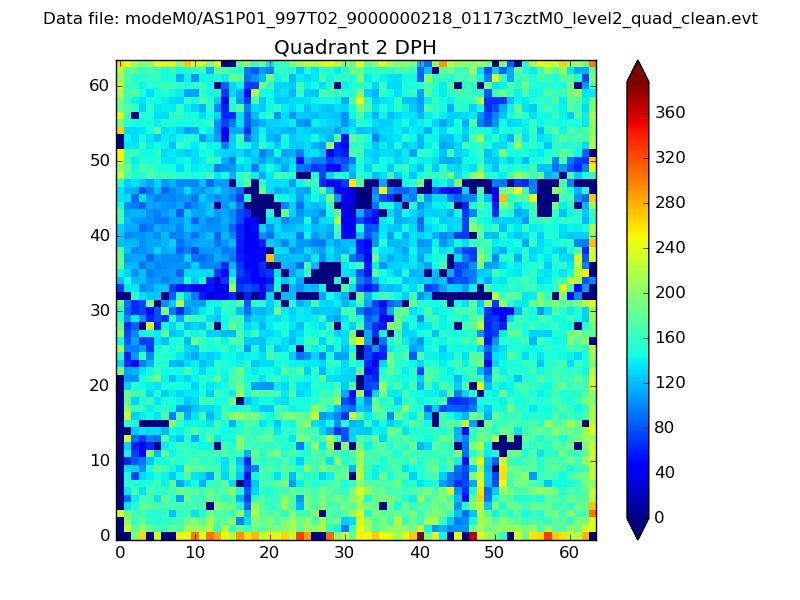
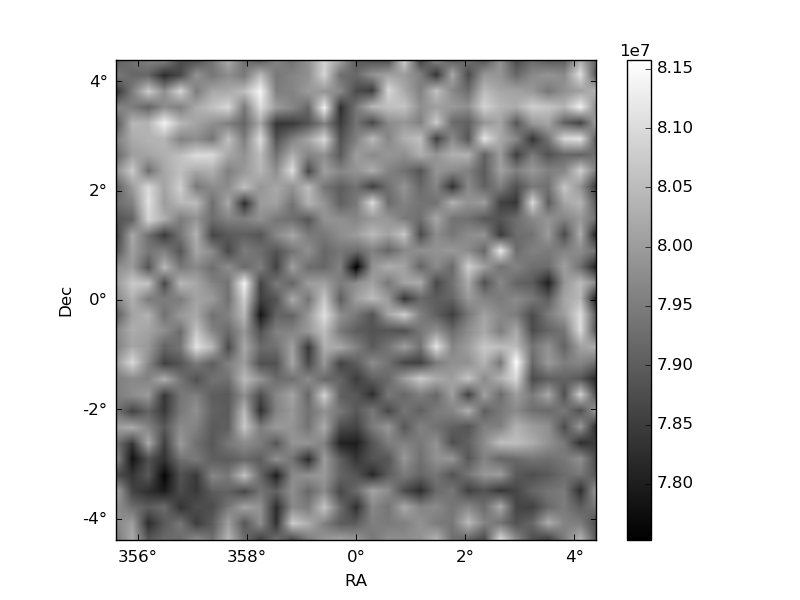
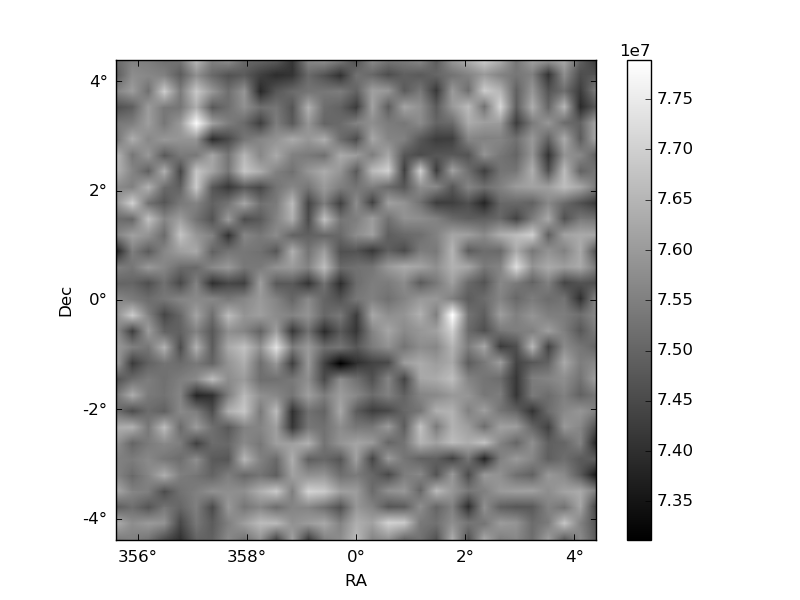
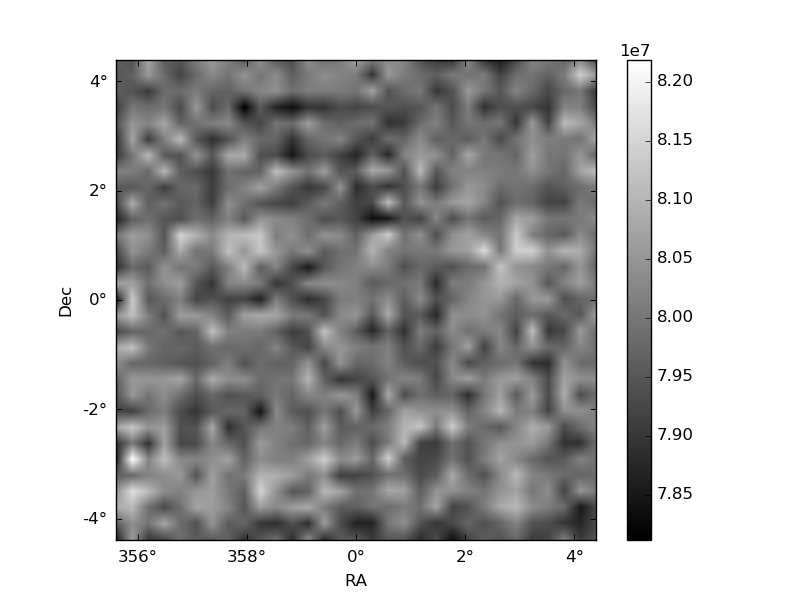
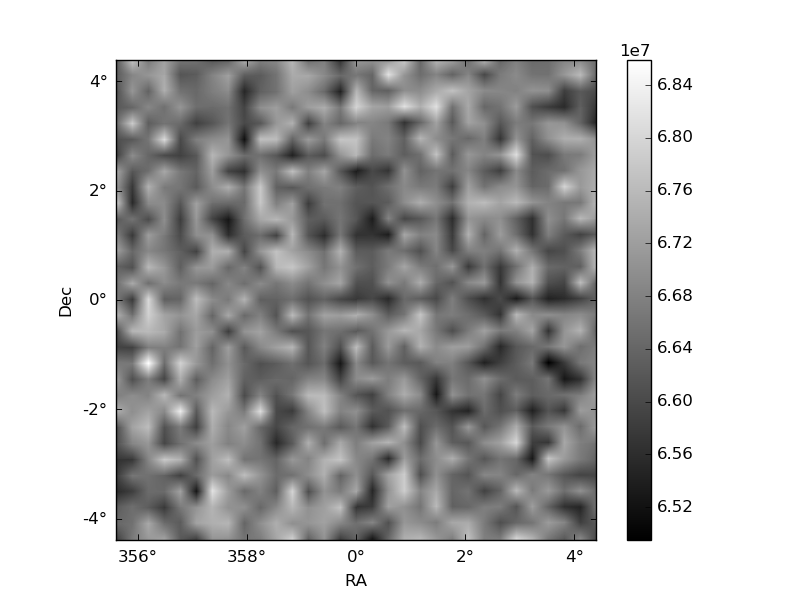
Histogram calculated using DETX and DETY for each event in the final _common_clean file
| Quadrant A | 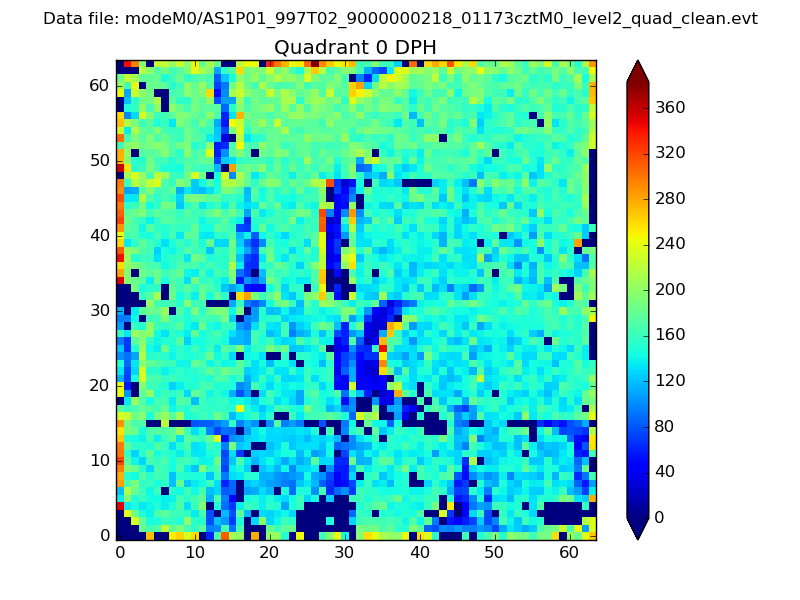 |
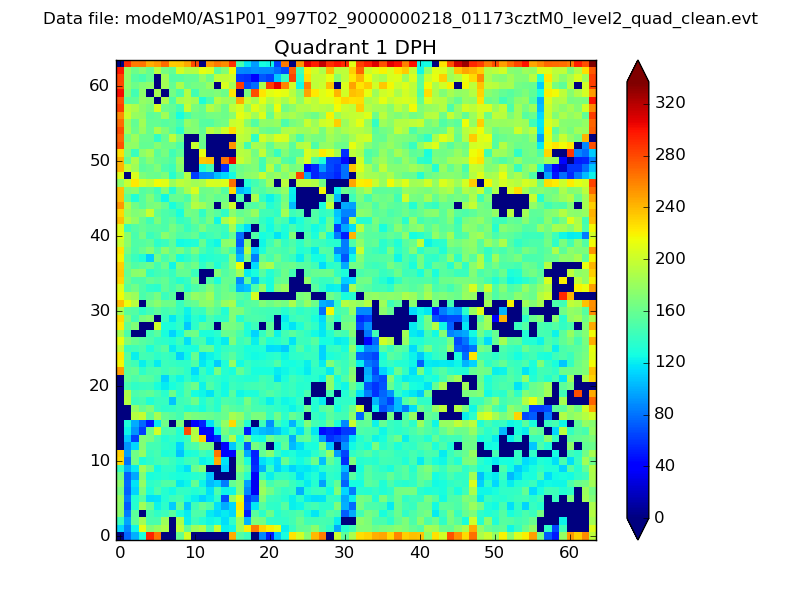 |
Quadrant B |
|---|---|---|---|
| Quadrant D | 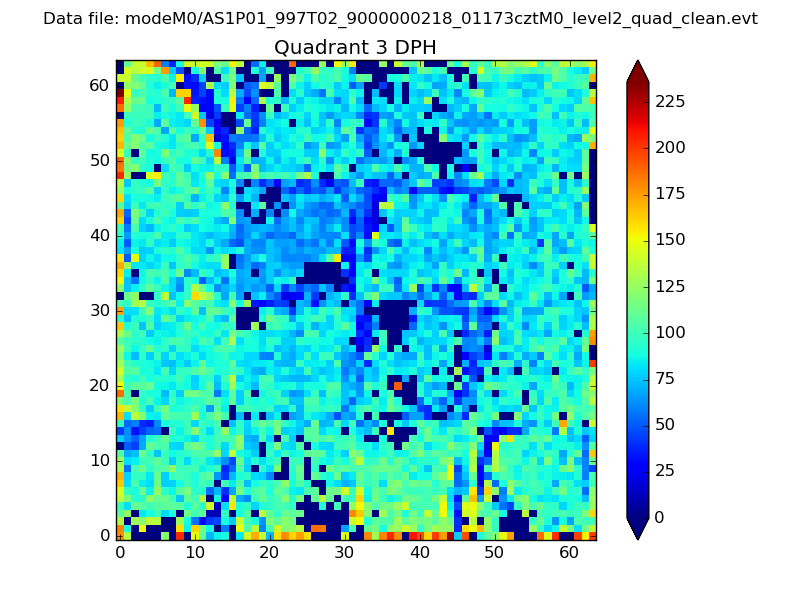 |
 |
Quadrant C |
| Plot type | Count rate plots | Images |
|---|---|---|
| Comparison with Poisson distribution Blue bars denote a histogram of data divided into 1 sec bins. Red curve is a Poisson curve with rate = median count rate of data. |
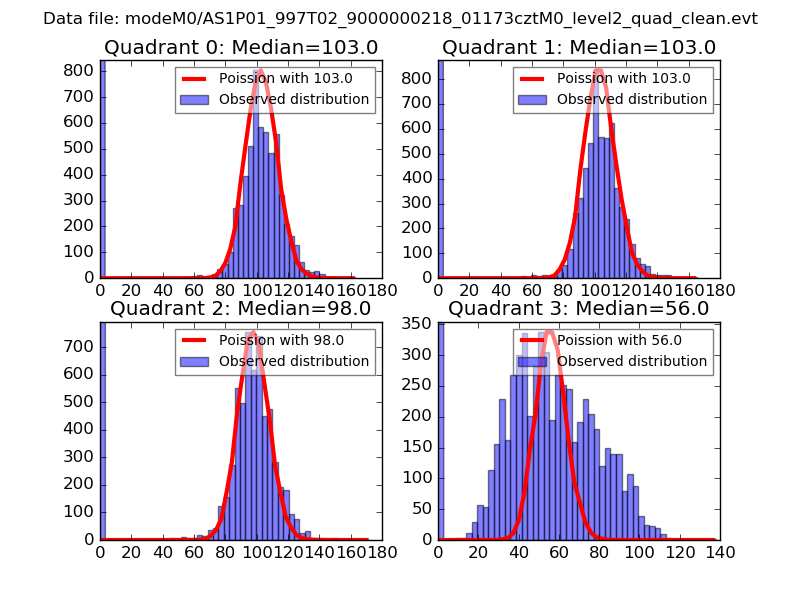 |
 |
| Quadrant-wise count rates Data is divided into 100 sec bins |
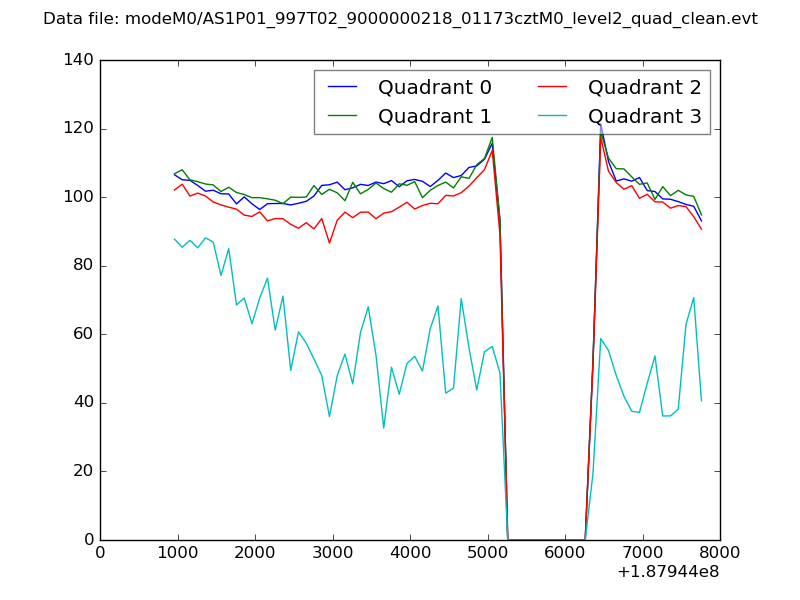 |
|
| Module-wise count rates for Quadrant A Data is divided into 100 sec bins |
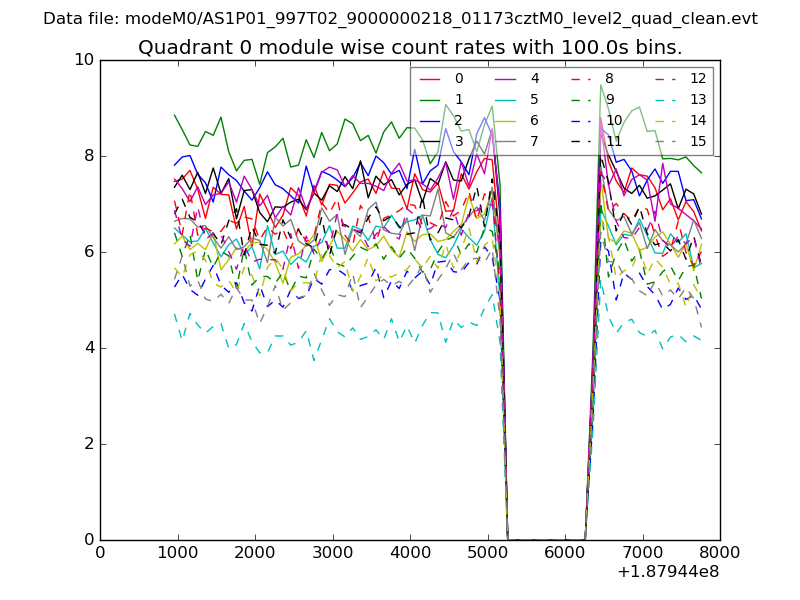 |
 |
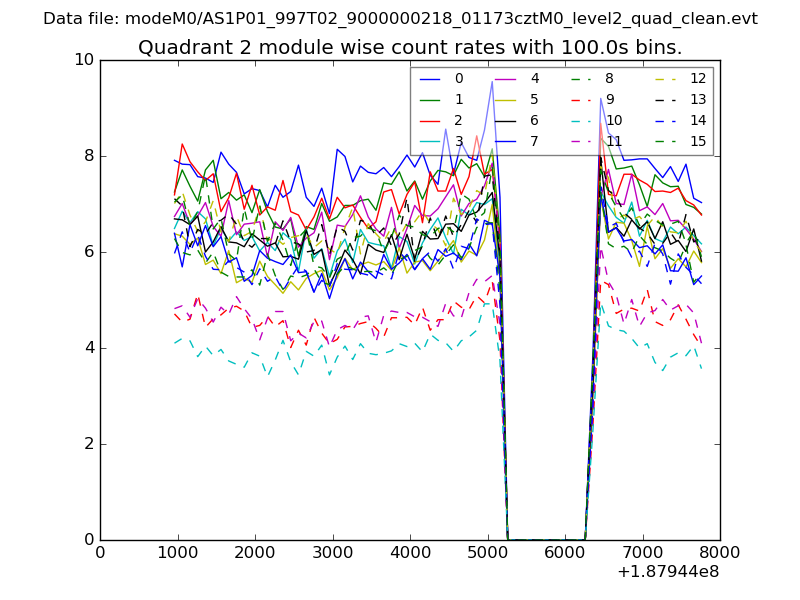
| Module-wise count rates for Quadrant B Data is divided into 100 sec bins |
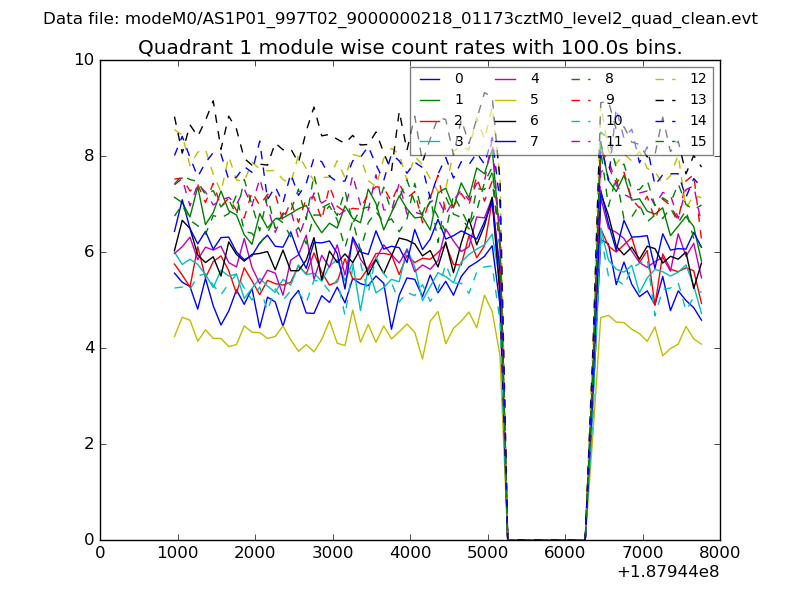 |
 |
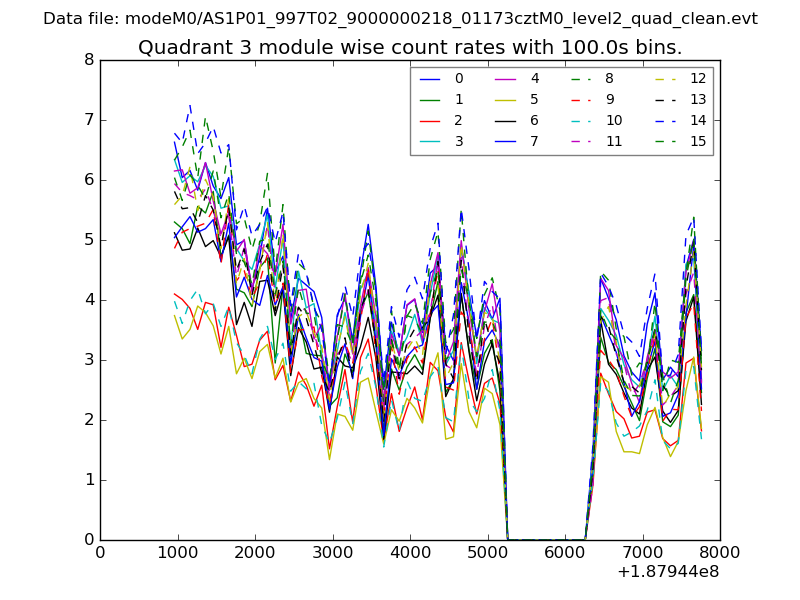
| Module-wise count rates for Quadrant C Data is divided into 100 sec bins |
 |
 |
| Module-wise count rates for Quadrant D Data is divided into 100 sec bins |
 |
 |
| Parameter | Plot |
|---|---|
| CZT HV Monitor | 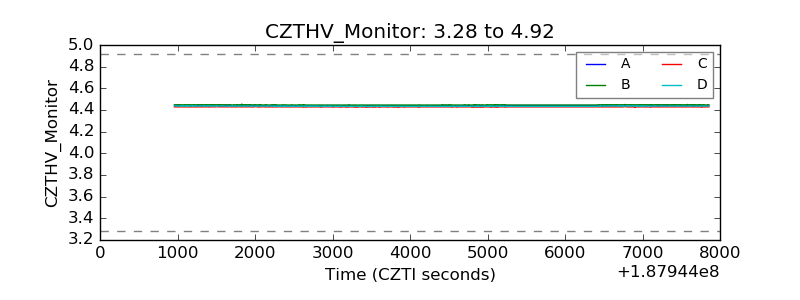 |
| D_VDD | 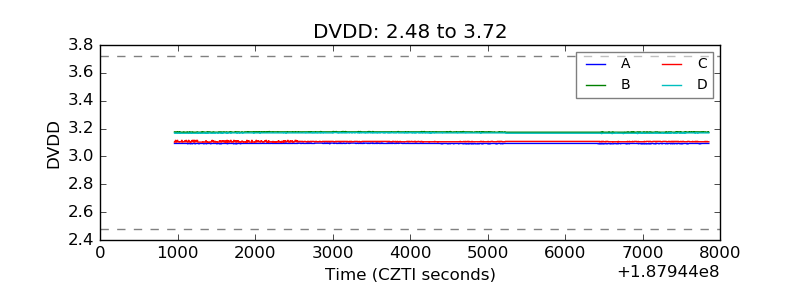 |
| Temperature 1 | 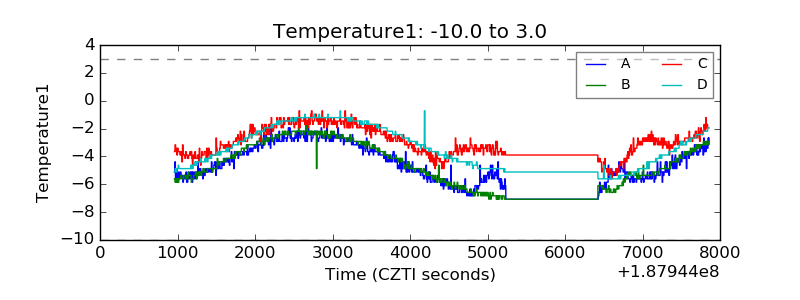 |
| Veto HV Monitor | 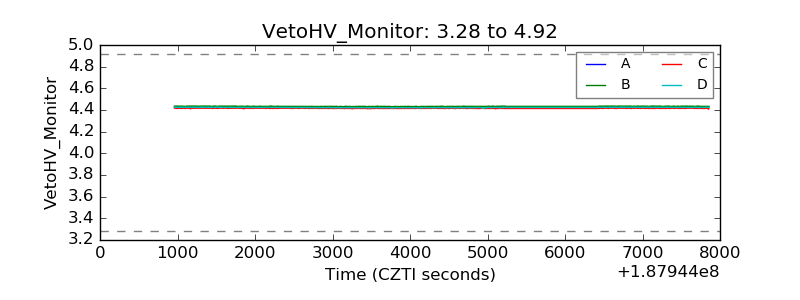 |
| Veto LLD | 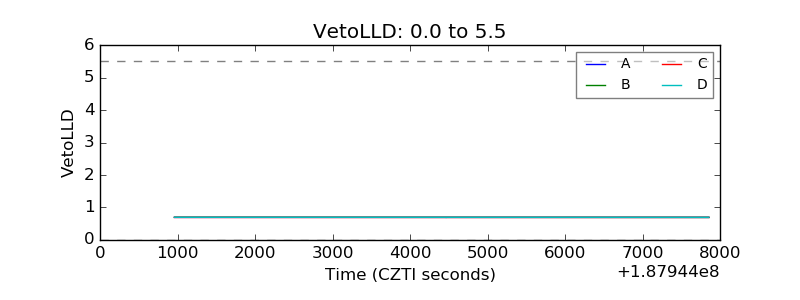 |
| Alpha Counter | 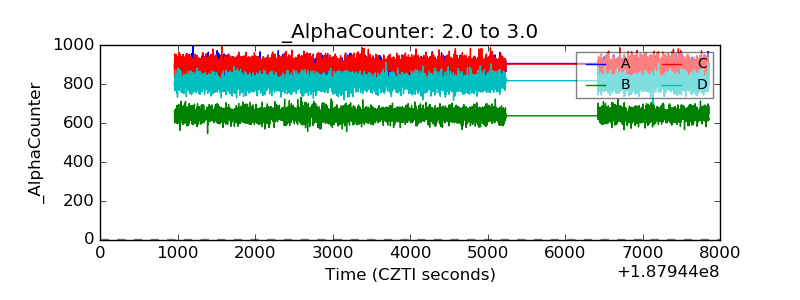 |
| _CPM_Rate | 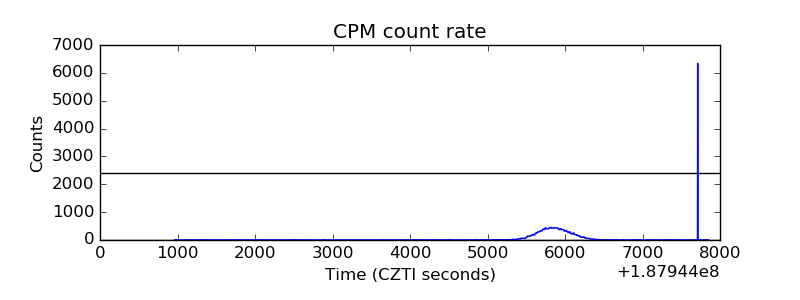 |
| CZT Counter | 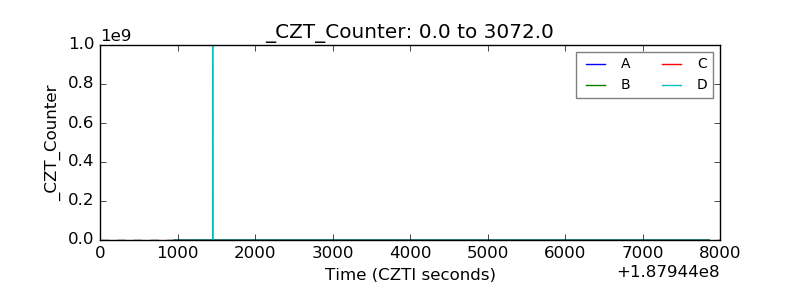 |
| +2.5 Volts monitor |  |
| +5 Volts monitor |  |
| _ROLL_ROT | 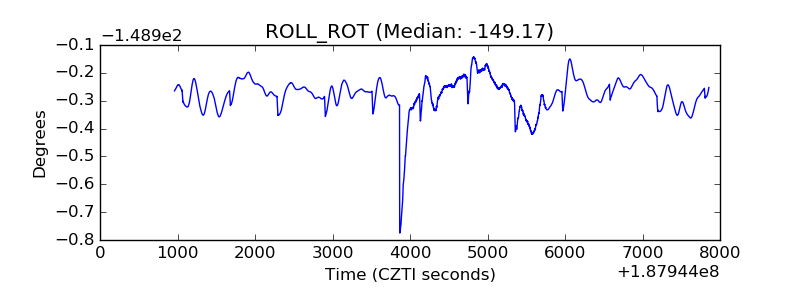 |
| _Roll_DEC | 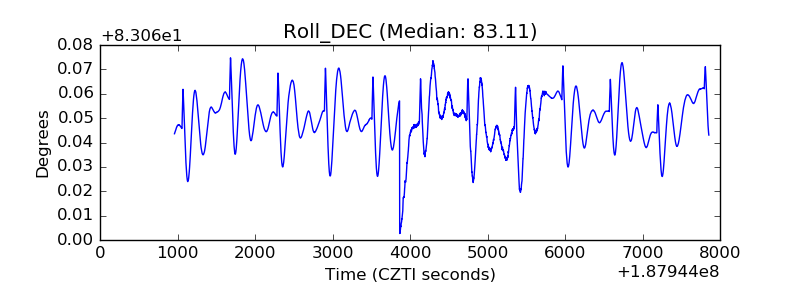 |
| _Roll_RA | 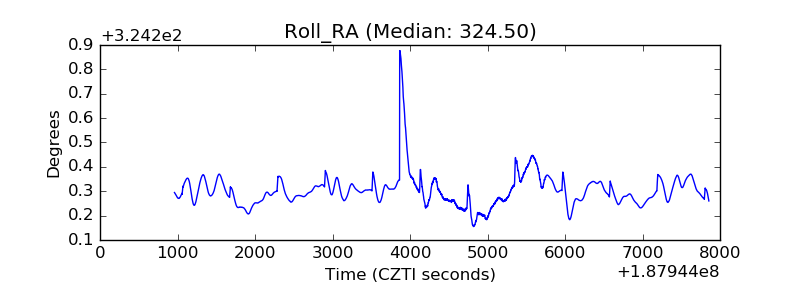 |
| Veto Counter | 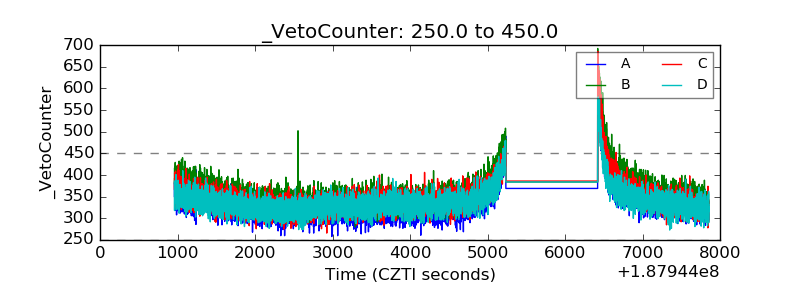 |