| Param | Original file | Final file |
|---|---|---|
| Filename | modeM0/AS1P01_997T02_9000000218_01174cztM0_level2.evt | modeM0/AS1P01_997T02_9000000218_01174cztM0_level2_quad_clean.evt |
| Size (bytes) | 1,230,292,800 | 84,479,040 |
| Size | 1.1 GB | 80.6 MB |
| Events in quadrant A | 7,237,000 | 613,921 |
| Events in quadrant B | 7,711,360 | 611,094 |
| Events in quadrant C | 7,197,729 | 584,763 |
| Events in quadrant D | 14,711,682 | 322,773 |
| Mode M9 | |||
|---|---|---|---|
| Quadrant | BADHDUFLAG | Total packets | Discarded packets |
| A | 0 | 9 | 0 |
| B | 0 | 9 | 0 |
| C | 0 | 9 | 0 |
| D | 0 | 9 | 0 |
| Mode M0 | |||
|---|---|---|---|
| Quadrant | BADHDUFLAG | Total packets | Discarded packets |
| A | 0 | 25803 | 2 |
| B | 0 | 27214 | 1 |
| C | 0 | 25702 | 1 |
| D | 0 | 48681 | 1 |
| Mode SS | |||
|---|---|---|---|
| Quadrant | BADHDUFLAG | Total packets | Discarded packets |
| A | 0 | 124 | 0 |
| B | 0 | 124 | 0 |
| C | 0 | 124 | 0 |
| D | 0 | 124 | 0 |
| Quadrant | Total seconds | Saturated seconds | Saturation percentage |
|---|---|---|---|
| A | 6066 | 23 | 0.379163% |
| B | 6066 | 16 | 0.263765% |
| C | 6066 | 11 | 0.181339% |
| D | 6066 | 3994 | 65.842400% |
Noise dominated data is calculated using 1-second bins in cleaned event files. If a bin has >2000 counts, and if more than 50% of those come from <1% of pixels, then it is considered to be noise-dominated and hence unusable.
| Quadrant | # 1 sec bins | Bins with >0 counts | Bins with >2000 counts | High rate bins dominated by noise | Noise dominated (total time) | Noise dominated (detector-on time) | Marked lightcurve |
|---|---|---|---|---|---|---|---|
| A | 7001 | 6067 | 206 | 206 | 2.94% | 3.40% | 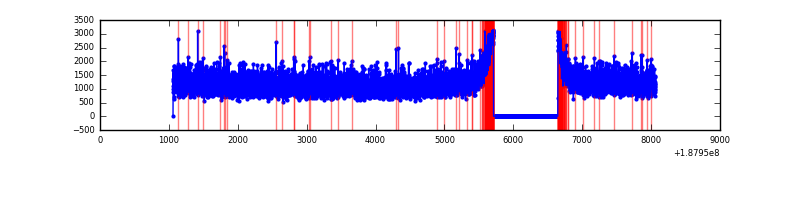 |
| B | 7000 | 6066 | 307 | 307 | 4.39% | 5.06% | 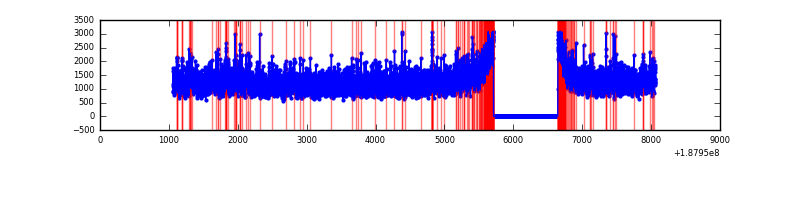 |
| C | 7001 | 6067 | 170 | 170 | 2.43% | 2.80% | 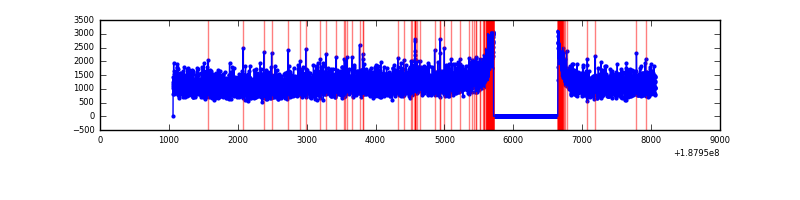 |
| D | 7001 | 6067 | 4106 | 4106 | 58.65% | 67.68% | 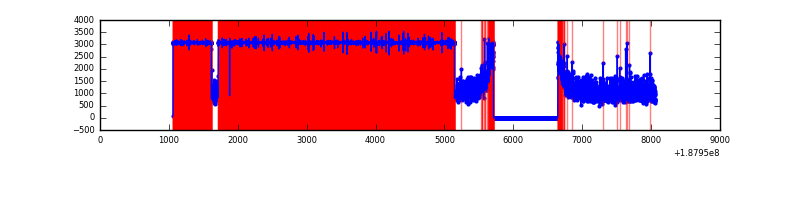 |
Top three noisy pixels from each quadrant. If the there are fewer than three noisy pixels in the level2.evt file, extra rows are filled as -1
| Pixel properties | Quadrant properties | ||||||
|---|---|---|---|---|---|---|---|
| Quadrant | DetID | PixID | Counts | Sigma | Mean | Median | Sigma |
| A | 12 | 243 | 22070 | 44.76 | 1877 | 1890 | 450.9 |
| A | 11 | 79 | 8934 | 15.62 | 1877 | 1890 | 450.9 |
| A | 3 | 111 | 6095 | 9.33 | 1877 | 1890 | 450.9 |
| B | 2 | 32 | 190324 | 413.94 | 1918 | 1929 | 455.1 |
| B | 6 | 53 | 94069 | 202.45 | 1918 | 1929 | 455.1 |
| B | 15 | 22 | 56954 | 120.9 | 1918 | 1929 | 455.1 |
| C | 15 | 241 | 295681 | 612.94 | 1727 | 1781 | 479.5 |
| C | 9 | 83 | 117240 | 240.8 | 1727 | 1781 | 479.5 |
| C | 3 | 111 | 22055 | 42.28 | 1727 | 1781 | 479.5 |
| D | 1 | 239 | 10490190 | 30249.01 | 1108 | 1141 | 346.8 |
| D | 2 | 16 | 35094 | 97.92 | 1108 | 1141 | 346.8 |
| D | 12 | 22 | 12328 | 32.26 | 1108 | 1141 | 346.8 |
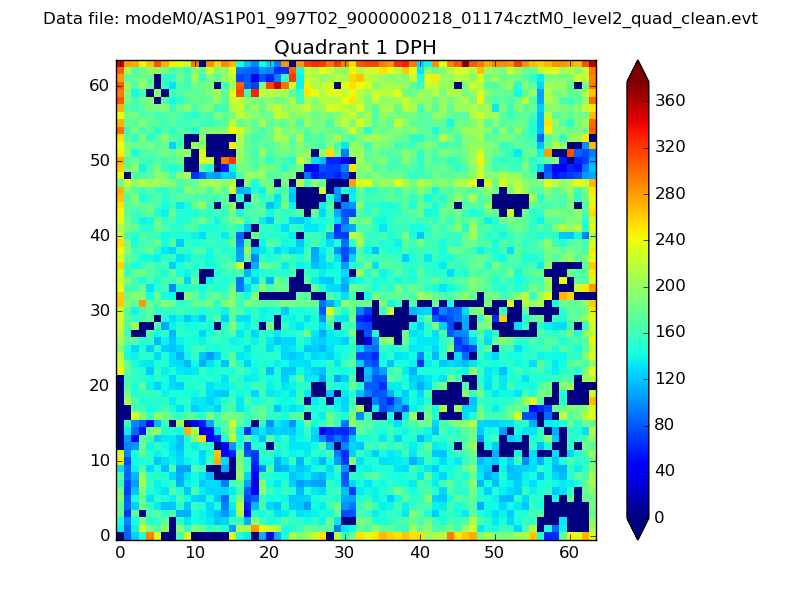
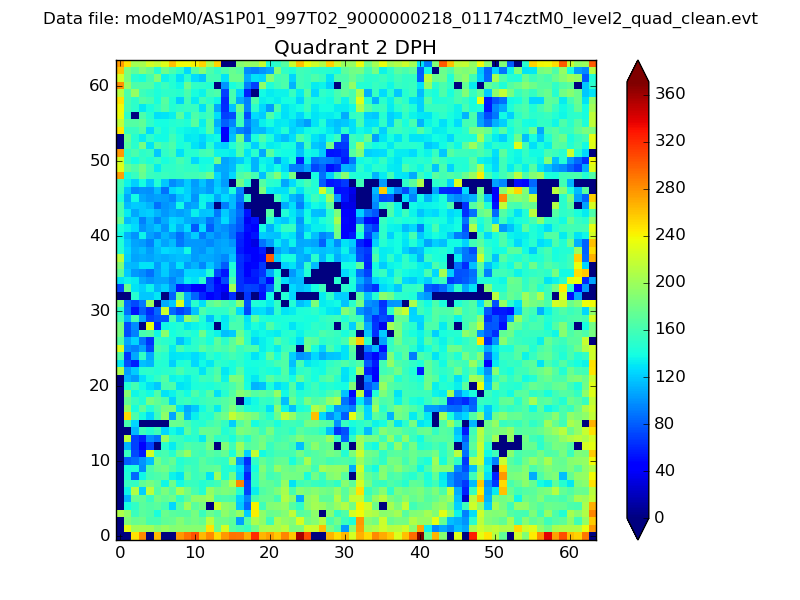
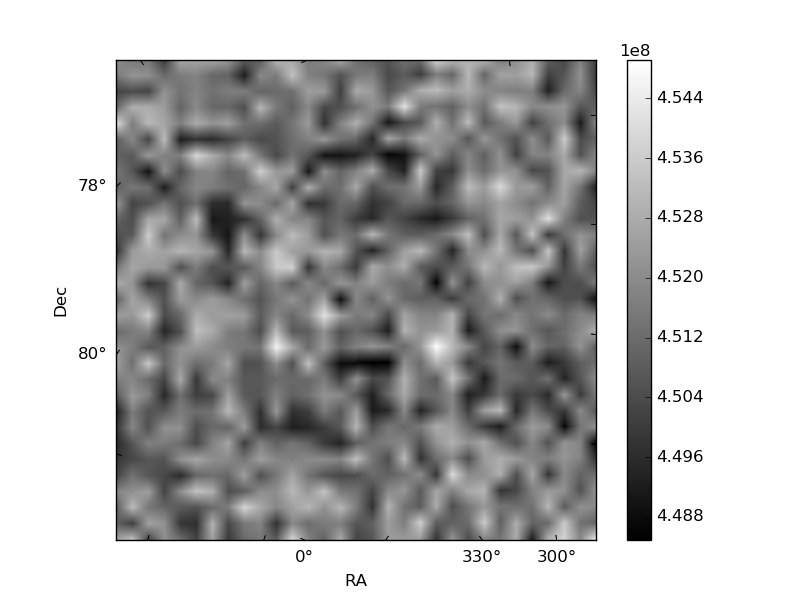
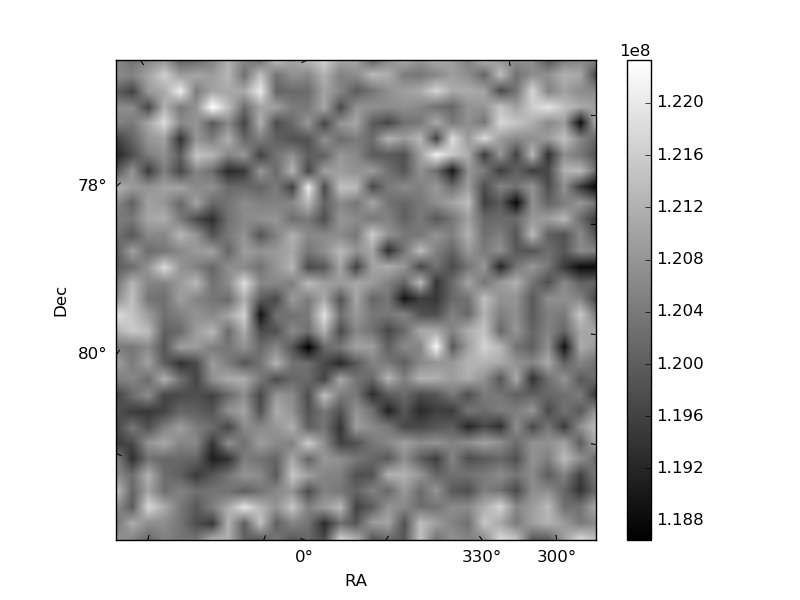
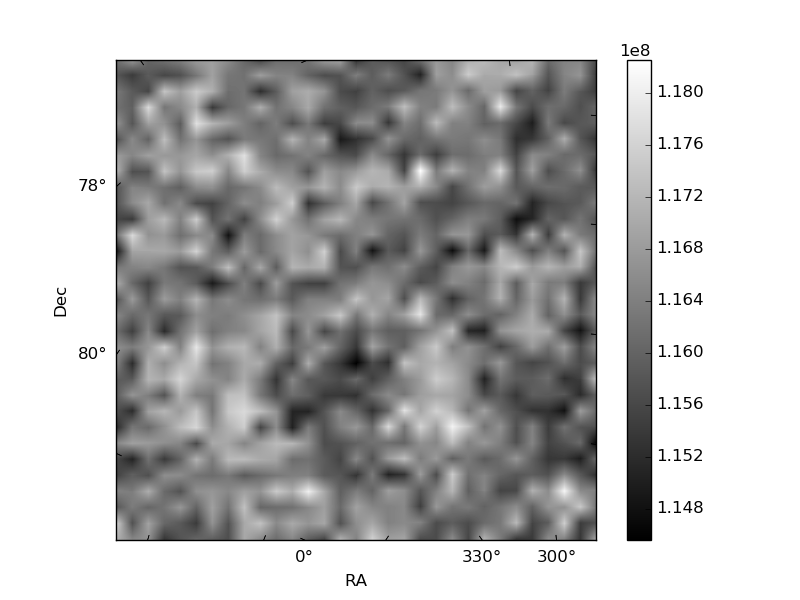
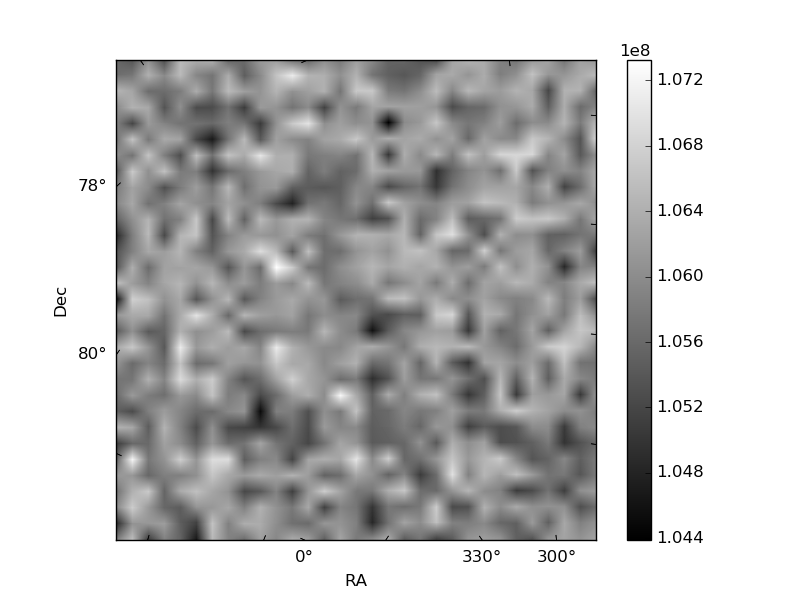
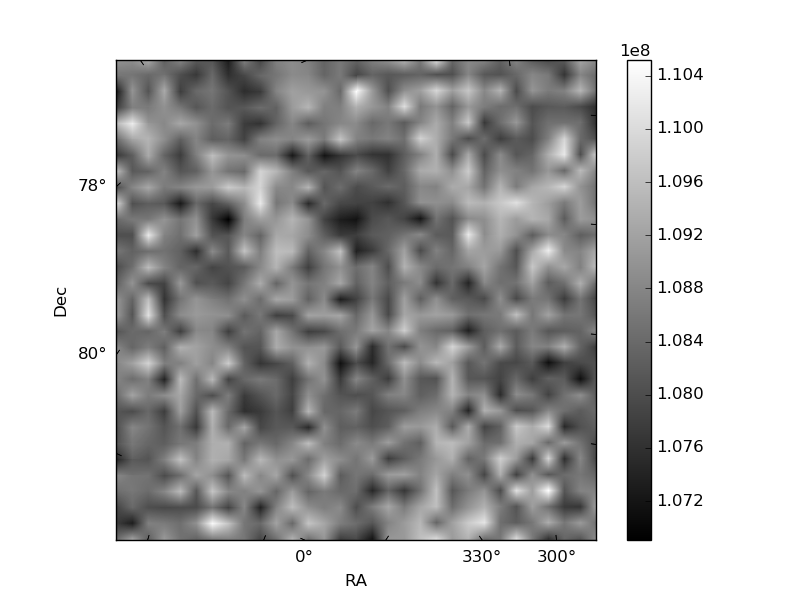
Histogram calculated using DETX and DETY for each event in the final _common_clean file
| Quadrant A |  |
 |
Quadrant B |
|---|---|---|---|
| Quadrant D | 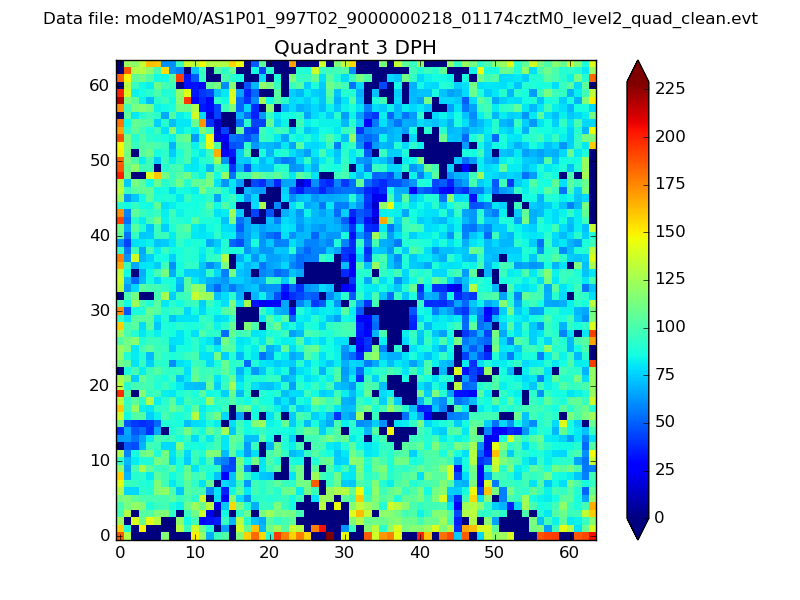 |
 |
Quadrant C |
| Plot type | Count rate plots | Images |
|---|---|---|
| Comparison with Poisson distribution Blue bars denote a histogram of data divided into 1 sec bins. Red curve is a Poisson curve with rate = median count rate of data. |
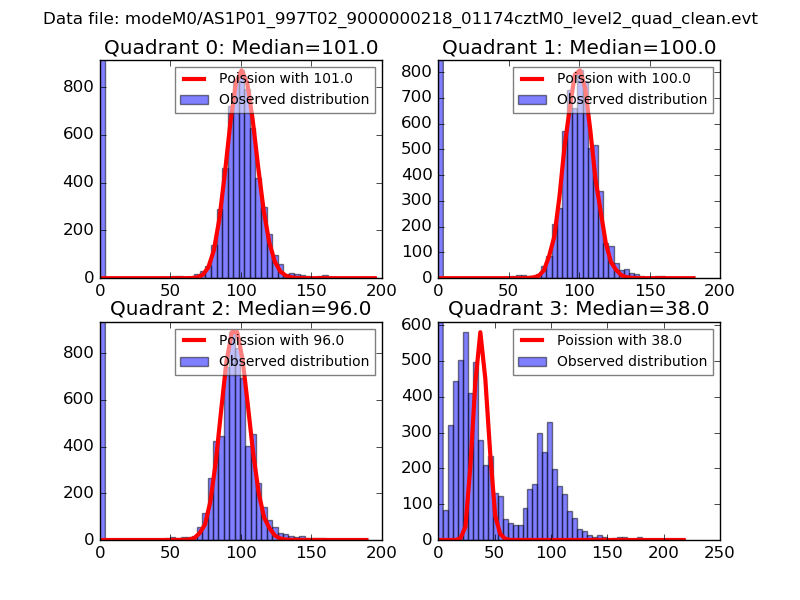 |
 |
| Quadrant-wise count rates Data is divided into 100 sec bins |
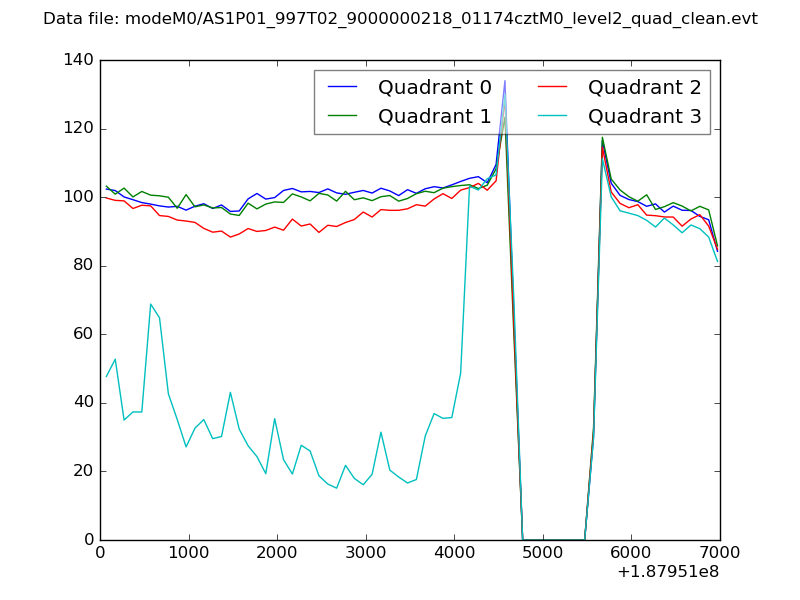 |
|
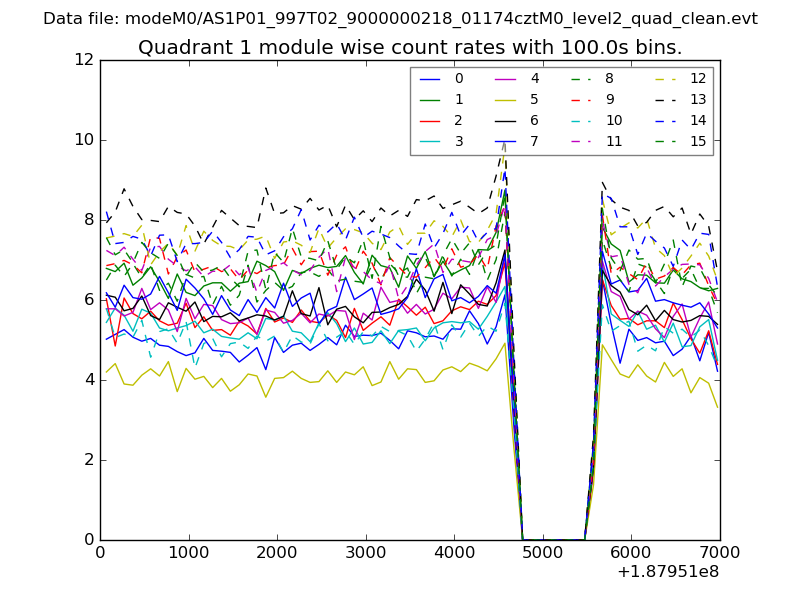
| Module-wise count rates for Quadrant A Data is divided into 100 sec bins |
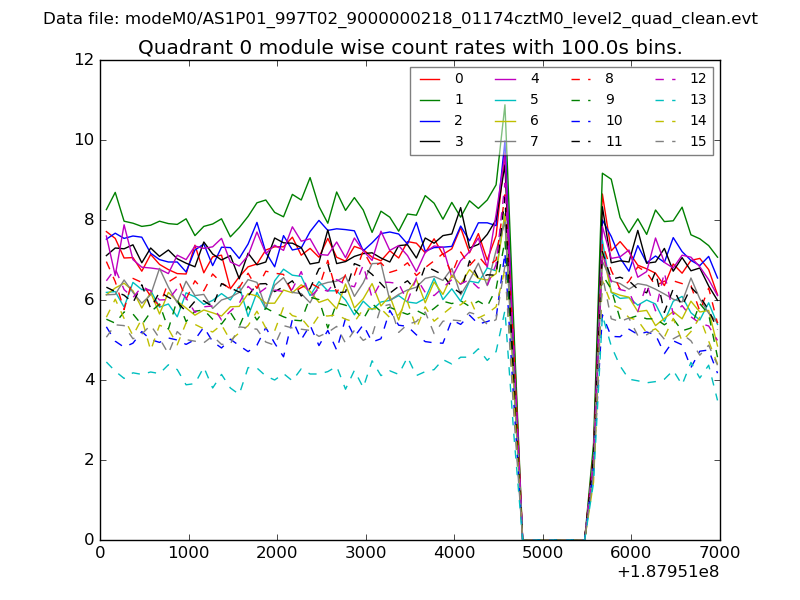 |
 |
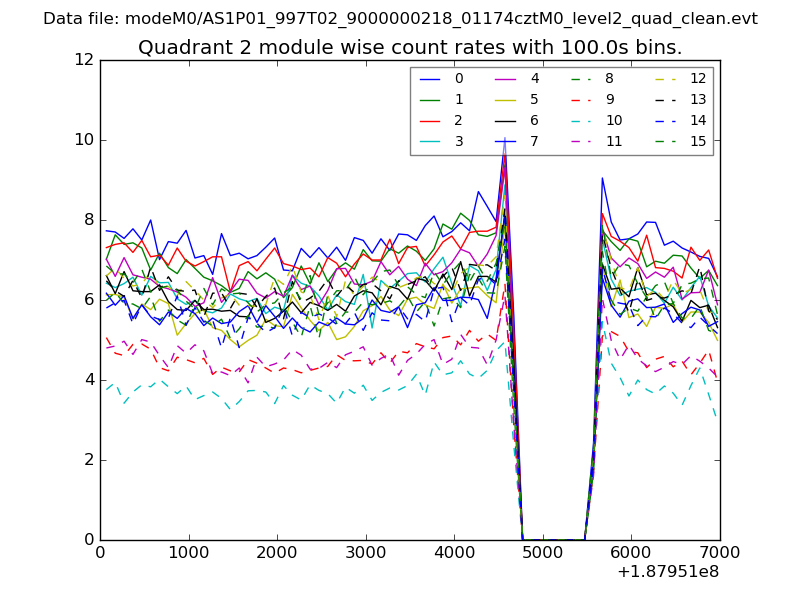
| Module-wise count rates for Quadrant B Data is divided into 100 sec bins |
 |
 |
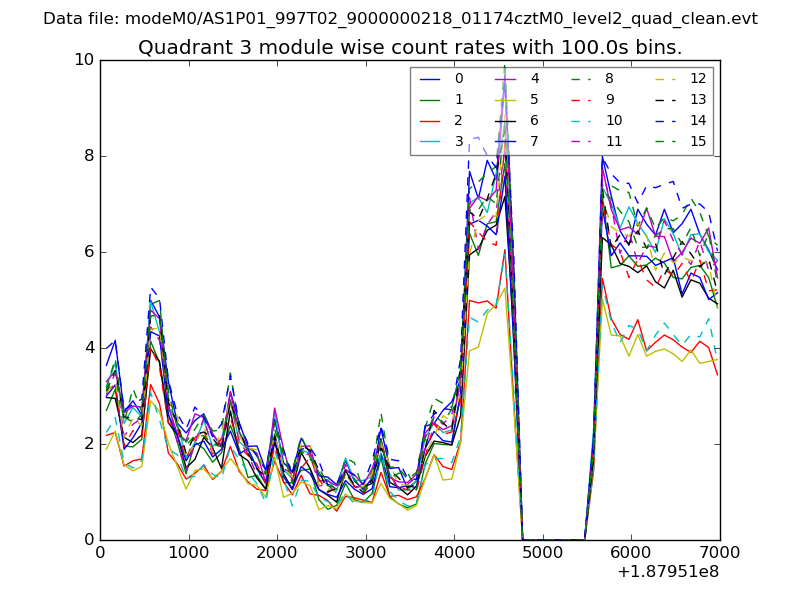
| Module-wise count rates for Quadrant C Data is divided into 100 sec bins |
 |
 |
| Module-wise count rates for Quadrant D Data is divided into 100 sec bins |
 |
 |
| Parameter | Plot |
|---|---|
| CZT HV Monitor | 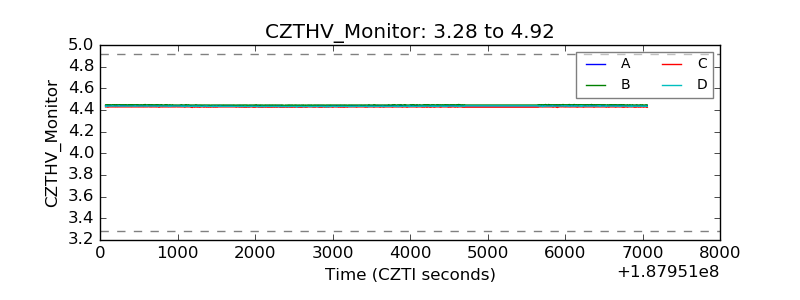 |
| D_VDD | 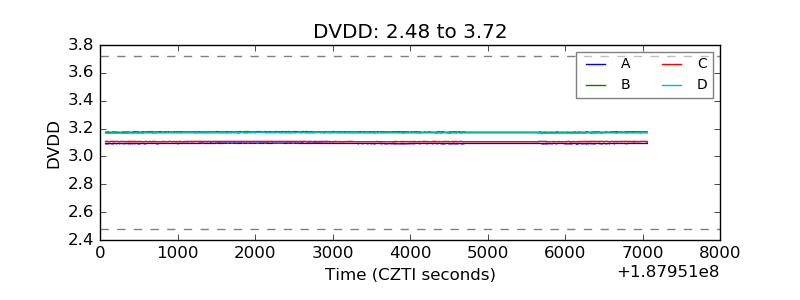 |
| Temperature 1 | 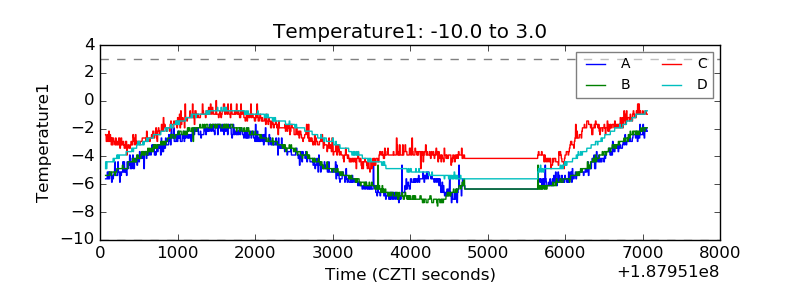 |
| Veto HV Monitor | 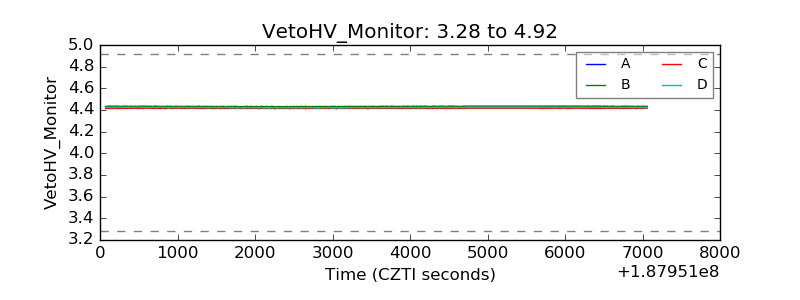 |
| Veto LLD |  |
| Alpha Counter | 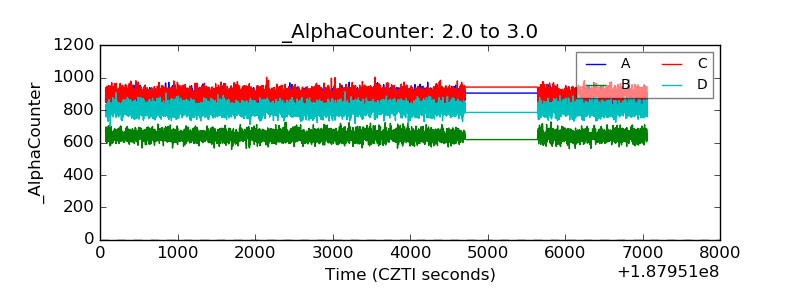 |
| _CPM_Rate | 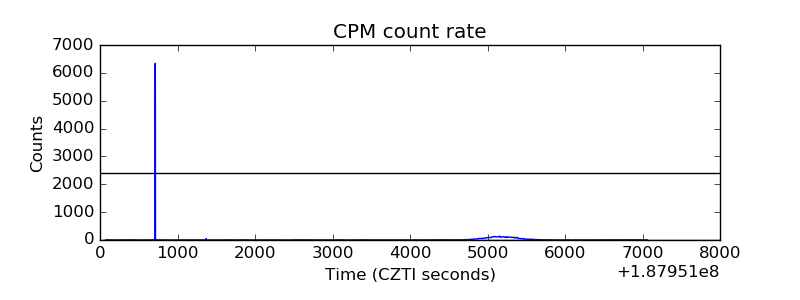 |
| CZT Counter | 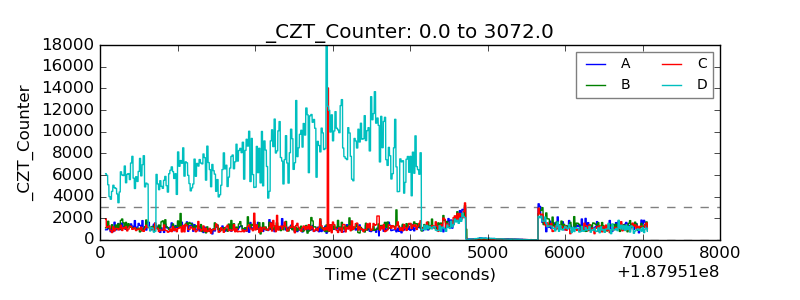 |
| +2.5 Volts monitor |  |
| +5 Volts monitor |  |
| _ROLL_ROT | 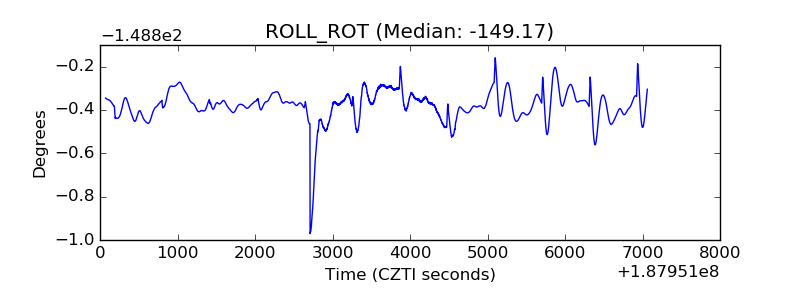 |
| _Roll_DEC | 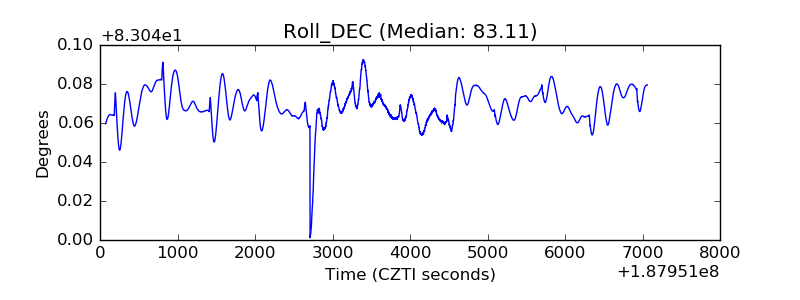 |
| _Roll_RA | 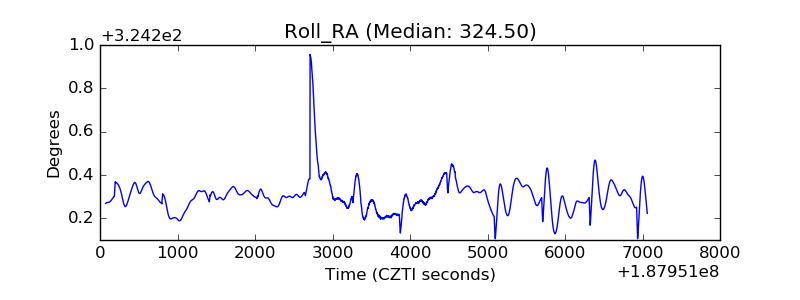 |
| Veto Counter | 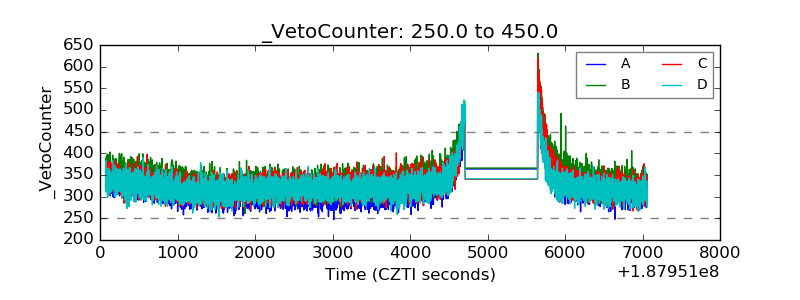 |