| Param | Original file | Final file |
|---|---|---|
| Filename | modeM0/AS1P01_997T02_9000000218_01176cztM0_level2.evt | modeM0/AS1P01_997T02_9000000218_01176cztM0_level2_quad_clean.evt |
| Size (bytes) | 1,367,357,760 | 110,903,040 |
| Size | 1.3 GB | 105.8 MB |
| Events in quadrant A | 9,136,957 | 740,083 |
| Events in quadrant B | 9,638,061 | 737,579 |
| Events in quadrant C | 9,121,703 | 711,874 |
| Events in quadrant D | 13,015,800 | 644,243 |
| Mode M0 | |||
|---|---|---|---|
| Quadrant | BADHDUFLAG | Total packets | Discarded packets |
| A | 0 | 32536 | 1 |
| B | 0 | 33971 | 0 |
| C | 0 | 32415 | 0 |
| D | 0 | 44344 | 0 |
| Mode SS | |||
|---|---|---|---|
| Quadrant | BADHDUFLAG | Total packets | Discarded packets |
| A | 0 | 152 | 0 |
| B | 0 | 152 | 0 |
| C | 0 | 152 | 0 |
| D | 0 | 152 | 0 |
| Quadrant | Total seconds | Saturated seconds | Saturation percentage |
|---|---|---|---|
| A | 7529 | 10 | 0.132820% |
| B | 7529 | 9 | 0.119538% |
| C | 7529 | 12 | 0.159384% |
| D | 7529 | 2064 | 27.413999% |
Noise dominated data is calculated using 1-second bins in cleaned event files. If a bin has >2000 counts, and if more than 50% of those come from <1% of pixels, then it is considered to be noise-dominated and hence unusable.
| Quadrant | # 1 sec bins | Bins with >0 counts | Bins with >2000 counts | High rate bins dominated by noise | Noise dominated (total time) | Noise dominated (detector-on time) | Marked lightcurve |
|---|---|---|---|---|---|---|---|
| A | 7529 | 7529 | 364 | 364 | 4.83% | 4.83% |  |
| B | 7529 | 7529 | 407 | 407 | 5.41% | 5.41% | 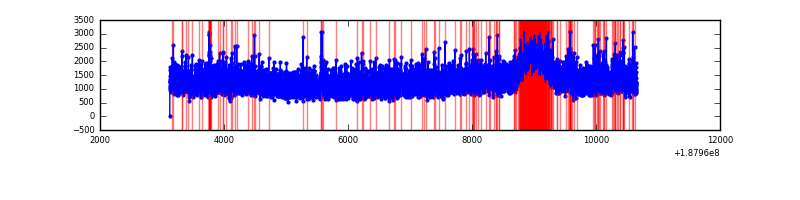 |
| C | 7529 | 7529 | 307 | 307 | 4.08% | 4.08% |  |
| D | 7529 | 7529 | 2634 | 2634 | 34.98% | 34.98% |  |
Top three noisy pixels from each quadrant. If the there are fewer than three noisy pixels in the level2.evt file, extra rows are filled as -1
| Pixel properties | Quadrant properties | ||||||
|---|---|---|---|---|---|---|---|
| Quadrant | DetID | PixID | Counts | Sigma | Mean | Median | Sigma |
| A | 11 | 79 | 8788 | 11.12 | 2378 | 2392 | 575.1 |
| A | 3 | 111 | 7579 | 9.02 | 2378 | 2392 | 575.1 |
| A | 12 | 251 | 7290 | 8.52 | 2378 | 2392 | 575.1 |
| B | 2 | 32 | 114310 | 192.27 | 2451 | 2466 | 581.7 |
| B | 15 | 22 | 45730 | 74.37 | 2451 | 2466 | 581.7 |
| B | 6 | 53 | 43899 | 71.23 | 2451 | 2466 | 581.7 |
| C | 15 | 241 | 344507 | 549.48 | 2228 | 2304 | 622.8 |
| C | 3 | 79 | 31204 | 46.4 | 2228 | 2304 | 622.8 |
| C | 3 | 111 | 30290 | 44.94 | 2228 | 2304 | 622.8 |
| D | 1 | 239 | 5009656 | 7840.7 | 2064 | 2143 | 638.7 |
| D | 13 | 73 | 113445 | 174.28 | 2064 | 2143 | 638.7 |
| D | 2 | 16 | 87143 | 133.09 | 2064 | 2143 | 638.7 |
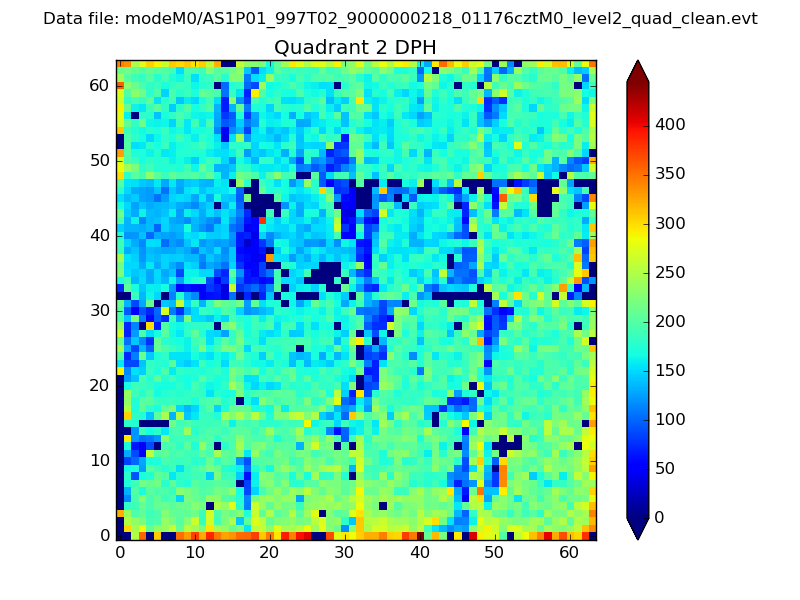
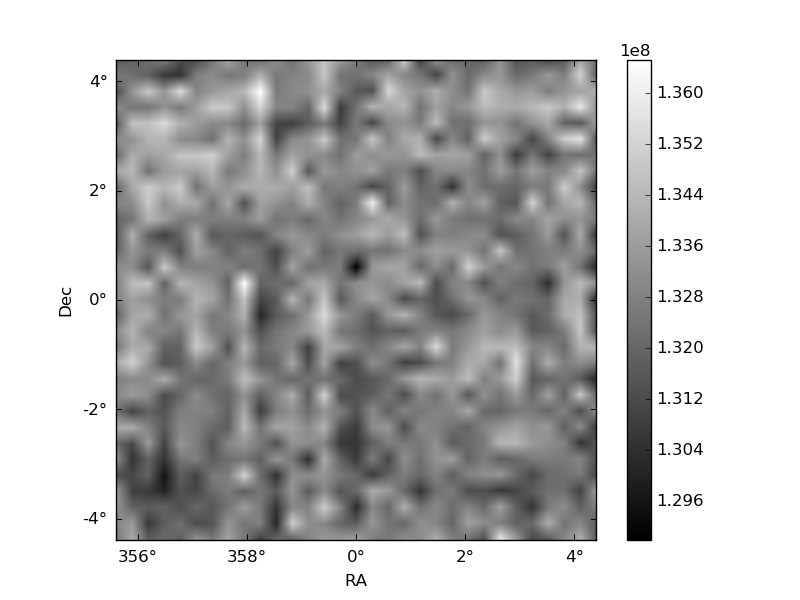
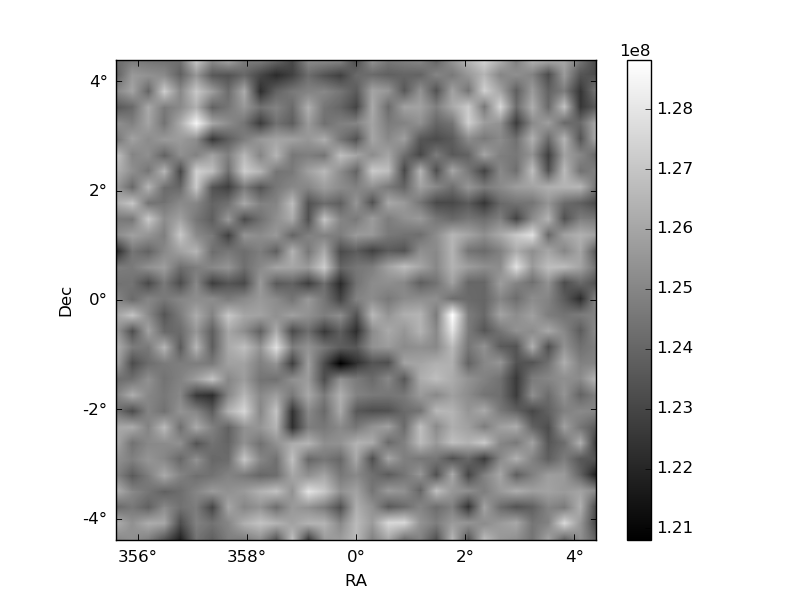
Histogram calculated using DETX and DETY for each event in the final _common_clean file
| Quadrant A | 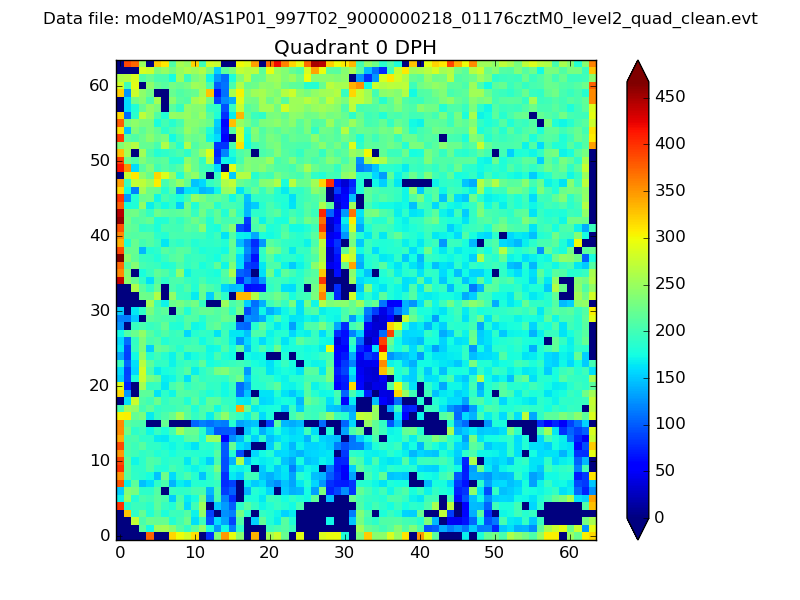 |
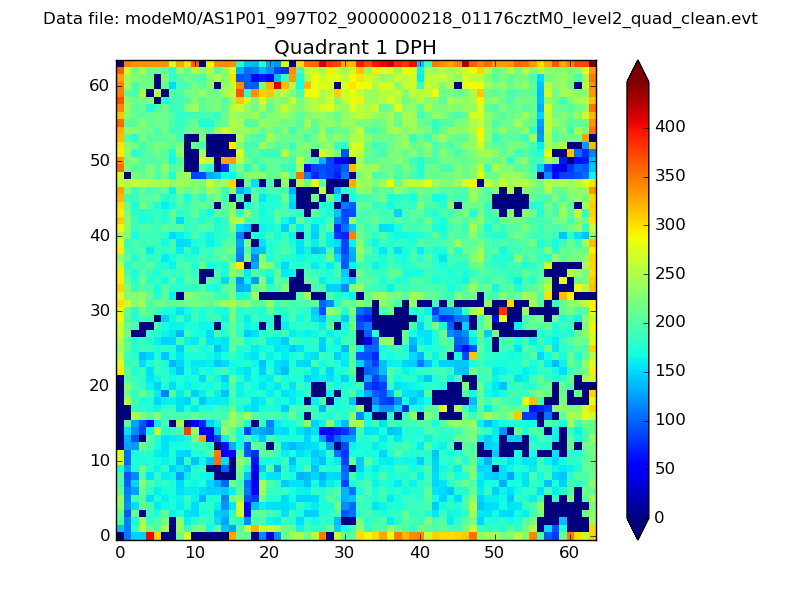 |
Quadrant B |
|---|---|---|---|
| Quadrant D | 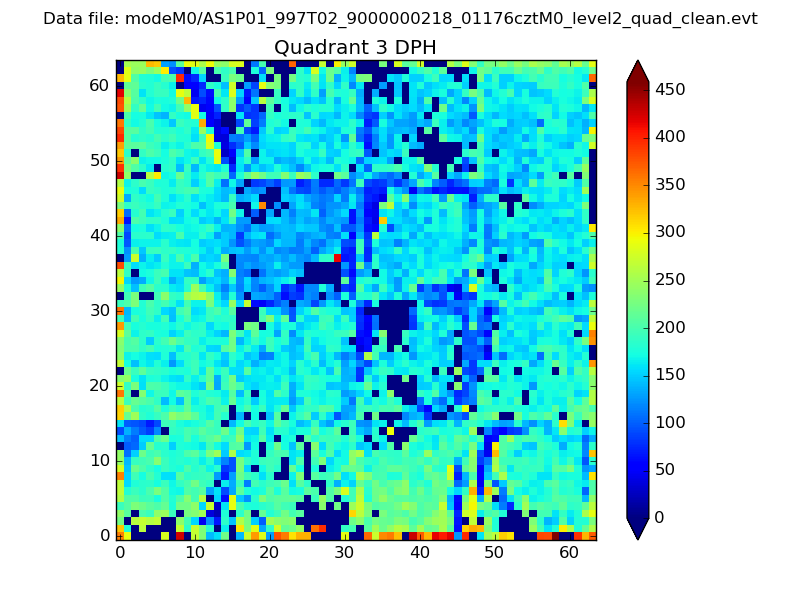 |
 |
Quadrant C |
| Plot type | Count rate plots | Images |
|---|---|---|
| Comparison with Poisson distribution Blue bars denote a histogram of data divided into 1 sec bins. Red curve is a Poisson curve with rate = median count rate of data. |
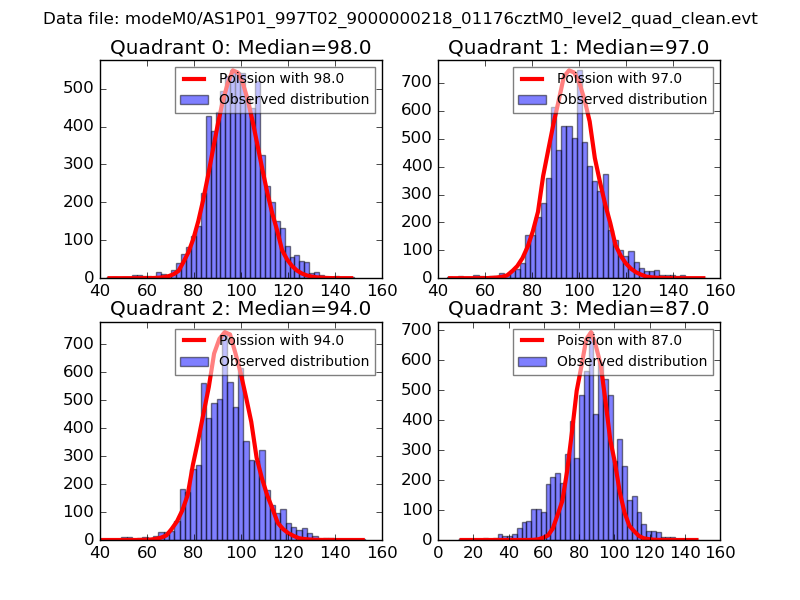 |
 |
| Quadrant-wise count rates Data is divided into 100 sec bins |
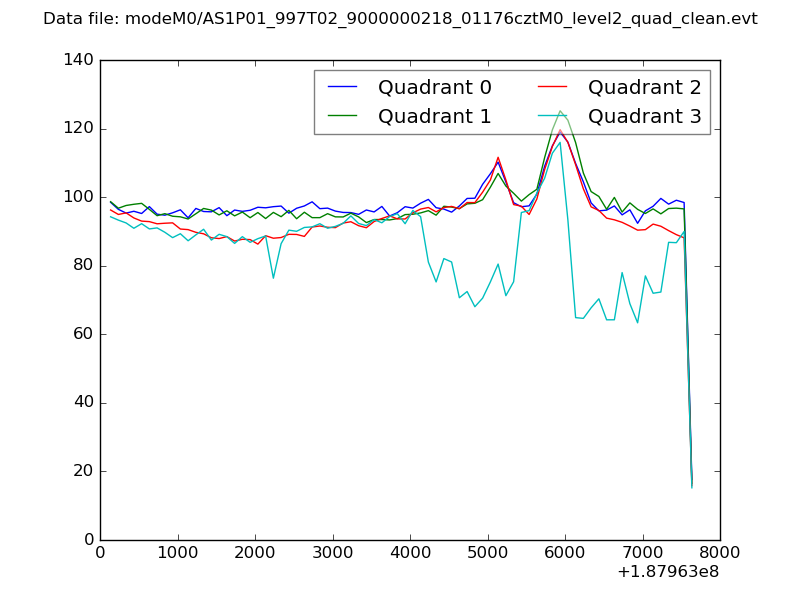 |
|
| Module-wise count rates for Quadrant A Data is divided into 100 sec bins |
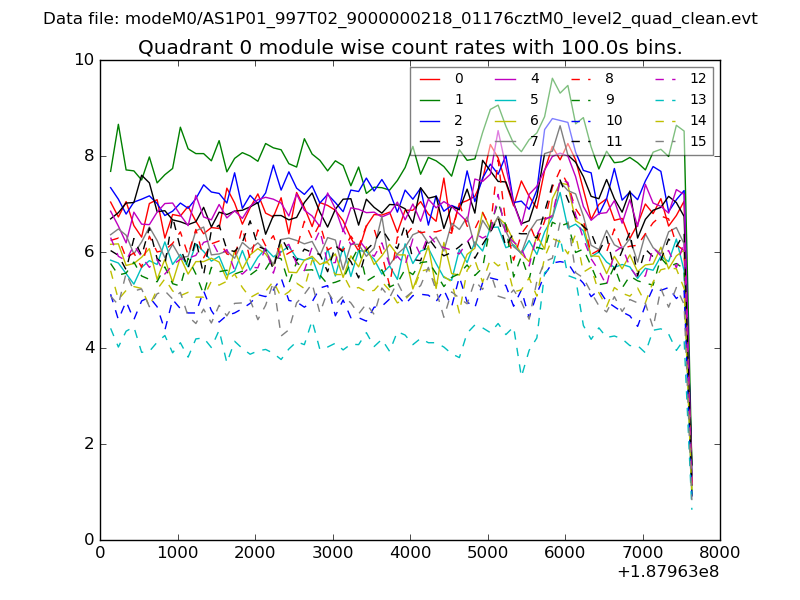 |
 |
| Module-wise count rates for Quadrant B Data is divided into 100 sec bins |
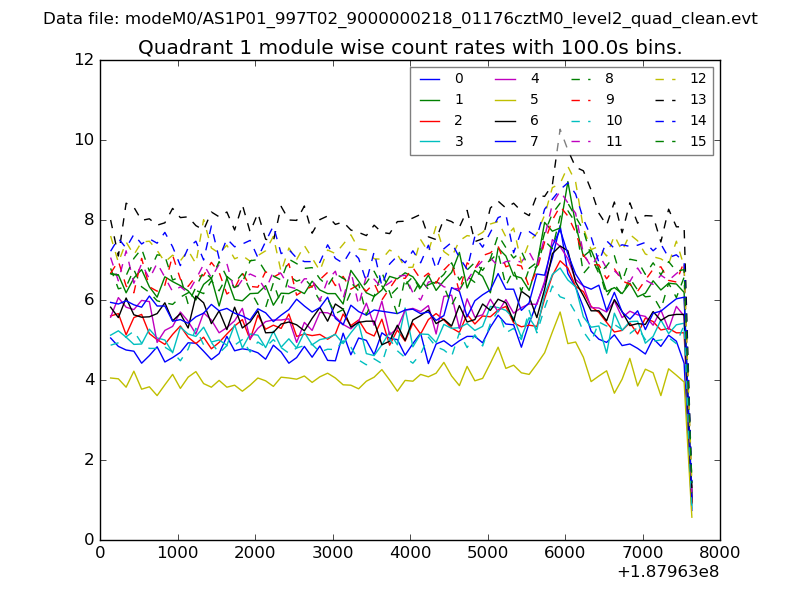 |
 |
| Module-wise count rates for Quadrant C Data is divided into 100 sec bins |
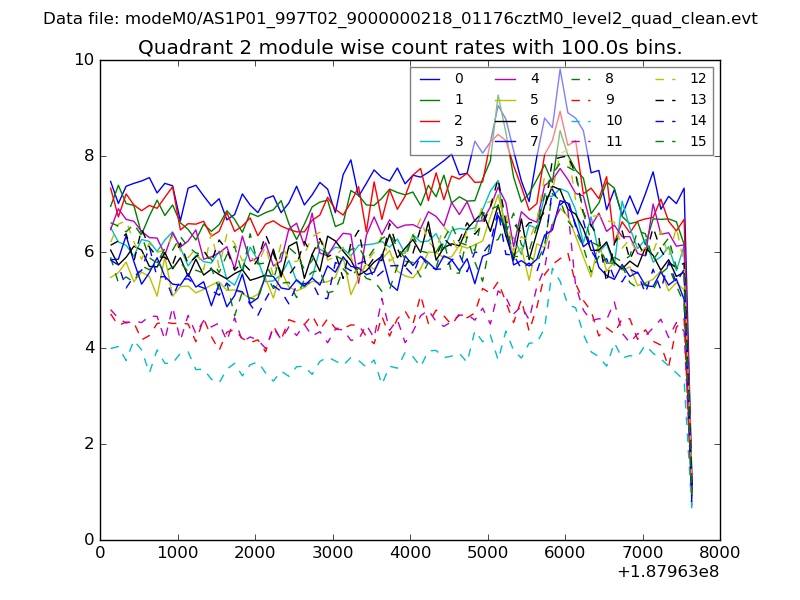 |
 |
| Module-wise count rates for Quadrant D Data is divided into 100 sec bins |
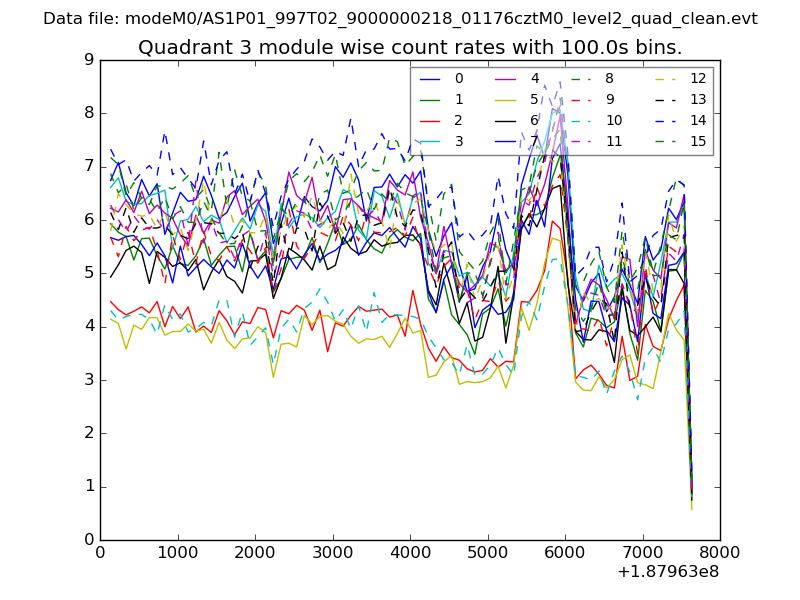 |
 |
| Parameter | Plot |
|---|---|
| CZT HV Monitor | 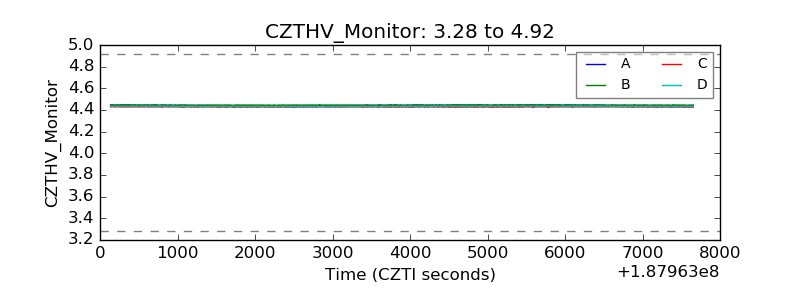 |
| D_VDD | 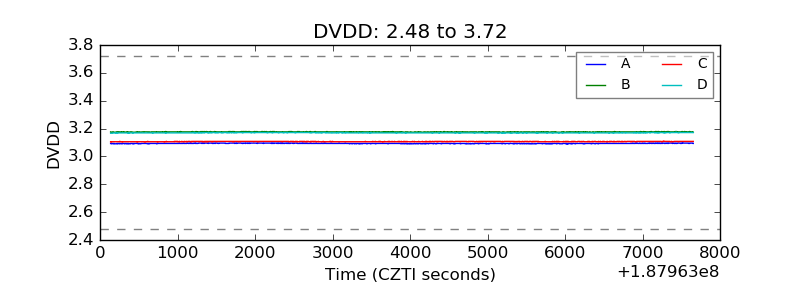 |
| Temperature 1 | 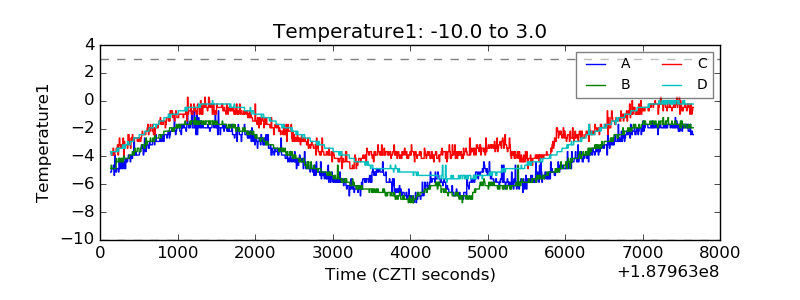 |
| Veto HV Monitor | 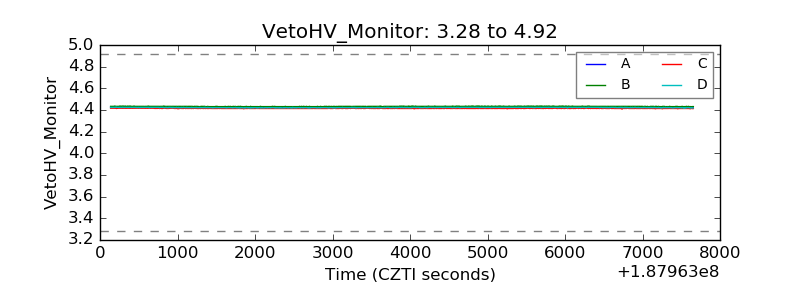 |
| Veto LLD |  |
| Alpha Counter | 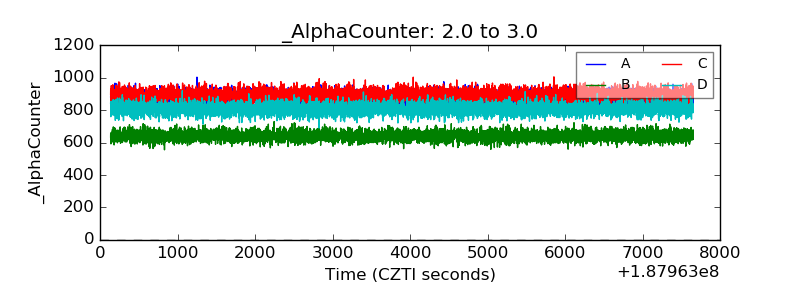 |
| _CPM_Rate | 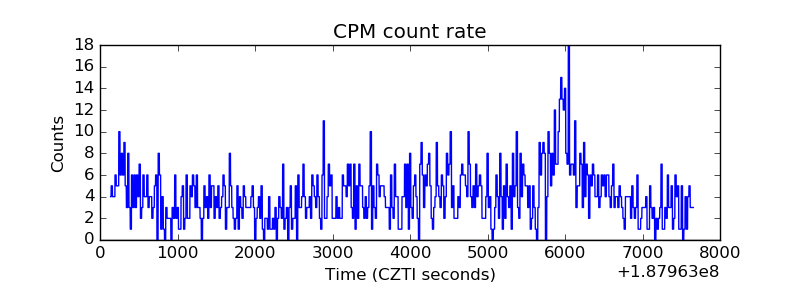 |
| CZT Counter | 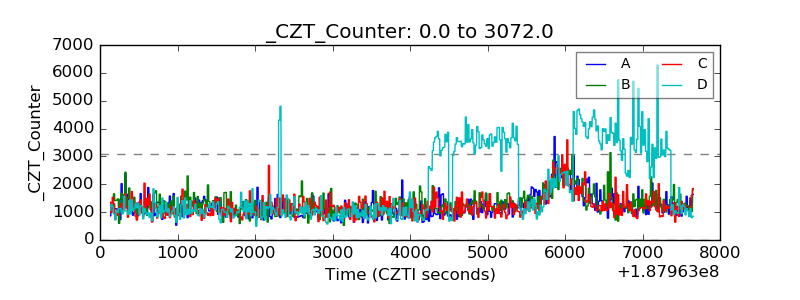 |
| +2.5 Volts monitor |  |
| +5 Volts monitor |  |
| _ROLL_ROT | 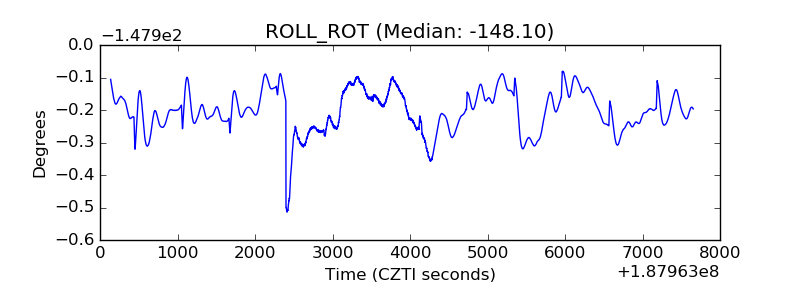 |
| _Roll_DEC | 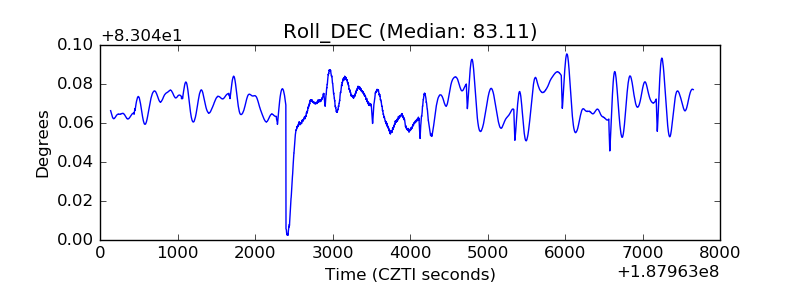 |
| _Roll_RA | 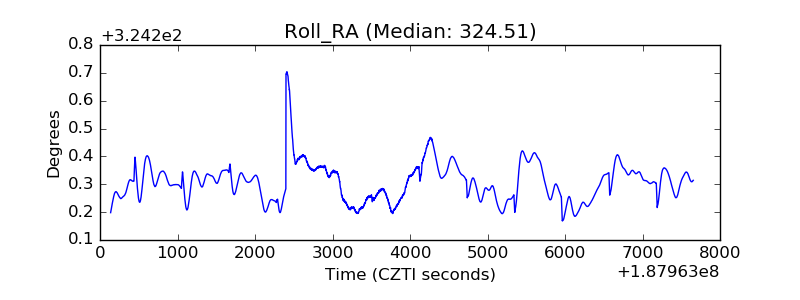 |
| Veto Counter | 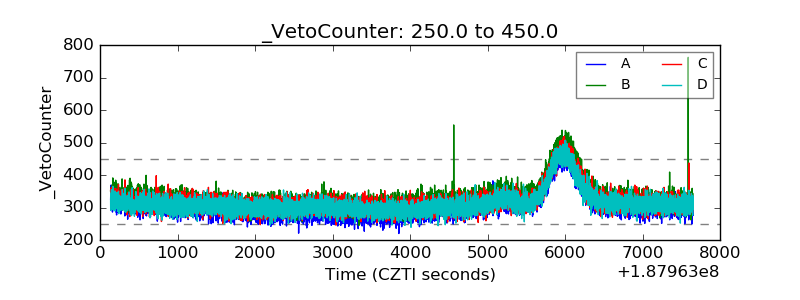 |