| Param | Original file | Final file |
|---|---|---|
| Filename | modeM0/AS1P01_997T02_9000000218_01177cztM0_level2.evt | modeM0/AS1P01_997T02_9000000218_01177cztM0_level2_quad_clean.evt |
| Size (bytes) | 1,354,380,480 | 105,148,800 |
| Size | 1.3 GB | 100.3 MB |
| Events in quadrant A | 8,674,712 | 709,480 |
| Events in quadrant B | 9,319,171 | 702,612 |
| Events in quadrant C | 8,773,156 | 677,331 |
| Events in quadrant D | 13,773,156 | 590,577 |
| Mode M0 | |||
|---|---|---|---|
| Quadrant | BADHDUFLAG | Total packets | Discarded packets |
| A | 0 | 30927 | 1 |
| B | 0 | 32770 | 0 |
| C | 0 | 31209 | 0 |
| D | 0 | 46243 | 0 |
| Mode SS | |||
|---|---|---|---|
| Quadrant | BADHDUFLAG | Total packets | Discarded packets |
| A | 0 | 144 | 0 |
| B | 0 | 144 | 0 |
| C | 0 | 144 | 0 |
| D | 0 | 144 | 0 |
| Quadrant | Total seconds | Saturated seconds | Saturation percentage |
|---|---|---|---|
| A | 7236 | 2 | 0.027640% |
| B | 7236 | 57 | 0.787728% |
| C | 7236 | 5 | 0.069099% |
| D | 7236 | 1616 | 22.332781% |
Noise dominated data is calculated using 1-second bins in cleaned event files. If a bin has >2000 counts, and if more than 50% of those come from <1% of pixels, then it is considered to be noise-dominated and hence unusable.
| Quadrant | # 1 sec bins | Bins with >0 counts | Bins with >2000 counts | High rate bins dominated by noise | Noise dominated (total time) | Noise dominated (detector-on time) | Marked lightcurve |
|---|---|---|---|---|---|---|---|
| A | 7236 | 7236 | 286 | 286 | 3.95% | 3.95% | 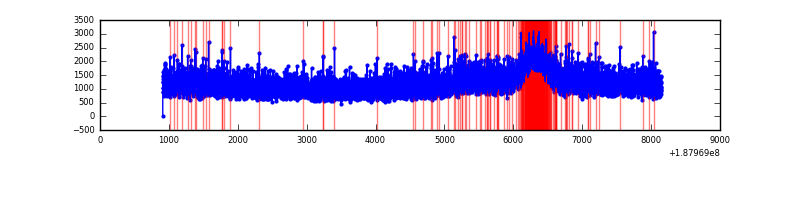 |
| B | 7236 | 7236 | 429 | 429 | 5.93% | 5.93% | 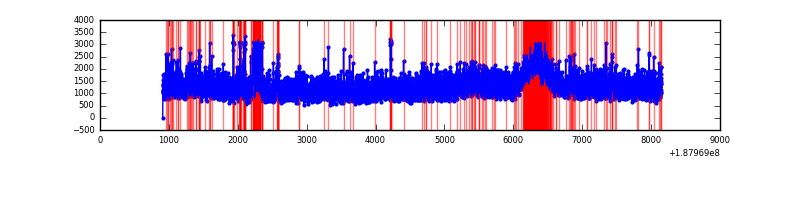 |
| C | 7236 | 7236 | 290 | 290 | 4.01% | 4.01% | 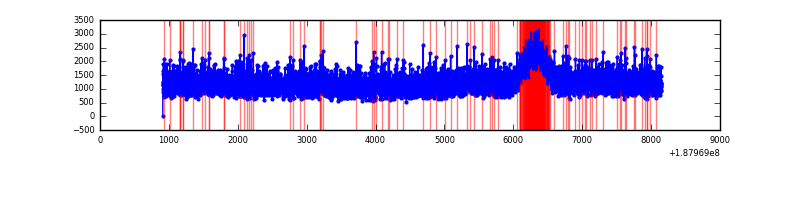 |
| D | 7236 | 7236 | 3177 | 3177 | 43.91% | 43.91% | 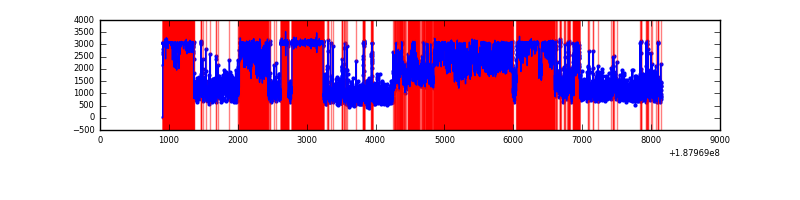 |
Top three noisy pixels from each quadrant. If the there are fewer than three noisy pixels in the level2.evt file, extra rows are filled as -1
| Pixel properties | Quadrant properties | ||||||
|---|---|---|---|---|---|---|---|
| Quadrant | DetID | PixID | Counts | Sigma | Mean | Median | Sigma |
| A | 13 | 9 | 12591 | 18.9 | 2255 | 2272 | 546.0 |
| A | 11 | 79 | 9792 | 13.77 | 2255 | 2272 | 546.0 |
| A | 12 | 243 | 8966 | 12.26 | 2255 | 2272 | 546.0 |
| B | 5 | 191 | 194087 | 348.11 | 2330 | 2344 | 550.8 |
| B | 6 | 53 | 111419 | 198.02 | 2330 | 2344 | 550.8 |
| B | 15 | 22 | 28891 | 48.2 | 2330 | 2344 | 550.8 |
| C | 15 | 241 | 334953 | 557.79 | 2130 | 2205 | 596.5 |
| C | 9 | 83 | 39725 | 62.9 | 2130 | 2205 | 596.5 |
| C | 3 | 79 | 39555 | 62.61 | 2130 | 2205 | 596.5 |
| D | 1 | 239 | 5896774 | 9939.78 | 1922 | 1995 | 593.0 |
| D | 13 | 252 | 393961 | 660.93 | 1922 | 1995 | 593.0 |
| D | 14 | 50 | 144330 | 240.01 | 1922 | 1995 | 593.0 |
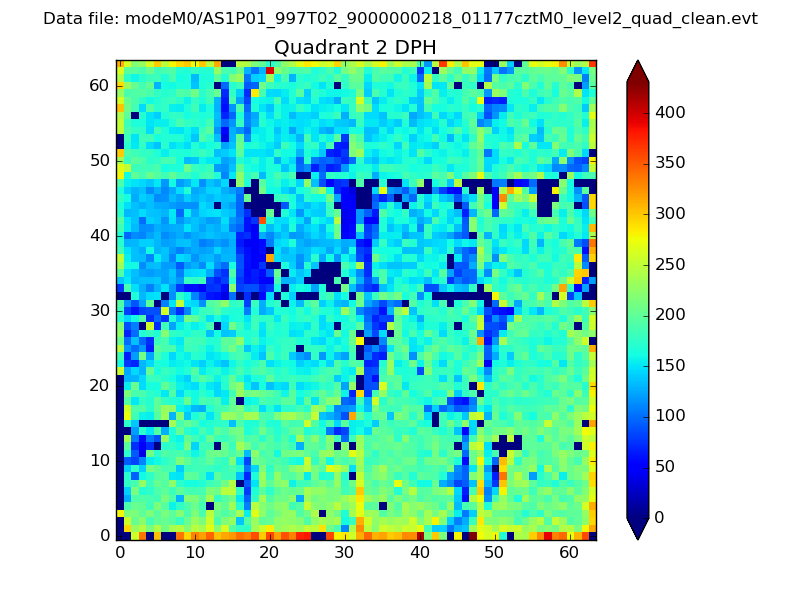
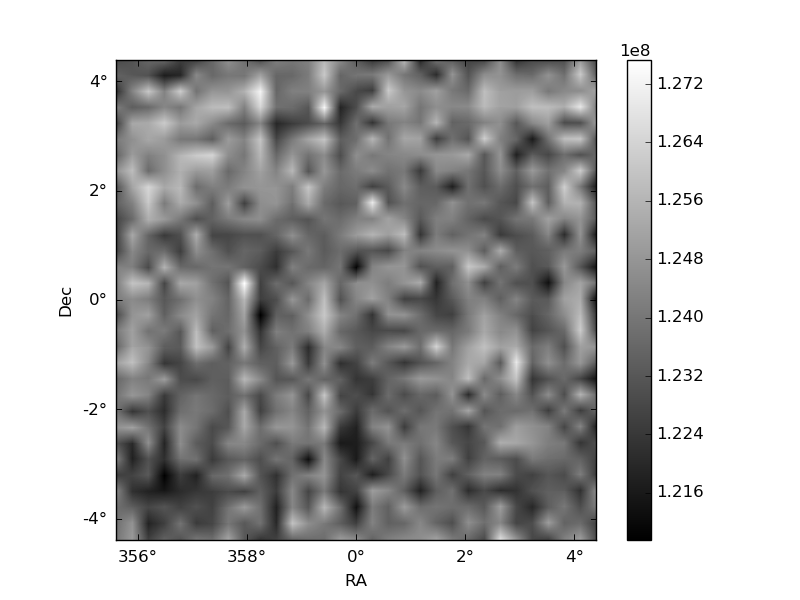
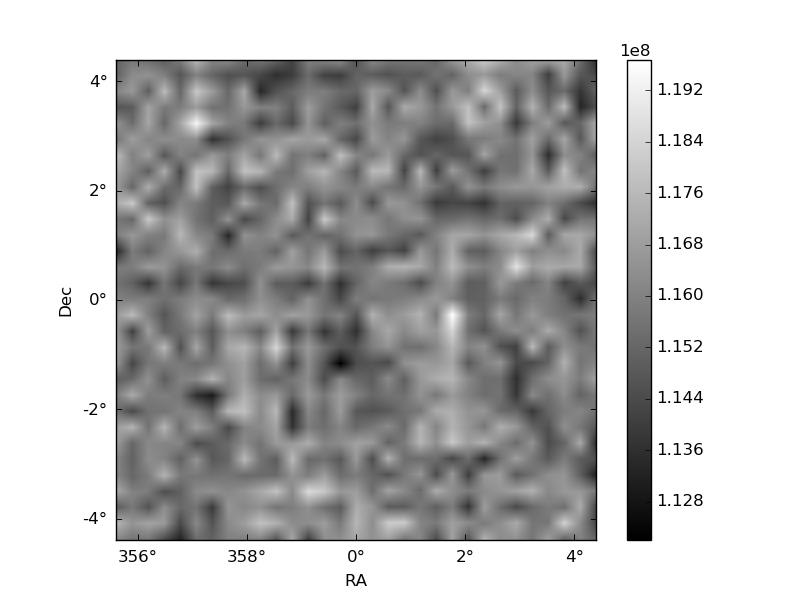
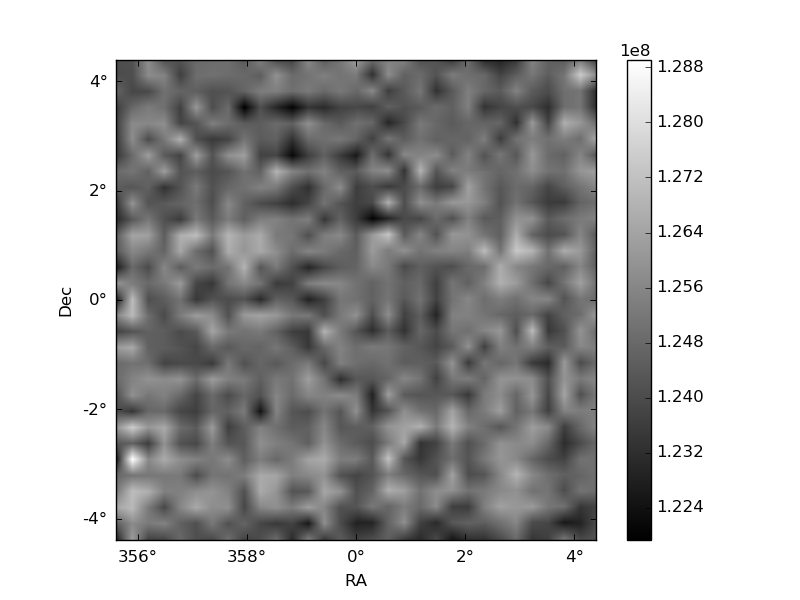
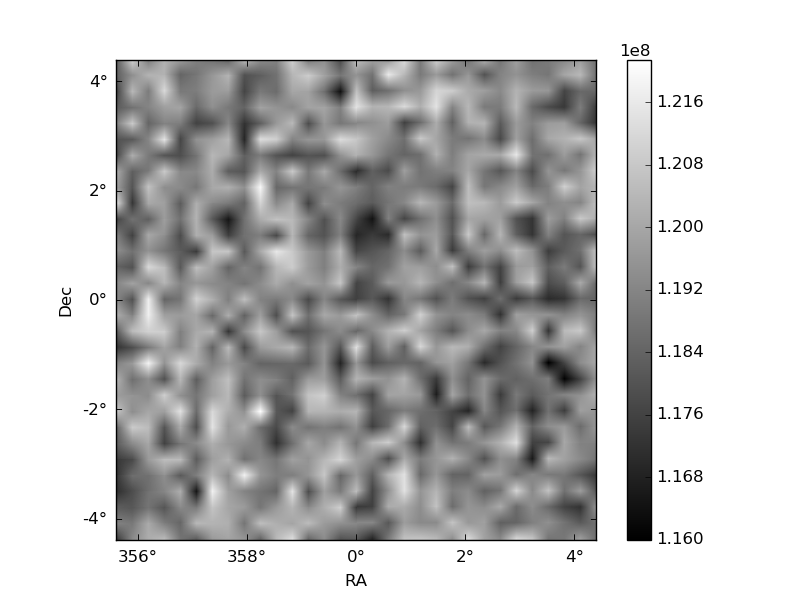
Histogram calculated using DETX and DETY for each event in the final _common_clean file
| Quadrant A | 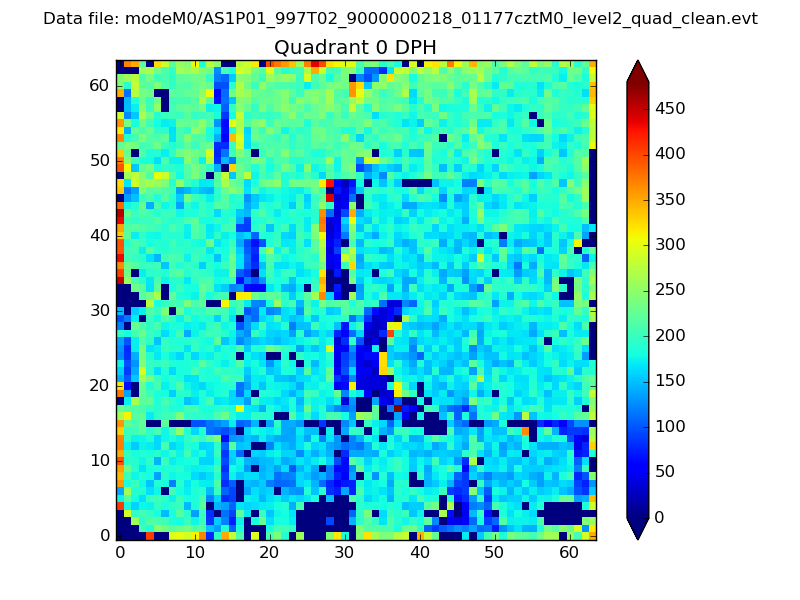 |
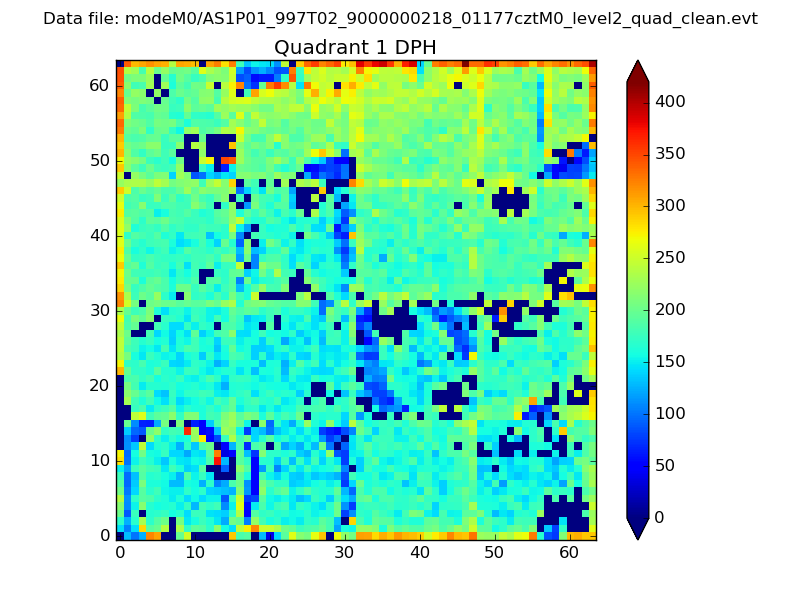 |
Quadrant B |
|---|---|---|---|
| Quadrant D | 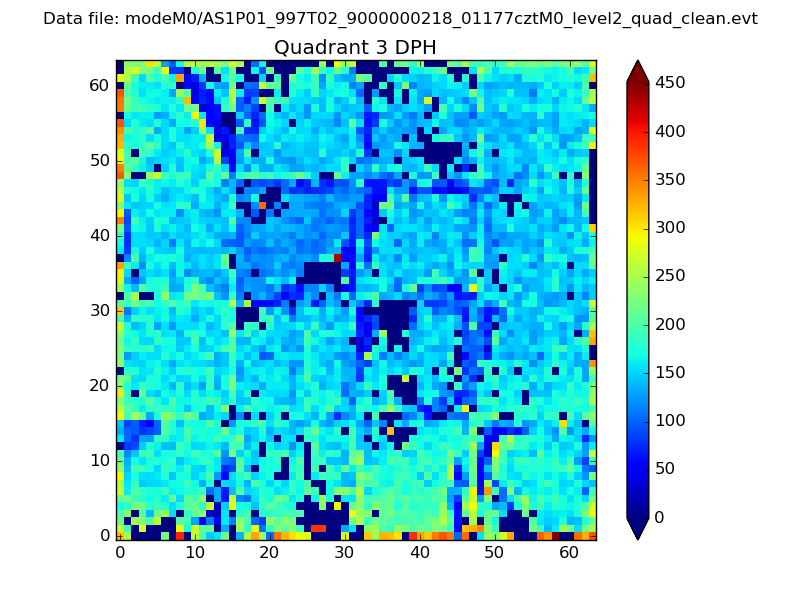 |
 |
Quadrant C |
| Plot type | Count rate plots | Images |
|---|---|---|
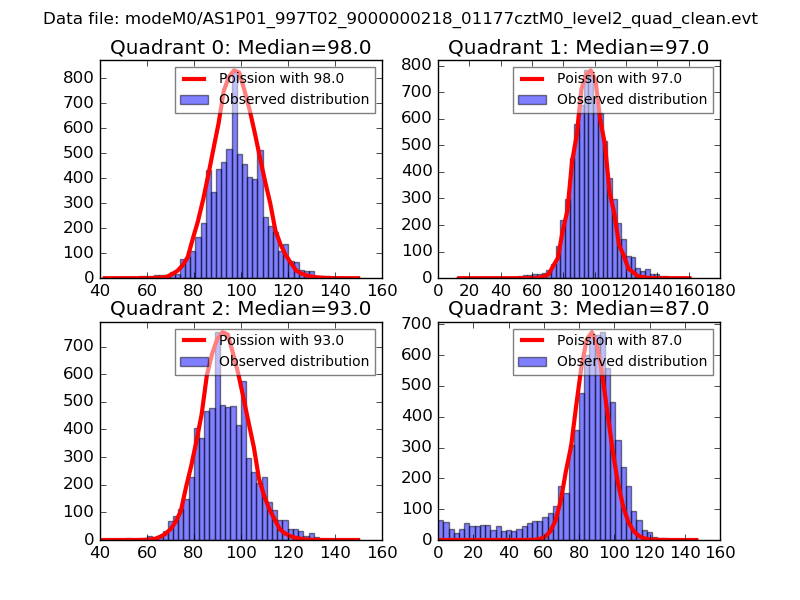
| Comparison with Poisson distribution Blue bars denote a histogram of data divided into 1 sec bins. Red curve is a Poisson curve with rate = median count rate of data. |
 |
 |
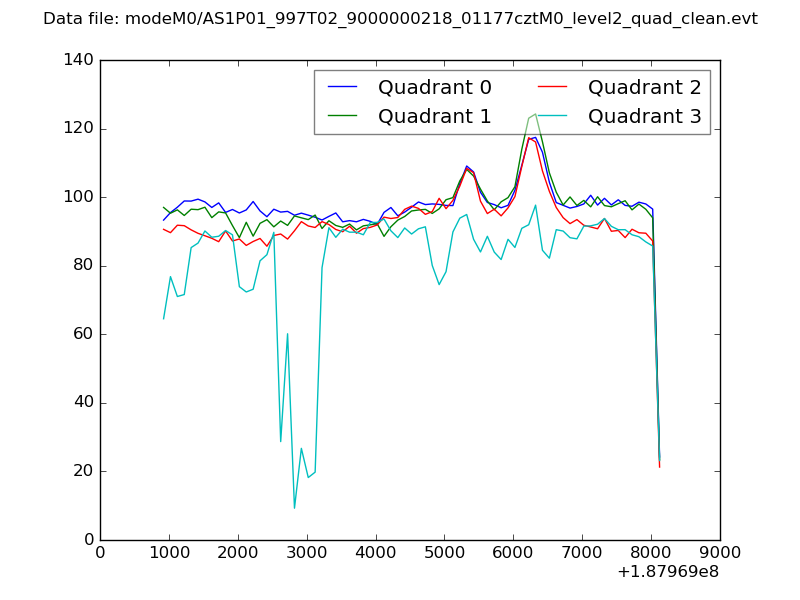
| Quadrant-wise count rates Data is divided into 100 sec bins |
 |
|
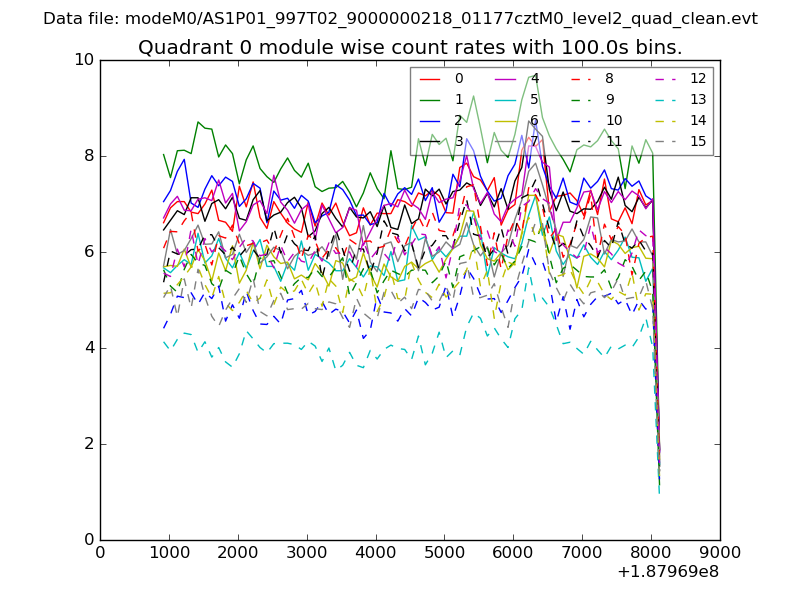
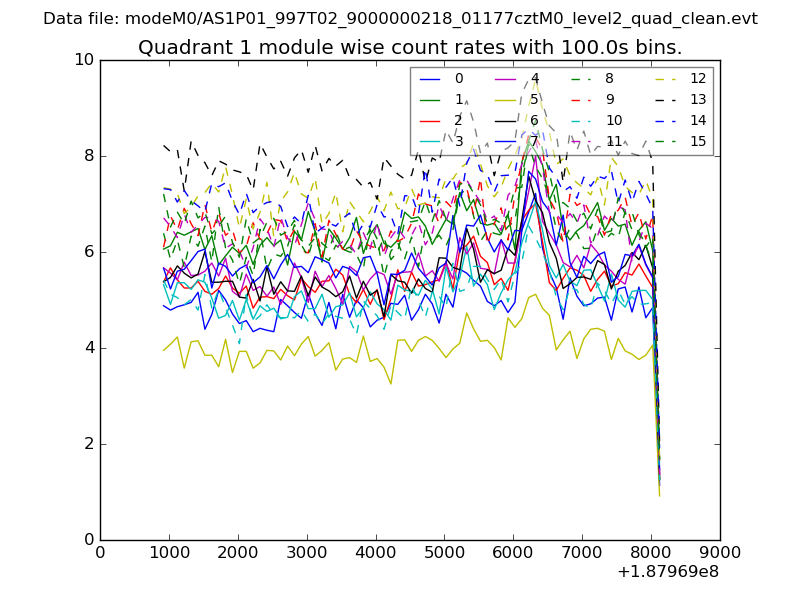
| Module-wise count rates for Quadrant A Data is divided into 100 sec bins |
 |
 |
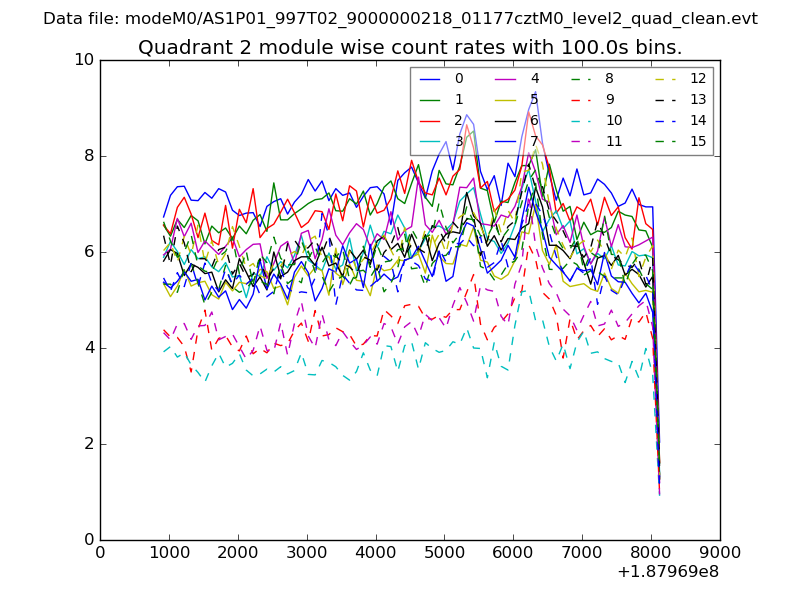
| Module-wise count rates for Quadrant B Data is divided into 100 sec bins |
 |
 |
| Module-wise count rates for Quadrant C Data is divided into 100 sec bins |
 |
 |
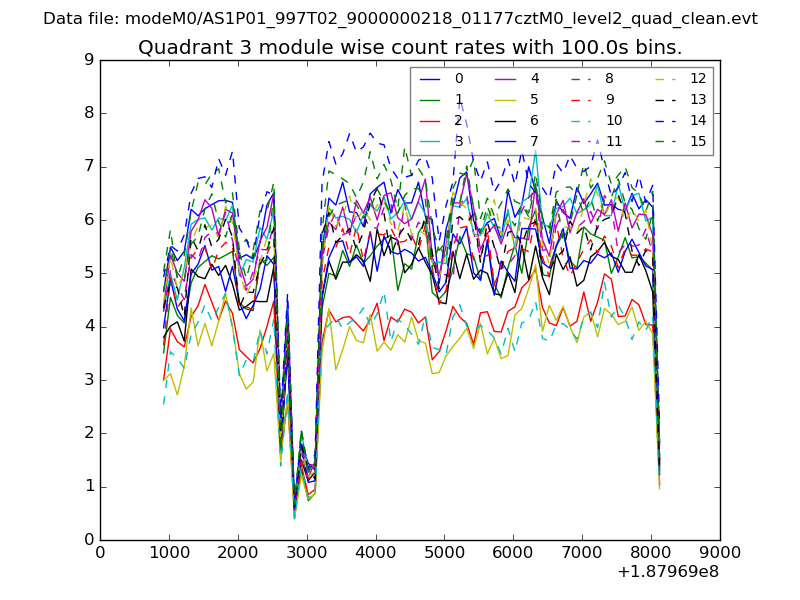
| Module-wise count rates for Quadrant D Data is divided into 100 sec bins |
 |
 |
| Parameter | Plot |
|---|---|
| CZT HV Monitor | 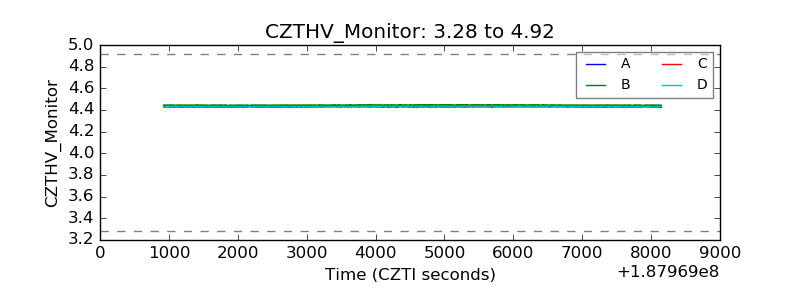 |
| D_VDD | 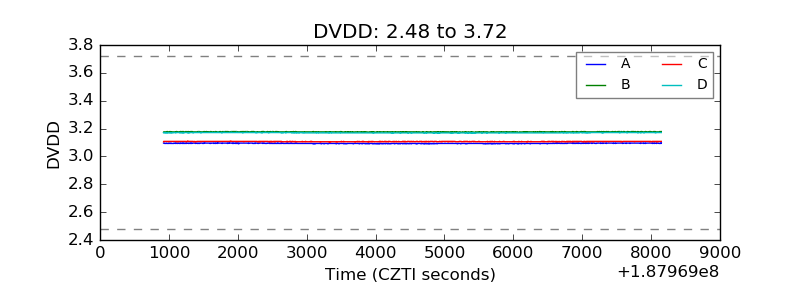 |
| Temperature 1 | 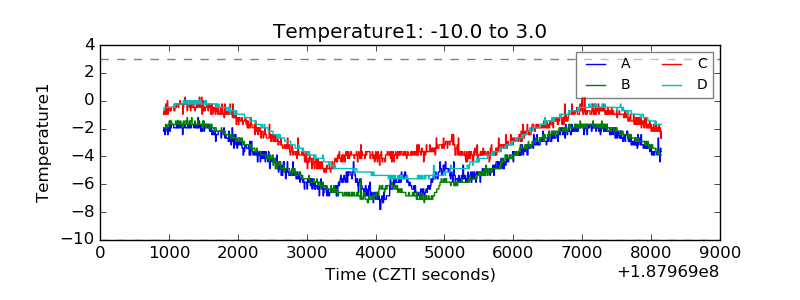 |
| Veto HV Monitor | 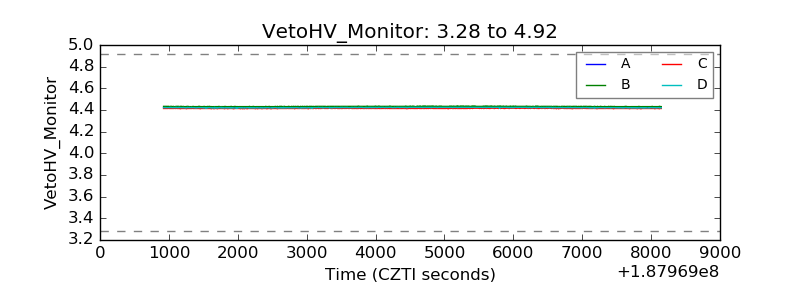 |
| Veto LLD |  |
| Alpha Counter | 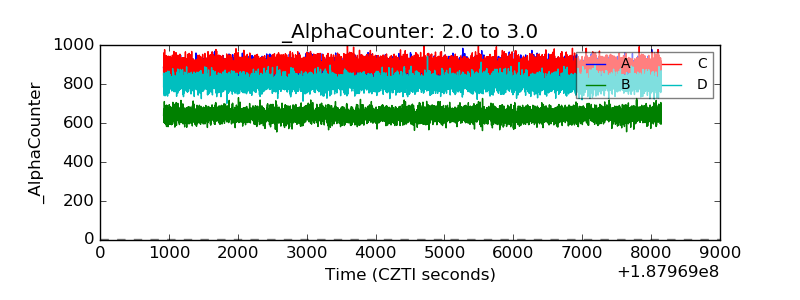 |
| _CPM_Rate | 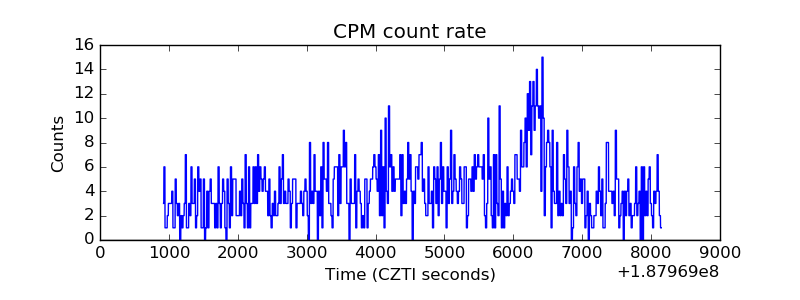 |
| CZT Counter | 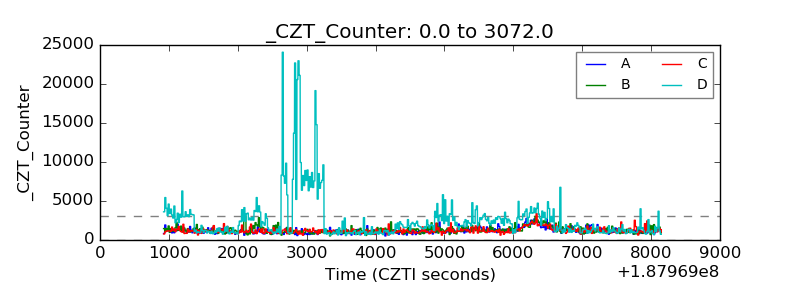 |
| +2.5 Volts monitor |  |
| +5 Volts monitor |  |
| _ROLL_ROT | 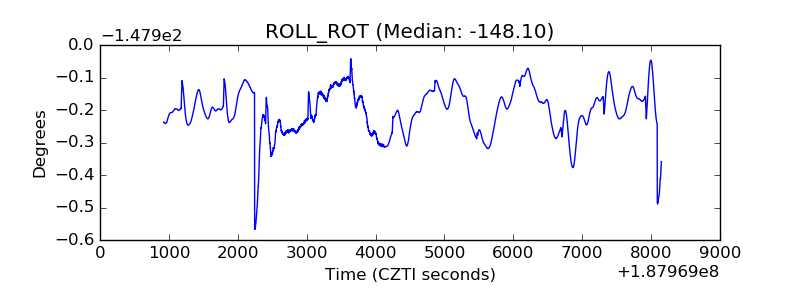 |
| _Roll_DEC | 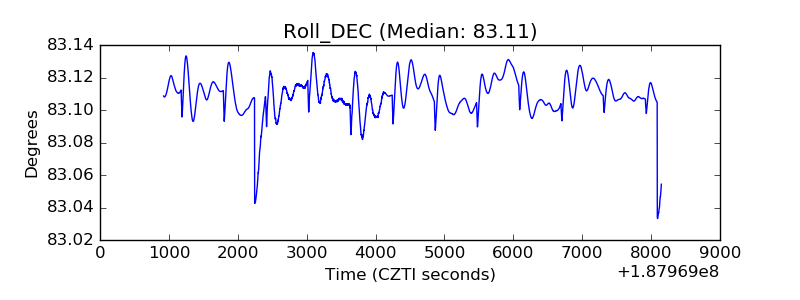 |
| _Roll_RA | 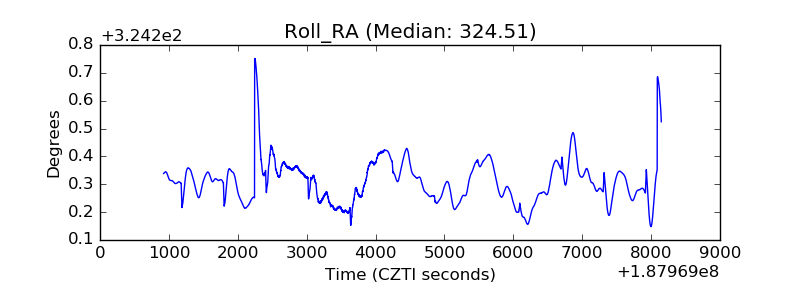 |
| Veto Counter | 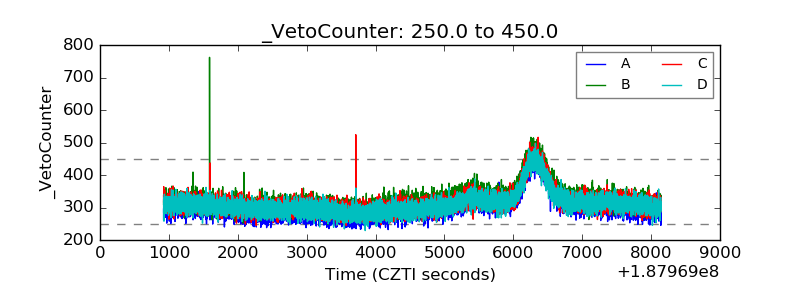 |