| Param | Original file | Final file |
|---|---|---|
| Filename | modeM0/AS1P01_997T02_9000000218_01178cztM0_level2.evt | modeM0/AS1P01_997T02_9000000218_01178cztM0_level2_quad_clean.evt |
| Size (bytes) | 1,130,860,800 | 105,022,080 |
| Size | 1.1 GB | 100.2 MB |
| Events in quadrant A | 8,327,675 | 688,269 |
| Events in quadrant B | 8,810,345 | 684,578 |
| Events in quadrant C | 8,475,379 | 661,172 |
| Events in quadrant D | 8,166,079 | 654,005 |
| Mode M9 | |||
|---|---|---|---|
| Quadrant | BADHDUFLAG | Total packets | Discarded packets |
| A | 0 | 4 | 0 |
| B | 0 | 4 | 0 |
| C | 0 | 4 | 0 |
| D | 0 | 4 | 0 |
| Mode M0 | |||
|---|---|---|---|
| Quadrant | BADHDUFLAG | Total packets | Discarded packets |
| A | 0 | 29770 | 2 |
| B | 0 | 31187 | 1 |
| C | 0 | 30235 | 1 |
| D | 0 | 29280 | 1 |
| Mode SS | |||
|---|---|---|---|
| Quadrant | BADHDUFLAG | Total packets | Discarded packets |
| A | 0 | 144 | 0 |
| B | 0 | 144 | 0 |
| C | 0 | 144 | 0 |
| D | 0 | 144 | 0 |
| Quadrant | Total seconds | Saturated seconds | Saturation percentage |
|---|---|---|---|
| A | 7080 | 11 | 0.155367% |
| B | 7080 | 28 | 0.395480% |
| C | 7080 | 23 | 0.324859% |
| D | 7080 | 49 | 0.692090% |
Noise dominated data is calculated using 1-second bins in cleaned event files. If a bin has >2000 counts, and if more than 50% of those come from <1% of pixels, then it is considered to be noise-dominated and hence unusable.
| Quadrant | # 1 sec bins | Bins with >0 counts | Bins with >2000 counts | High rate bins dominated by noise | Noise dominated (total time) | Noise dominated (detector-on time) | Marked lightcurve |
|---|---|---|---|---|---|---|---|
| A | 7390 | 7081 | 191 | 191 | 2.58% | 2.70% |  |
| B | 7390 | 7082 | 261 | 261 | 3.53% | 3.69% |  |
| C | 7390 | 7081 | 197 | 197 | 2.67% | 2.78% | 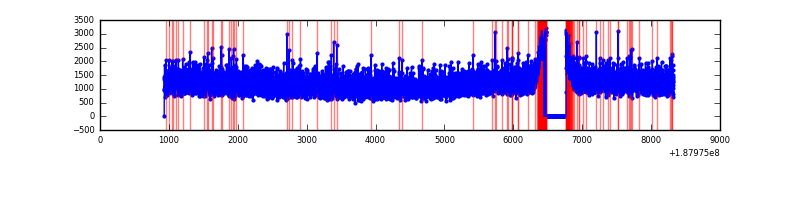 |
| D | 7390 | 7081 | 285 | 285 | 3.86% | 4.02% |  |
Top three noisy pixels from each quadrant. If the there are fewer than three noisy pixels in the level2.evt file, extra rows are filled as -1
| Pixel properties | Quadrant properties | ||||||
|---|---|---|---|---|---|---|---|
| Quadrant | DetID | PixID | Counts | Sigma | Mean | Median | Sigma |
| A | 12 | 243 | 10149 | 15.3 | 2163 | 2177 | 521.0 |
| A | 13 | 9 | 9912 | 14.84 | 2163 | 2177 | 521.0 |
| A | 11 | 79 | 8608 | 12.34 | 2163 | 2177 | 521.0 |
| B | 6 | 53 | 59500 | 107.49 | 2254 | 2262 | 532.5 |
| B | 4 | 185 | 47225 | 84.44 | 2254 | 2262 | 532.5 |
| B | 0 | 190 | 27483 | 47.37 | 2254 | 2262 | 532.5 |
| C | 15 | 241 | 326128 | 563.42 | 2061 | 2130 | 575.1 |
| C | 3 | 79 | 31469 | 51.02 | 2061 | 2130 | 575.1 |
| C | 3 | 111 | 29029 | 46.78 | 2061 | 2130 | 575.1 |
| D | 13 | 252 | 253687 | 405.17 | 2007 | 2085 | 621.0 |
| D | 1 | 239 | 227495 | 362.99 | 2007 | 2085 | 621.0 |
| D | 10 | 85 | 49432 | 76.25 | 2007 | 2085 | 621.0 |
Histogram calculated using DETX and DETY for each event in the final _common_clean file
| Quadrant A | 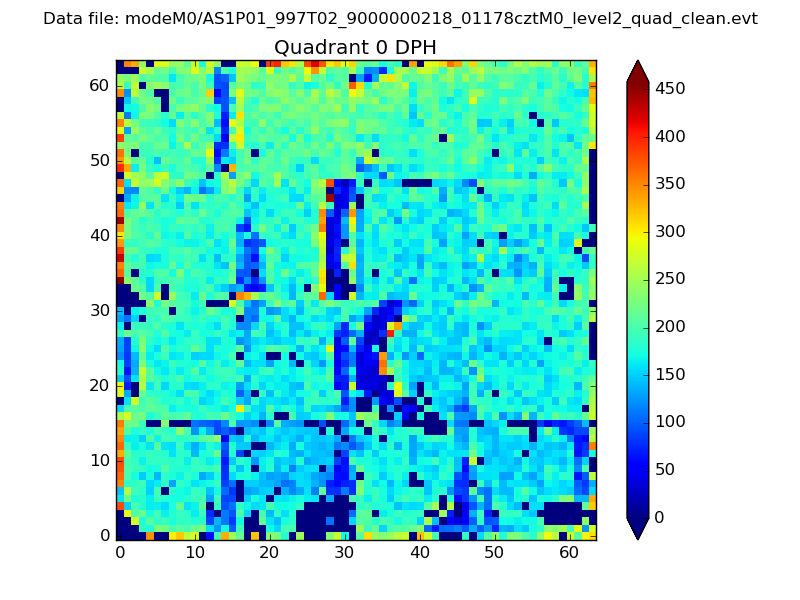 |
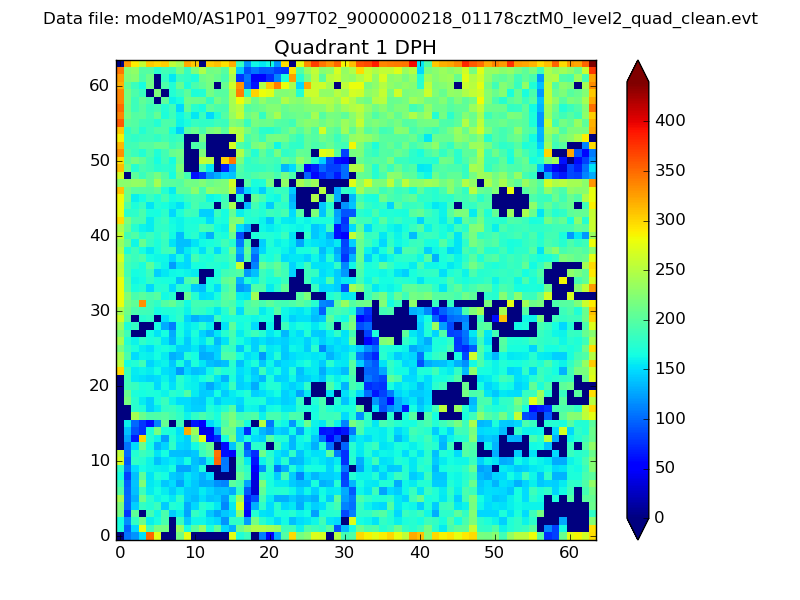 |
Quadrant B |
|---|---|---|---|
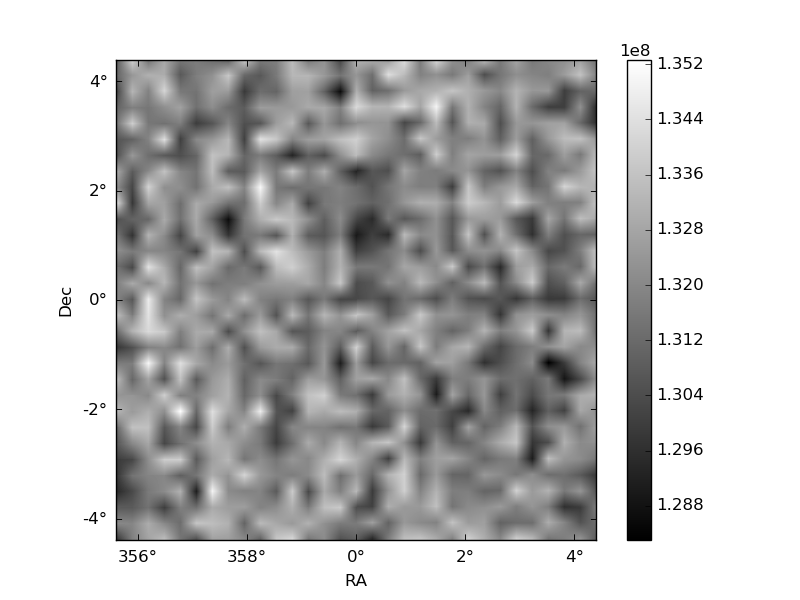
| Quadrant D | 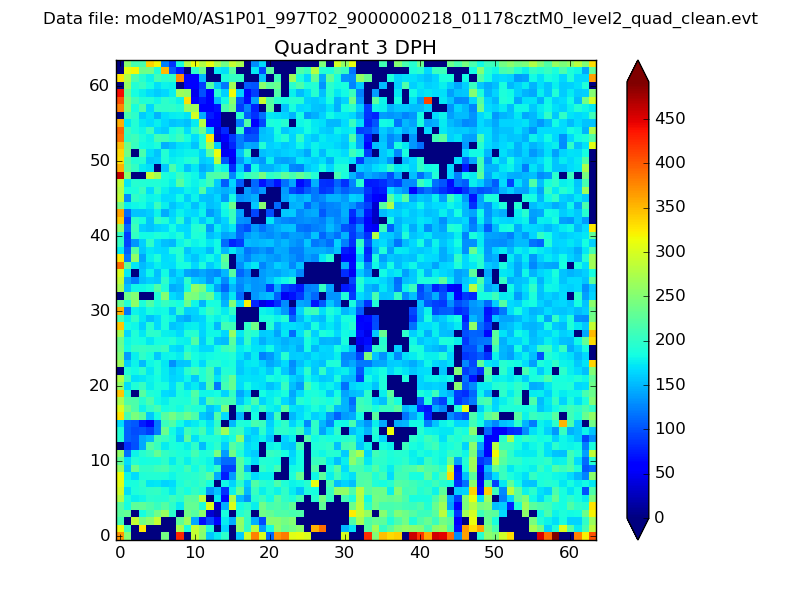 |
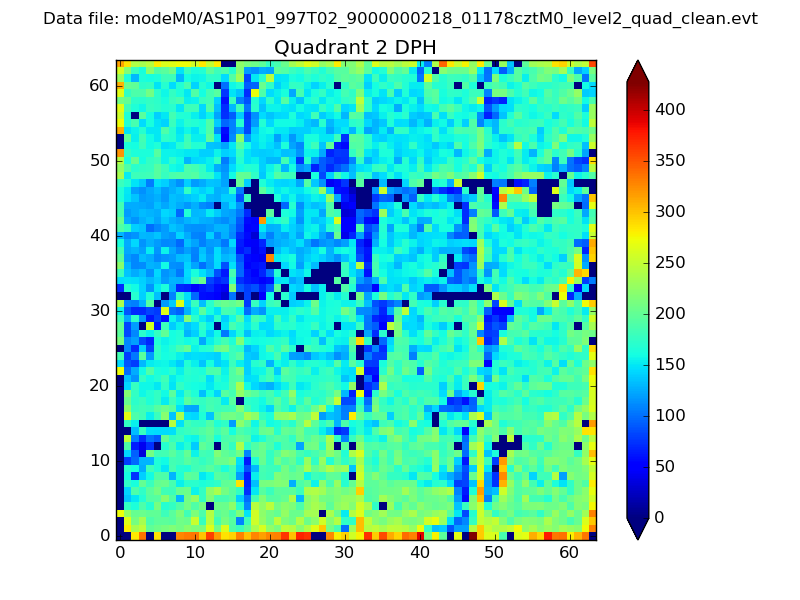 |
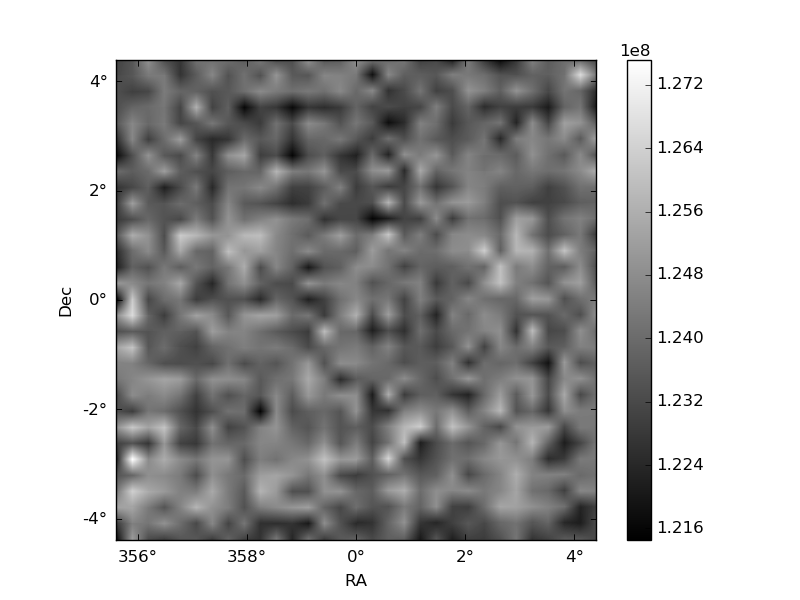
Quadrant C |
| Plot type | Count rate plots | Images |
|---|---|---|
| Comparison with Poisson distribution Blue bars denote a histogram of data divided into 1 sec bins. Red curve is a Poisson curve with rate = median count rate of data. |
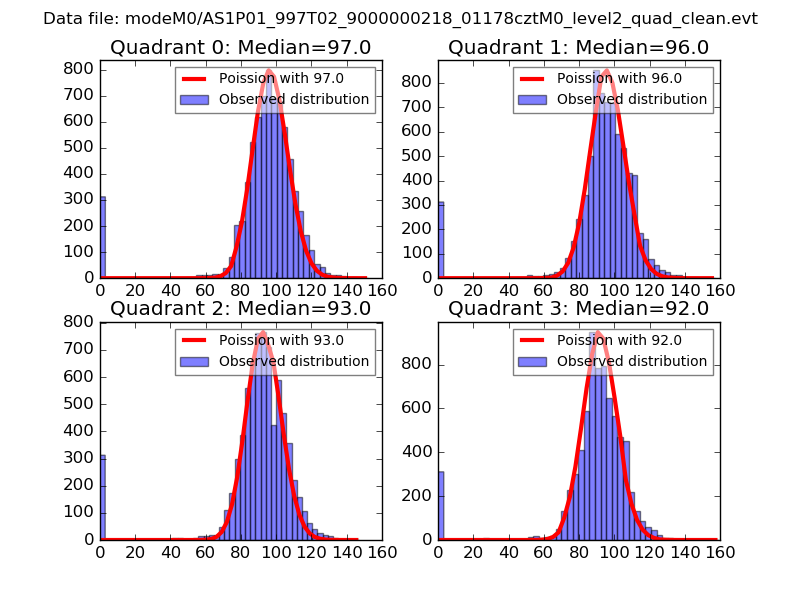 |
 |
| Quadrant-wise count rates Data is divided into 100 sec bins |
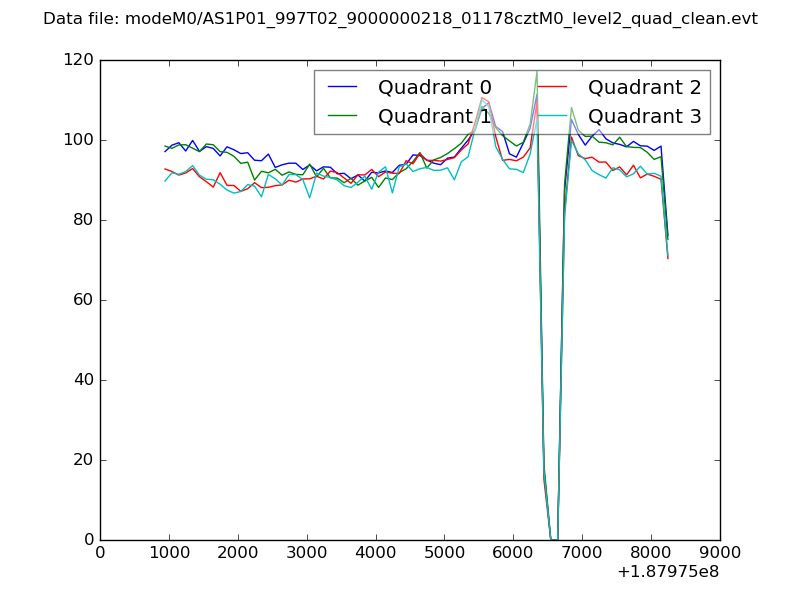 |
|
| Module-wise count rates for Quadrant A Data is divided into 100 sec bins |
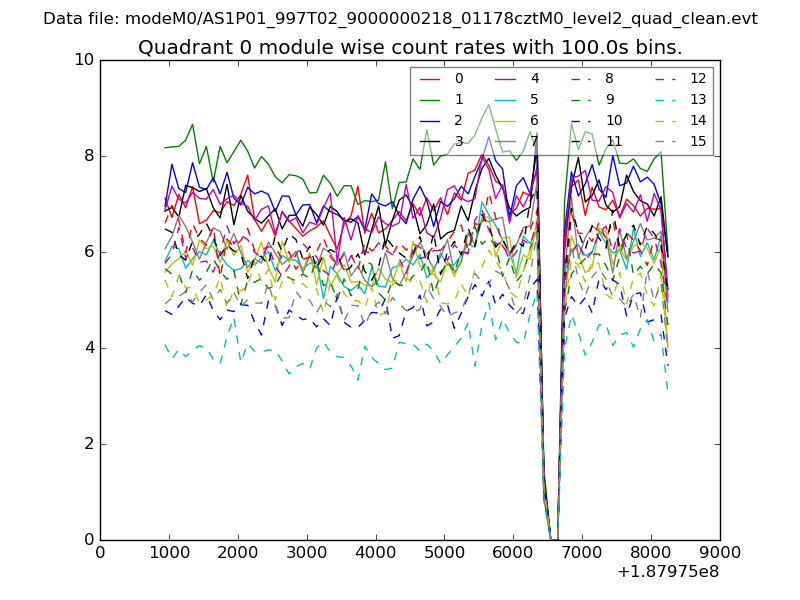 |
 |
| Module-wise count rates for Quadrant B Data is divided into 100 sec bins |
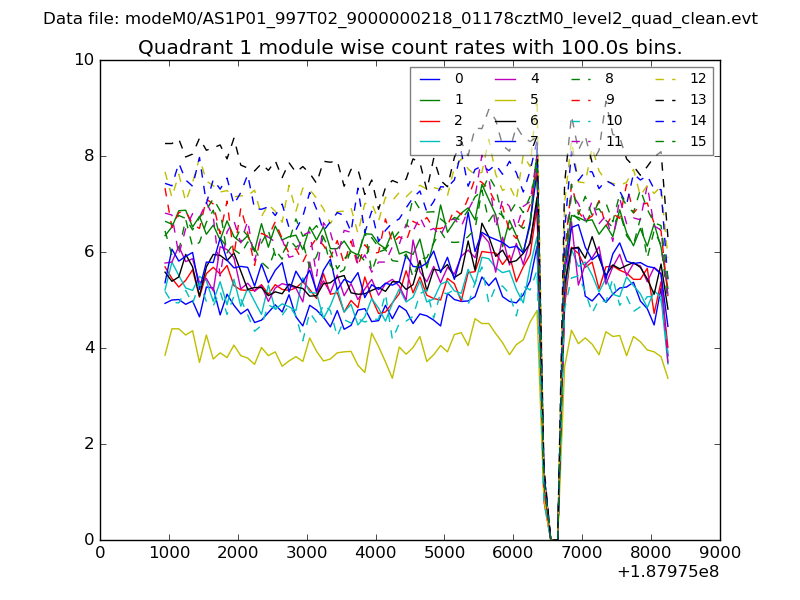 |
 |
| Module-wise count rates for Quadrant C Data is divided into 100 sec bins |
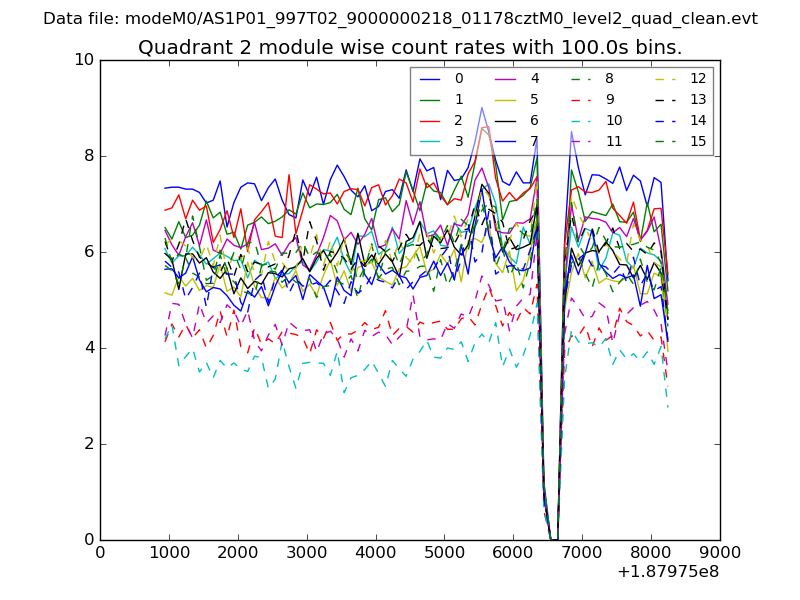 |
 |
| Module-wise count rates for Quadrant D Data is divided into 100 sec bins |
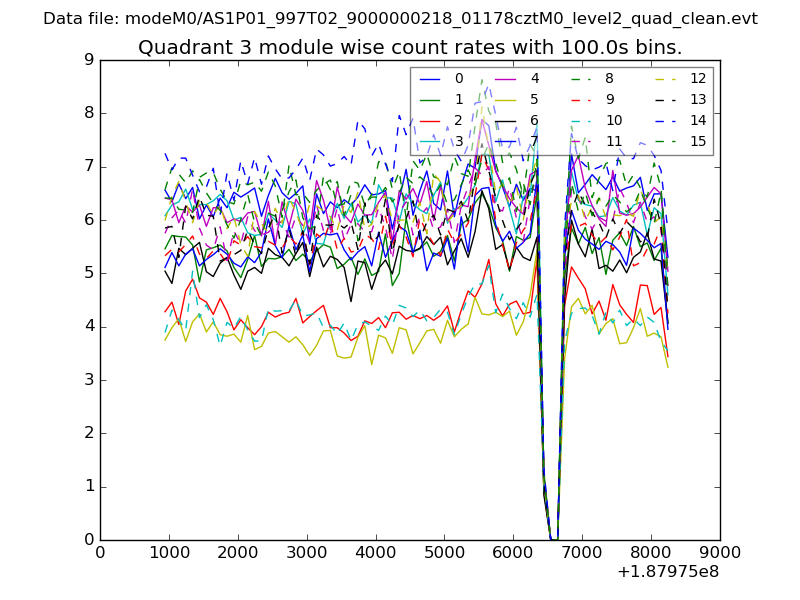 |
 |
| Parameter | Plot |
|---|---|
| CZT HV Monitor | 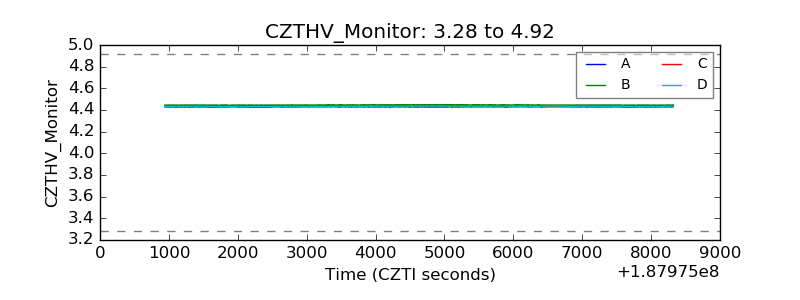 |
| D_VDD | 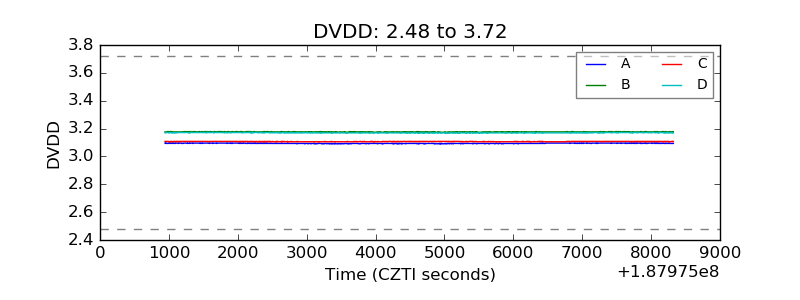 |
| Temperature 1 | 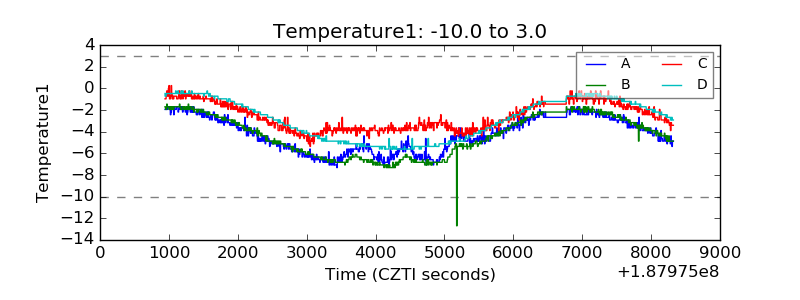 |
| Veto HV Monitor | 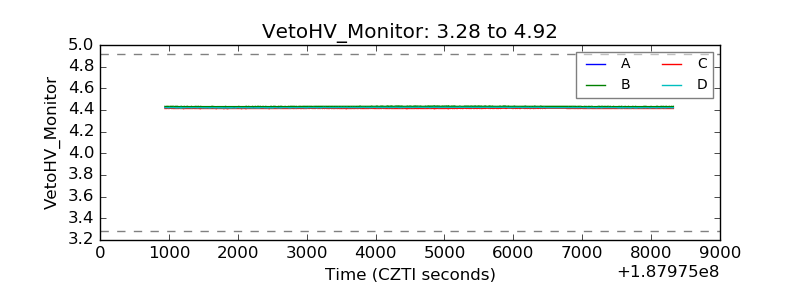 |
| Veto LLD | 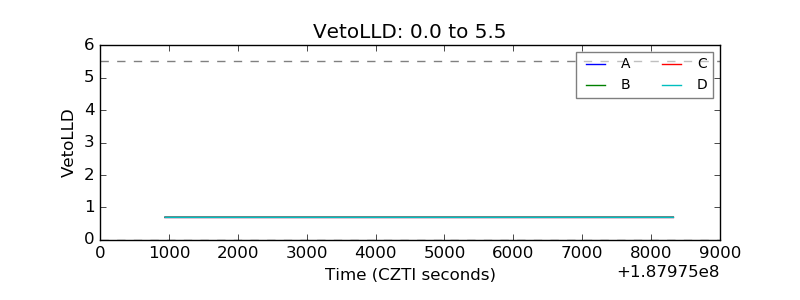 |
| Alpha Counter | 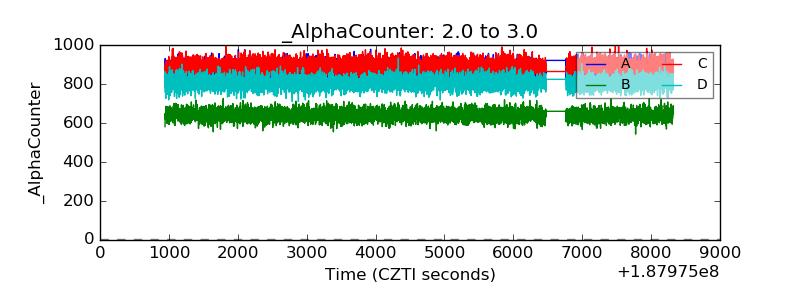 |
| _CPM_Rate | 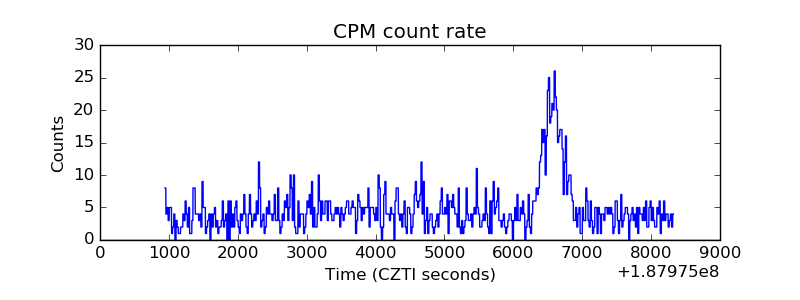 |
| CZT Counter | 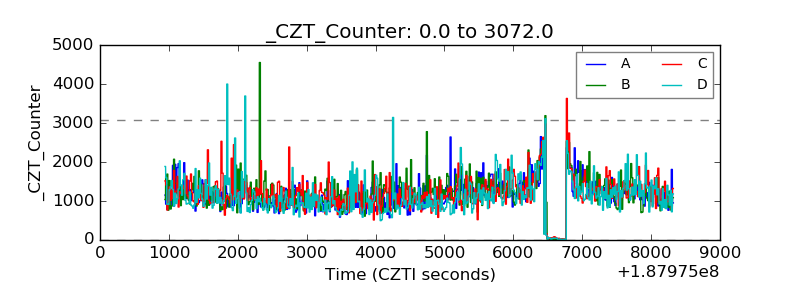 |
| +2.5 Volts monitor |  |
| +5 Volts monitor |  |
| _ROLL_ROT | 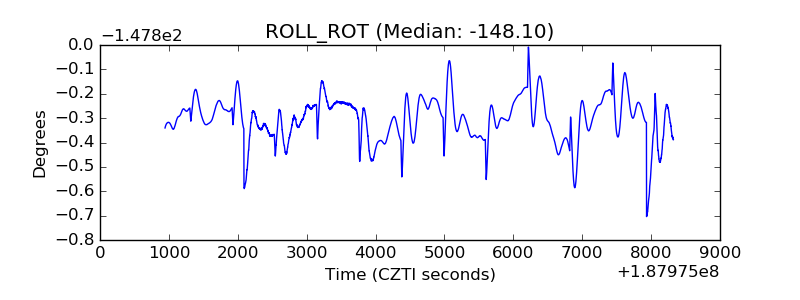 |
| _Roll_DEC | 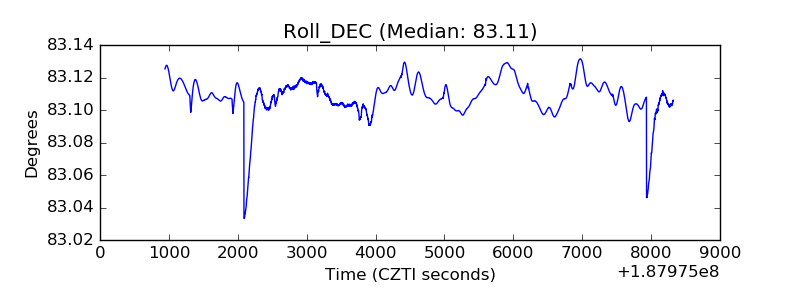 |
| _Roll_RA | 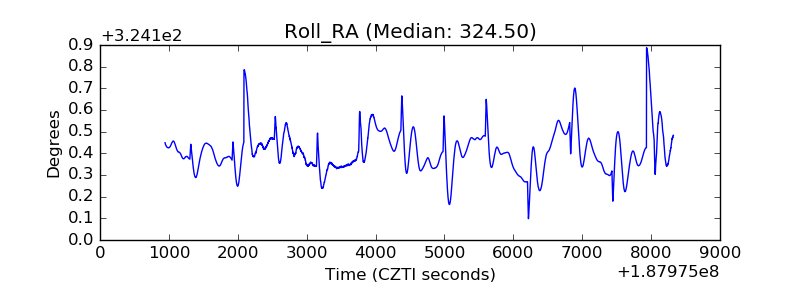 |
| Veto Counter | 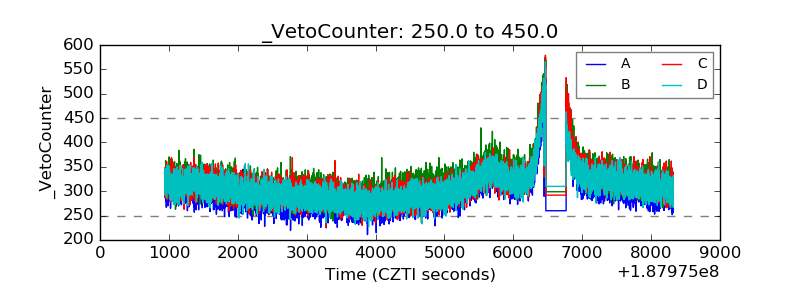 |