| Param | Original file | Final file |
|---|---|---|
| Filename | modeM0/AS1P01_997T02_9000000218_01179cztM0_level2.evt | modeM0/AS1P01_997T02_9000000218_01179cztM0_level2_quad_clean.evt |
| Size (bytes) | 1,176,298,560 | 108,783,360 |
| Size | 1.1 GB | 103.7 MB |
| Events in quadrant A | 8,663,439 | 710,646 |
| Events in quadrant B | 9,290,436 | 707,872 |
| Events in quadrant C | 8,811,443 | 686,626 |
| Events in quadrant D | 8,373,433 | 679,187 |
| Mode M9 | |||
|---|---|---|---|
| Quadrant | BADHDUFLAG | Total packets | Discarded packets |
| A | 0 | 5 | 0 |
| B | 0 | 5 | 0 |
| C | 0 | 5 | 0 |
| D | 0 | 5 | 0 |
| Mode M0 | |||
|---|---|---|---|
| Quadrant | BADHDUFLAG | Total packets | Discarded packets |
| A | 0 | 30937 | 3 |
| B | 0 | 32789 | 2 |
| C | 0 | 31347 | 2 |
| D | 0 | 30143 | 2 |
| Mode SS | |||
|---|---|---|---|
| Quadrant | BADHDUFLAG | Total packets | Discarded packets |
| A | 0 | 150 | 0 |
| B | 0 | 150 | 0 |
| C | 0 | 150 | 0 |
| D | 0 | 150 | 0 |
| Quadrant | Total seconds | Saturated seconds | Saturation percentage |
|---|---|---|---|
| A | 7326 | 9 | 0.122850% |
| B | 7326 | 38 | 0.518701% |
| C | 7326 | 7 | 0.095550% |
| D | 7326 | 21 | 0.286650% |
Noise dominated data is calculated using 1-second bins in cleaned event files. If a bin has >2000 counts, and if more than 50% of those come from <1% of pixels, then it is considered to be noise-dominated and hence unusable.
| Quadrant | # 1 sec bins | Bins with >0 counts | Bins with >2000 counts | High rate bins dominated by noise | Noise dominated (total time) | Noise dominated (detector-on time) | Marked lightcurve |
|---|---|---|---|---|---|---|---|
| A | 7861 | 7327 | 177 | 177 | 2.25% | 2.42% | 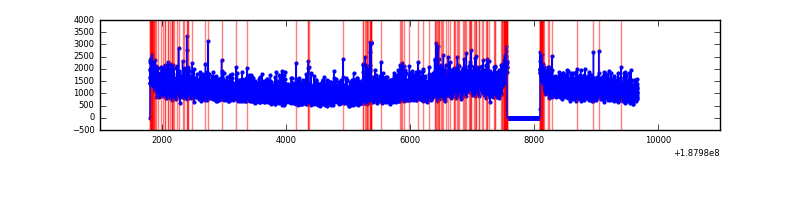 |
| B | 7861 | 7327 | 336 | 336 | 4.27% | 4.59% | 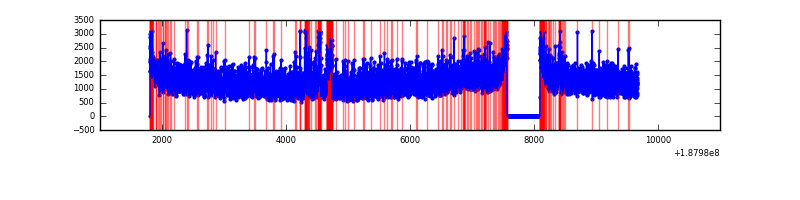 |
| C | 7861 | 7327 | 176 | 176 | 2.24% | 2.40% | 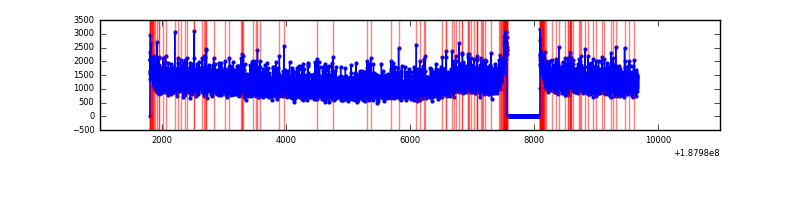 |
| D | 7861 | 7327 | 228 | 228 | 2.90% | 3.11% | 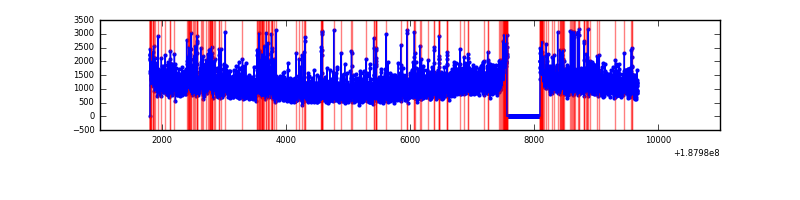 |
Top three noisy pixels from each quadrant. If the there are fewer than three noisy pixels in the level2.evt file, extra rows are filled as -1
| Pixel properties | Quadrant properties | ||||||
|---|---|---|---|---|---|---|---|
| Quadrant | DetID | PixID | Counts | Sigma | Mean | Median | Sigma |
| A | 0 | 175 | 43243 | 76.34 | 2240 | 2250 | 537.0 |
| A | 11 | 79 | 9447 | 13.4 | 2240 | 2250 | 537.0 |
| A | 8 | 14 | 7592 | 9.95 | 2240 | 2250 | 537.0 |
| B | 5 | 191 | 242778 | 436.87 | 2329 | 2341 | 550.4 |
| B | 6 | 53 | 56716 | 98.8 | 2329 | 2341 | 550.4 |
| B | 15 | 22 | 51296 | 88.95 | 2329 | 2341 | 550.4 |
| C | 15 | 241 | 316767 | 522.38 | 2156 | 2235 | 602.1 |
| C | 3 | 111 | 27331 | 41.68 | 2156 | 2235 | 602.1 |
| C | 3 | 79 | 22712 | 34.01 | 2156 | 2235 | 602.1 |
| D | 1 | 239 | 344416 | 532.92 | 2082 | 2155 | 642.2 |
| D | 14 | 50 | 53140 | 79.39 | 2082 | 2155 | 642.2 |
| D | 2 | 152 | 32516 | 47.27 | 2082 | 2155 | 642.2 |
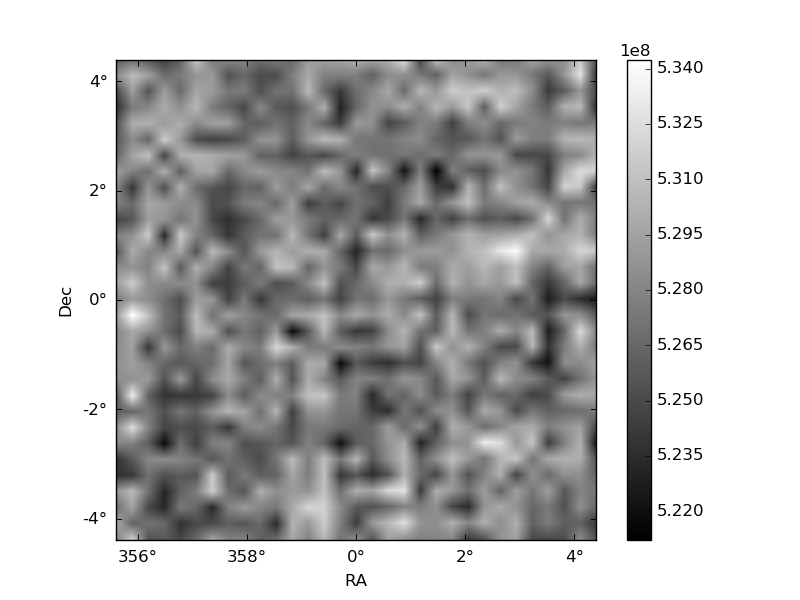
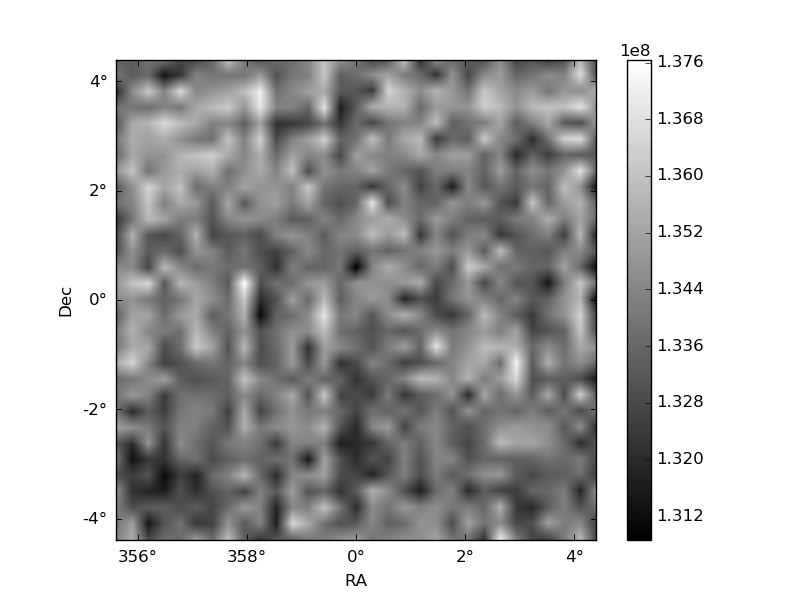
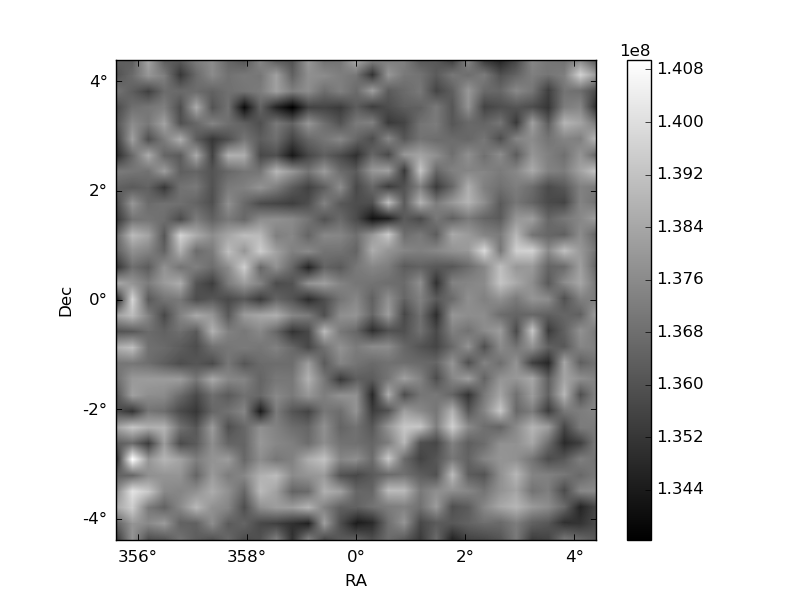
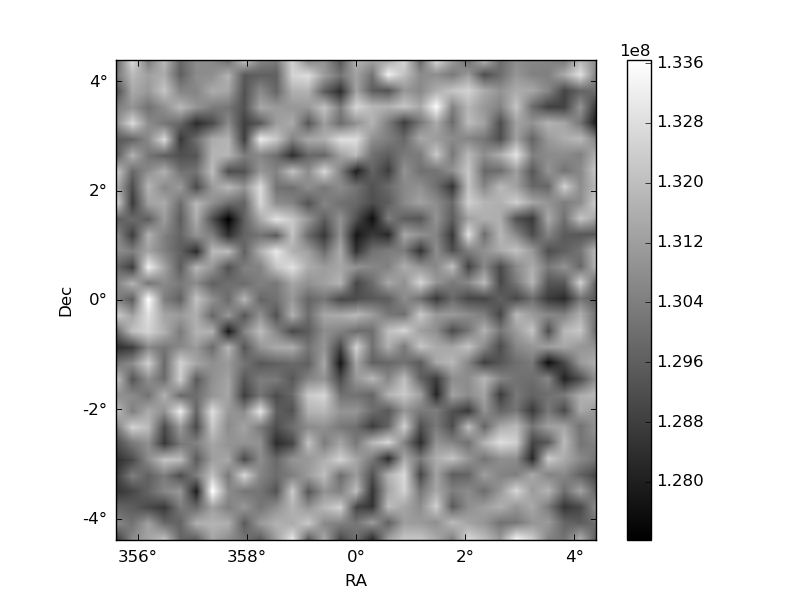
Histogram calculated using DETX and DETY for each event in the final _common_clean file
| Quadrant A | 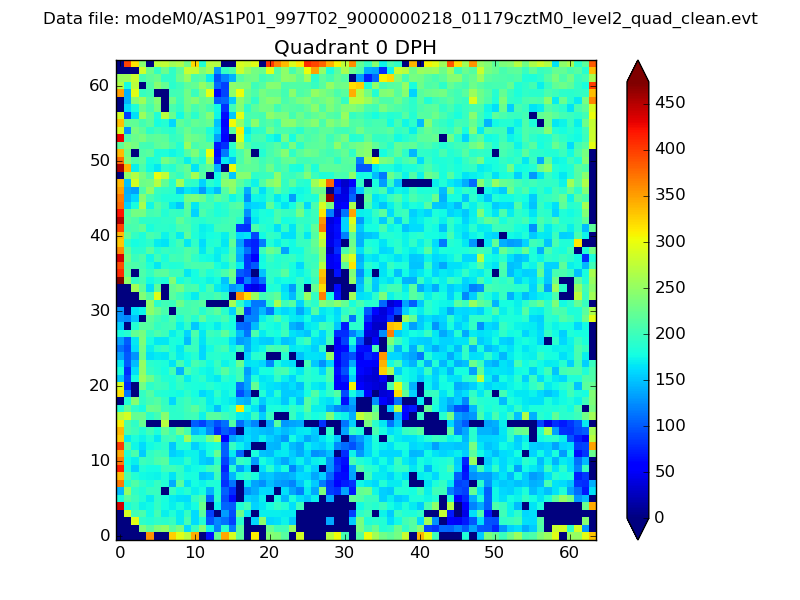 |
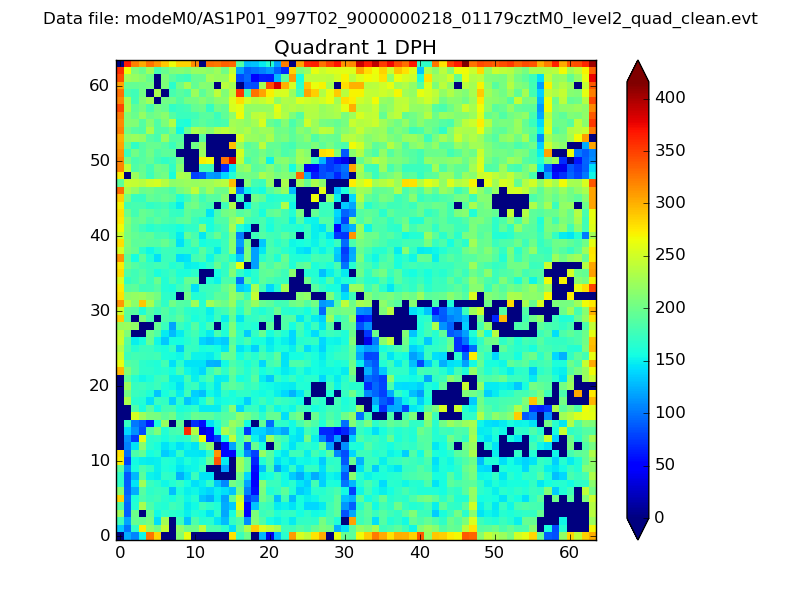 |
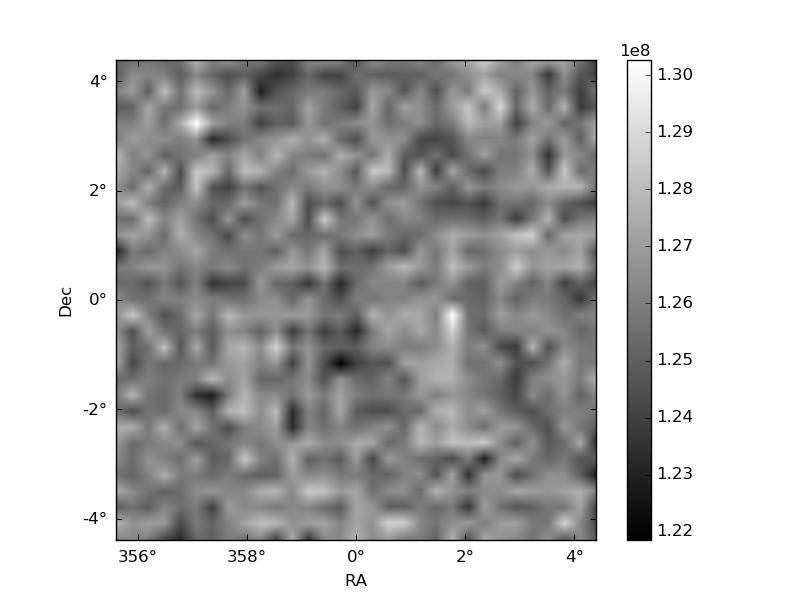
Quadrant B |
|---|---|---|---|
| Quadrant D | 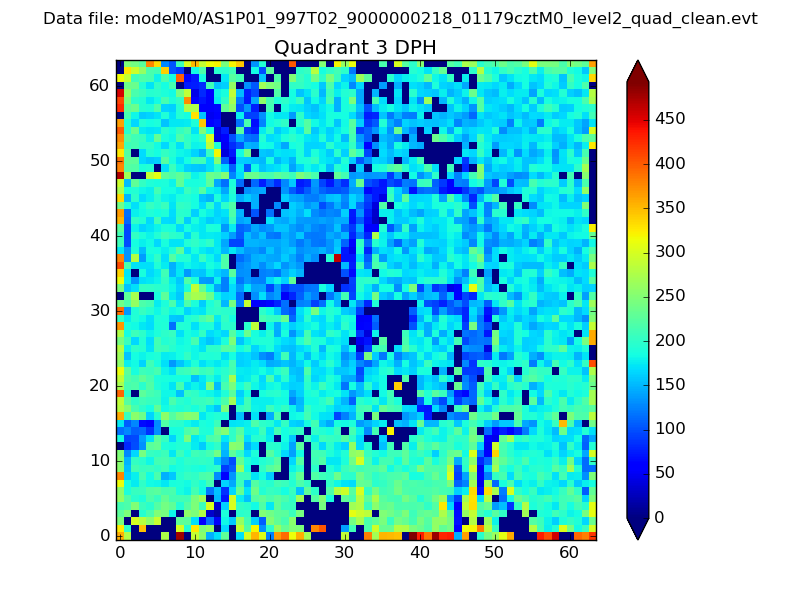 |
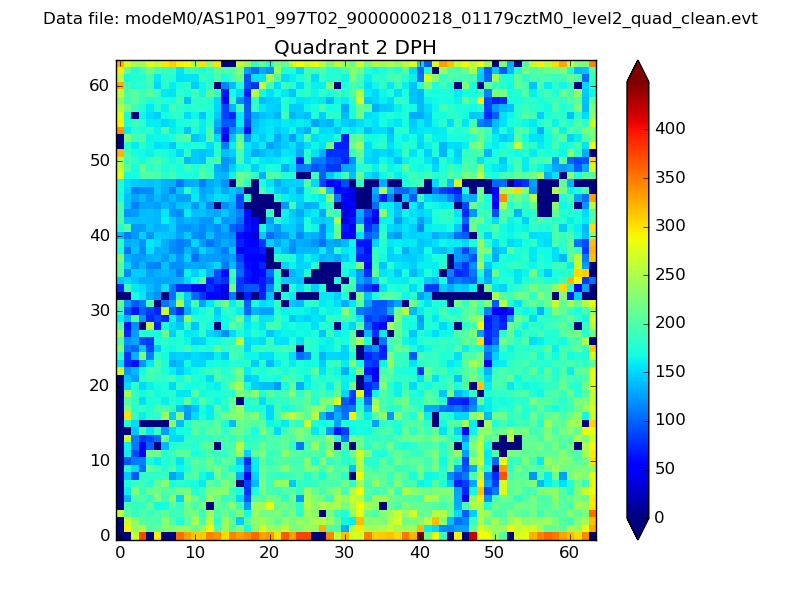 |
Quadrant C |
| Plot type | Count rate plots | Images |
|---|---|---|
| Comparison with Poisson distribution Blue bars denote a histogram of data divided into 1 sec bins. Red curve is a Poisson curve with rate = median count rate of data. |
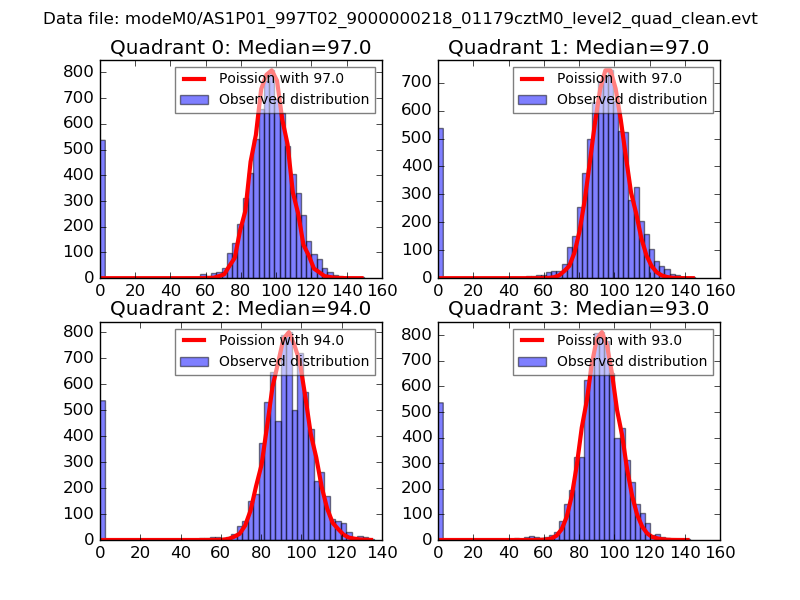 |
 |
| Quadrant-wise count rates Data is divided into 100 sec bins |
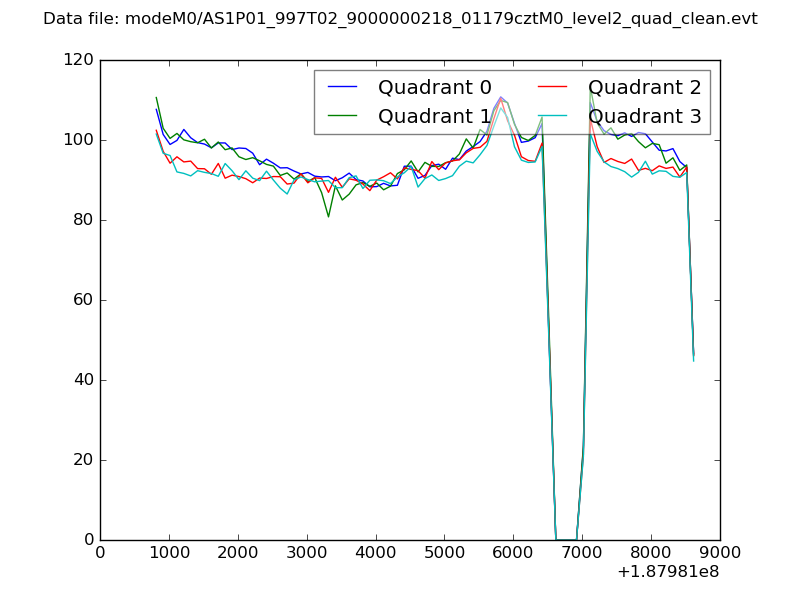 |
|
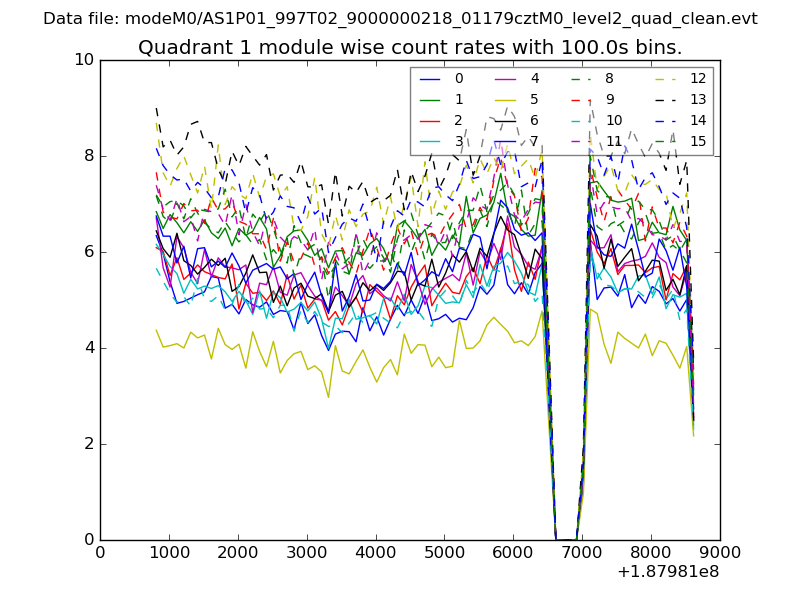
| Module-wise count rates for Quadrant A Data is divided into 100 sec bins |
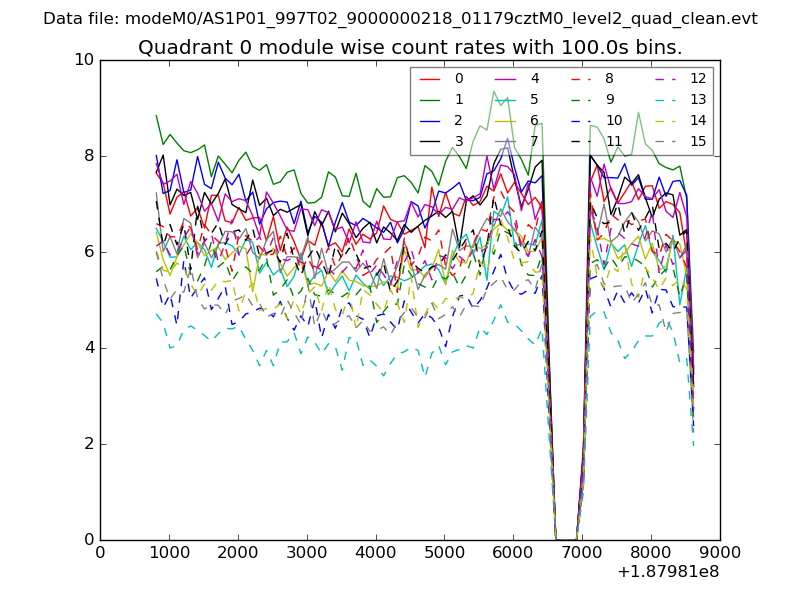 |
 |
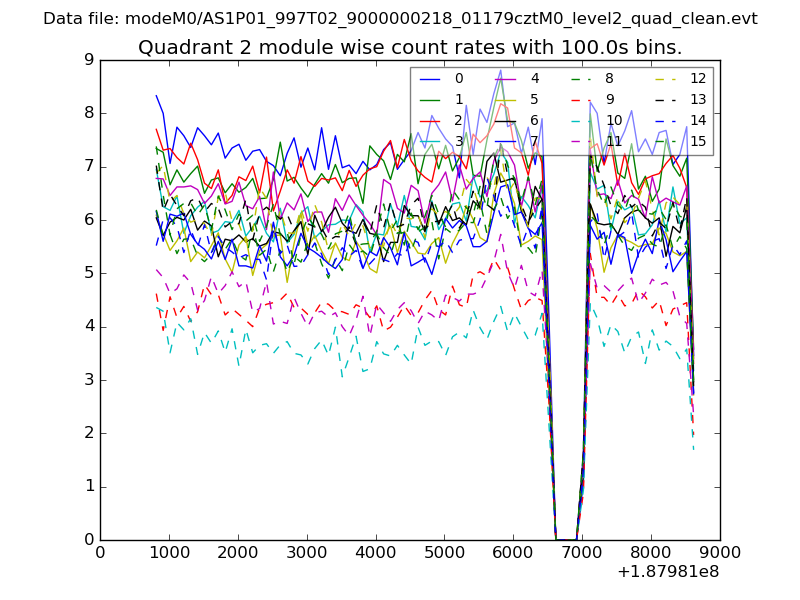
| Module-wise count rates for Quadrant B Data is divided into 100 sec bins |
 |
 |
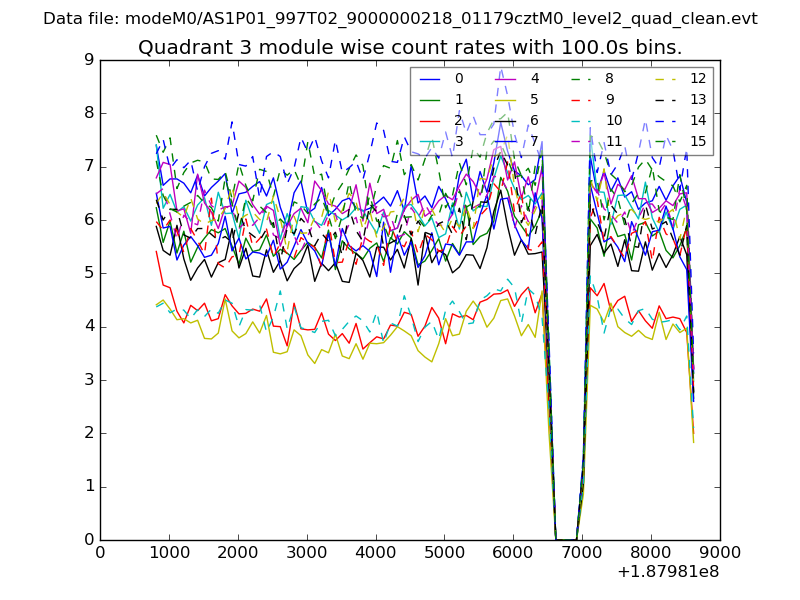
| Module-wise count rates for Quadrant C Data is divided into 100 sec bins |
 |
 |
| Module-wise count rates for Quadrant D Data is divided into 100 sec bins |
 |
 |
| Parameter | Plot |
|---|---|
| CZT HV Monitor |  |
| D_VDD | 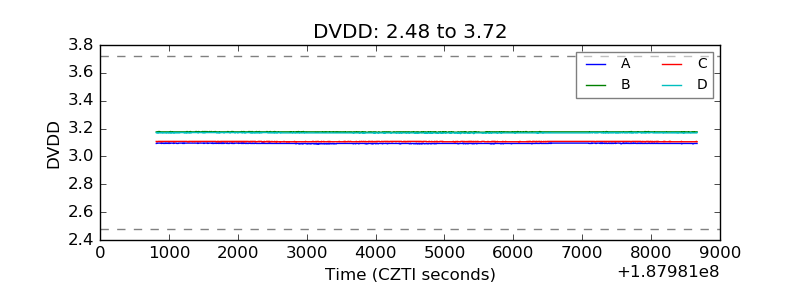 |
| Temperature 1 | 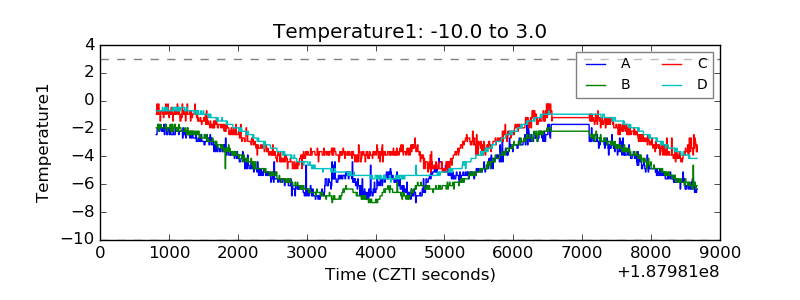 |
| Veto HV Monitor | 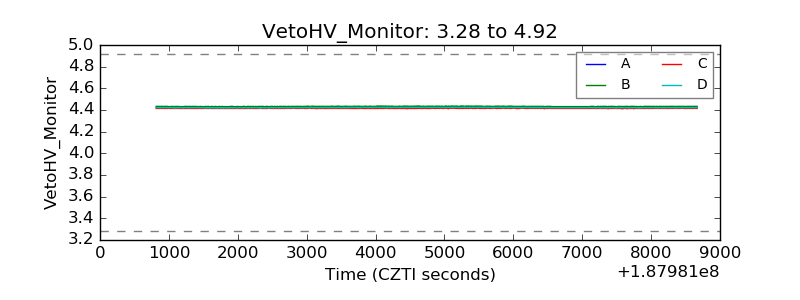 |
| Veto LLD | 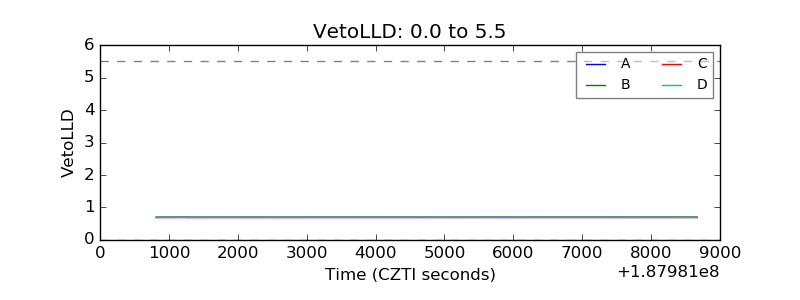 |
| Alpha Counter | 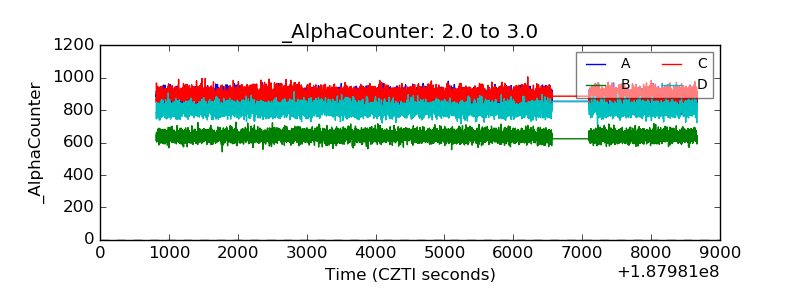 |
| _CPM_Rate | 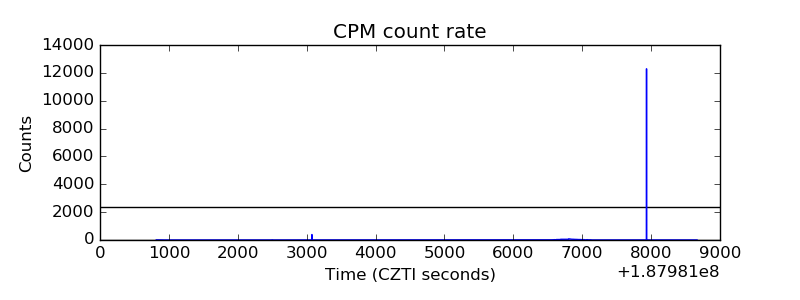 |
| CZT Counter | 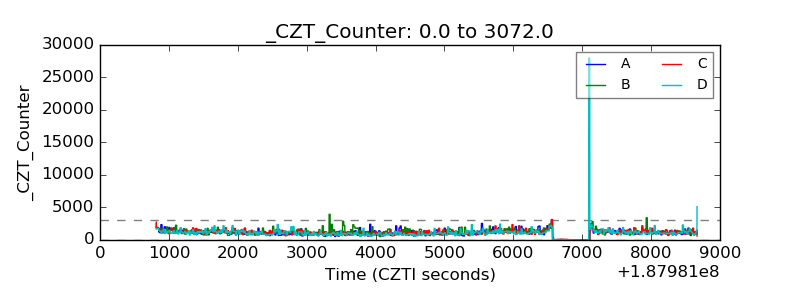 |
| +2.5 Volts monitor |  |
| +5 Volts monitor |  |
| _ROLL_ROT |  |
| _Roll_DEC | 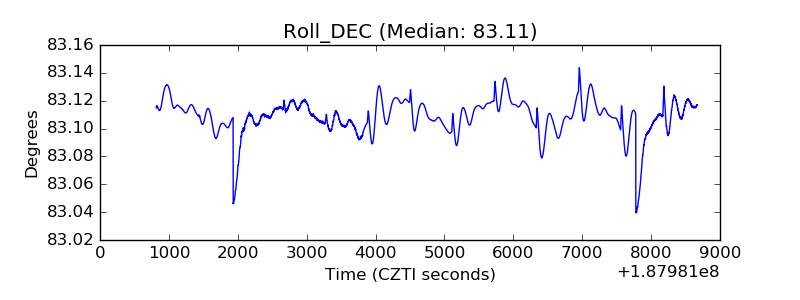 |
| _Roll_RA | 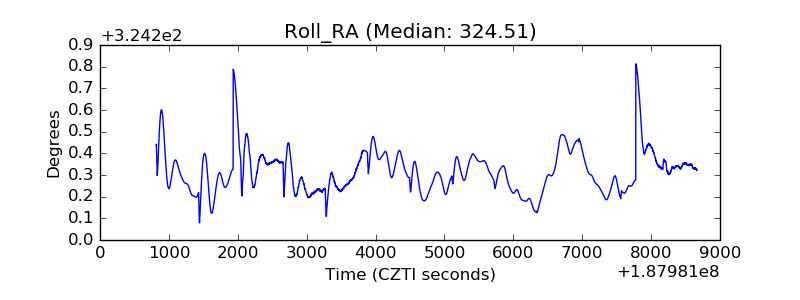 |
| Veto Counter | 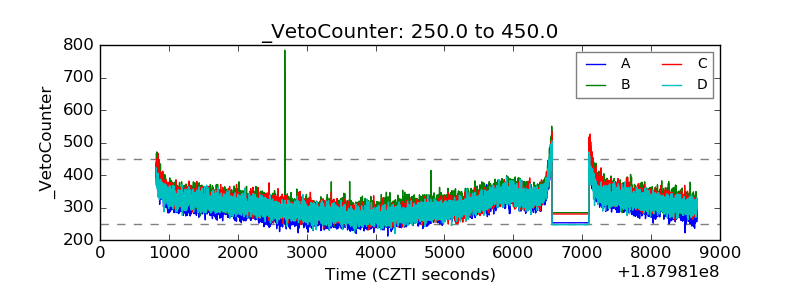 |