| Param | Original file | Final file |
|---|---|---|
| Filename | modeM0/AS1P01_997T02_9000000218_01180cztM0_level2.evt | modeM0/AS1P01_997T02_9000000218_01180cztM0_level2_quad_clean.evt |
| Size (bytes) | 1,388,050,560 | 94,777,920 |
| Size | 1.3 GB | 90.4 MB |
| Events in quadrant A | 8,085,224 | 640,432 |
| Events in quadrant B | 8,111,209 | 643,104 |
| Events in quadrant C | 7,945,605 | 626,788 |
| Events in quadrant D | 17,456,613 | 494,594 |
| Mode M9 | |||
|---|---|---|---|
| Quadrant | BADHDUFLAG | Total packets | Discarded packets |
| A | 0 | 7 | 0 |
| B | 0 | 7 | 0 |
| C | 0 | 7 | 0 |
| D | 0 | 7 | 0 |
| Mode M0 | |||
|---|---|---|---|
| Quadrant | BADHDUFLAG | Total packets | Discarded packets |
| A | 0 | 28766 | 2 |
| B | 0 | 28827 | 1 |
| C | 0 | 28342 | 1 |
| D | 0 | 57127 | 1 |
| Mode SS | |||
|---|---|---|---|
| Quadrant | BADHDUFLAG | Total packets | Discarded packets |
| A | 0 | 134 | 0 |
| B | 0 | 134 | 0 |
| C | 0 | 134 | 0 |
| D | 0 | 134 | 0 |
| Quadrant | Total seconds | Saturated seconds | Saturation percentage |
|---|---|---|---|
| A | 6653 | 82 | 1.232527% |
| B | 6653 | 20 | 0.300616% |
| C | 6653 | 11 | 0.165339% |
| D | 6653 | 3678 | 55.283331% |
Noise dominated data is calculated using 1-second bins in cleaned event files. If a bin has >2000 counts, and if more than 50% of those come from <1% of pixels, then it is considered to be noise-dominated and hence unusable.
| Quadrant | # 1 sec bins | Bins with >0 counts | Bins with >2000 counts | High rate bins dominated by noise | Noise dominated (total time) | Noise dominated (detector-on time) | Marked lightcurve |
|---|---|---|---|---|---|---|---|
| A | 7332 | 6653 | 296 | 296 | 4.04% | 4.45% | 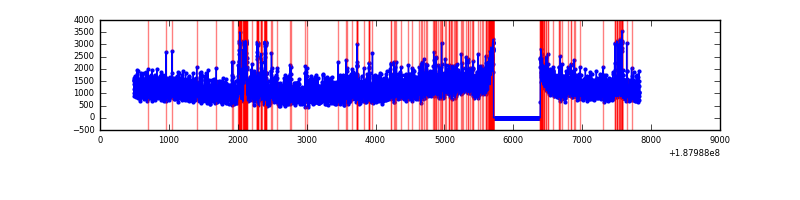 |
| B | 7333 | 6654 | 185 | 185 | 2.52% | 2.78% | 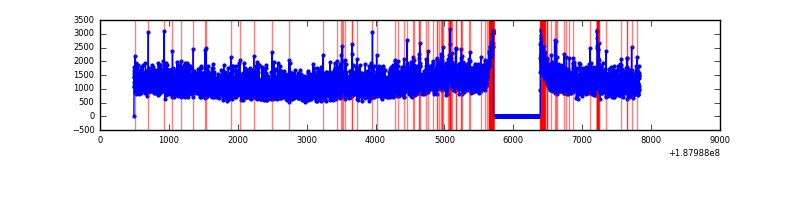 |
| C | 7333 | 6654 | 172 | 172 | 2.35% | 2.58% | 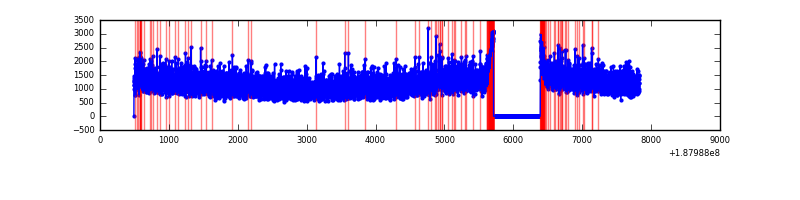 |
| D | 7333 | 6654 | 5396 | 5396 | 73.59% | 81.09% | 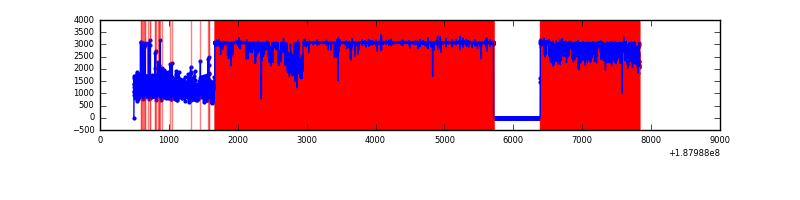 |
Top three noisy pixels from each quadrant. If the there are fewer than three noisy pixels in the level2.evt file, extra rows are filled as -1
| Pixel properties | Quadrant properties | ||||||
|---|---|---|---|---|---|---|---|
| Quadrant | DetID | PixID | Counts | Sigma | Mean | Median | Sigma |
| A | 12 | 243 | 277761 | 572.37 | 2002 | 2016 | 481.8 |
| A | 4 | 32 | 79552 | 160.94 | 2002 | 2016 | 481.8 |
| A | 15 | 223 | 35185 | 68.85 | 2002 | 2016 | 481.8 |
| B | 6 | 53 | 41199 | 78.73 | 2100 | 2106 | 496.5 |
| B | 7 | 221 | 21564 | 39.19 | 2100 | 2106 | 496.5 |
| B | 0 | 230 | 20091 | 36.22 | 2100 | 2106 | 496.5 |
| C | 15 | 241 | 336587 | 619.92 | 1933 | 2006 | 539.7 |
| C | 3 | 111 | 22906 | 38.72 | 1933 | 2006 | 539.7 |
| C | 9 | 52 | 17900 | 29.45 | 1933 | 2006 | 539.7 |
| D | 1 | 239 | 10509433 | 20570.8 | 1652 | 1705 | 510.8 |
| D | 10 | 84 | 382677 | 745.82 | 1652 | 1705 | 510.8 |
| D | 2 | 152 | 285869 | 556.3 | 1652 | 1705 | 510.8 |
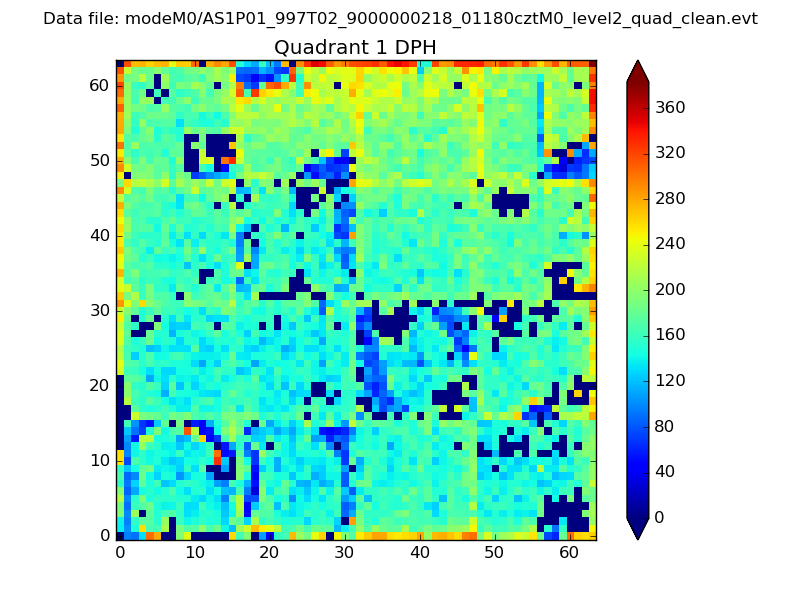
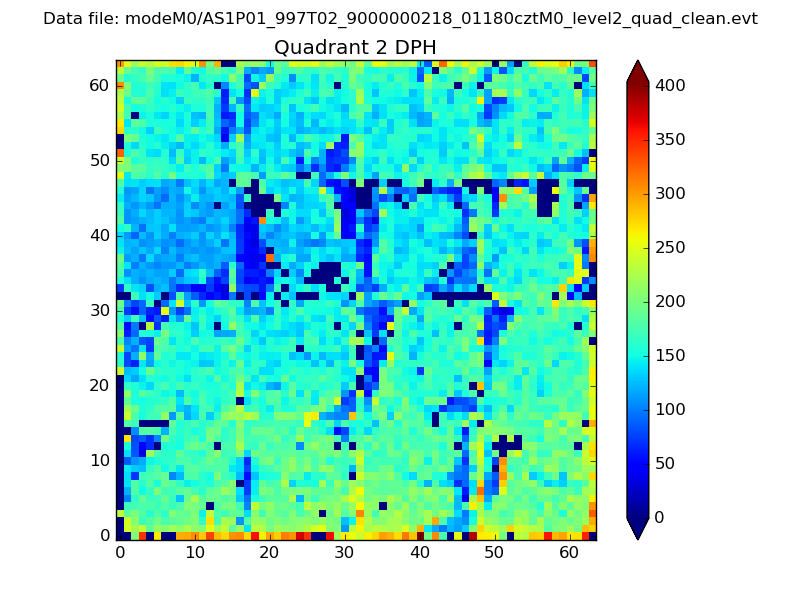
Histogram calculated using DETX and DETY for each event in the final _common_clean file
| Quadrant A |  |
 |
Quadrant B |
|---|---|---|---|
| Quadrant D |  |
 |
Quadrant C |
| Plot type | Count rate plots | Images |
|---|---|---|
| Comparison with Poisson distribution Blue bars denote a histogram of data divided into 1 sec bins. Red curve is a Poisson curve with rate = median count rate of data. |
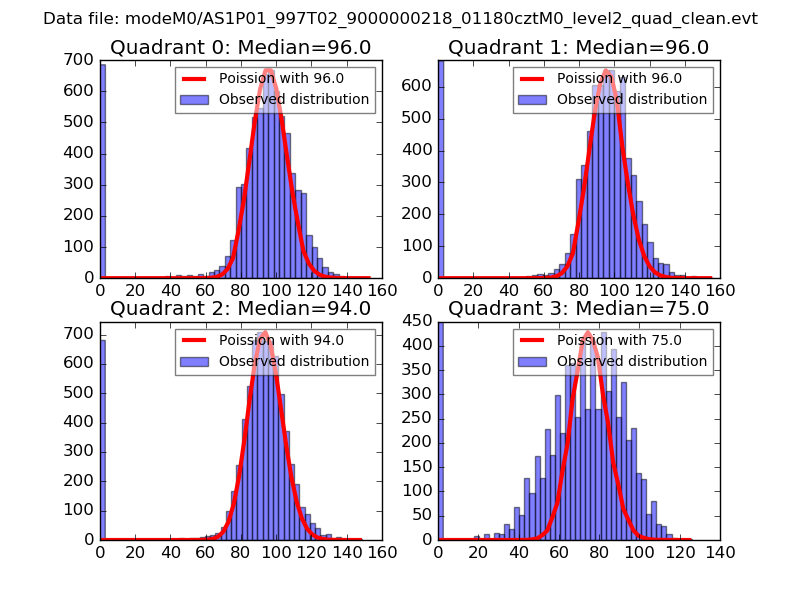 |
 |
| Quadrant-wise count rates Data is divided into 100 sec bins |
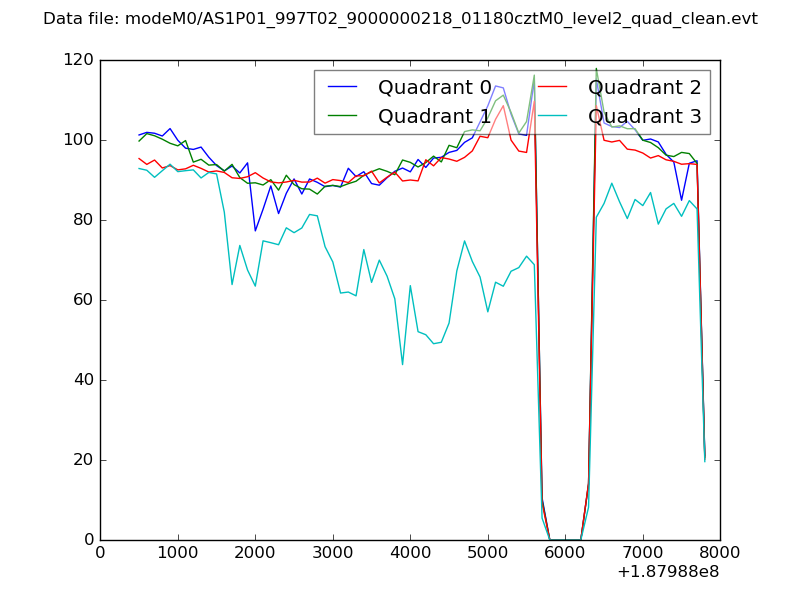 |
|
| Module-wise count rates for Quadrant A Data is divided into 100 sec bins |
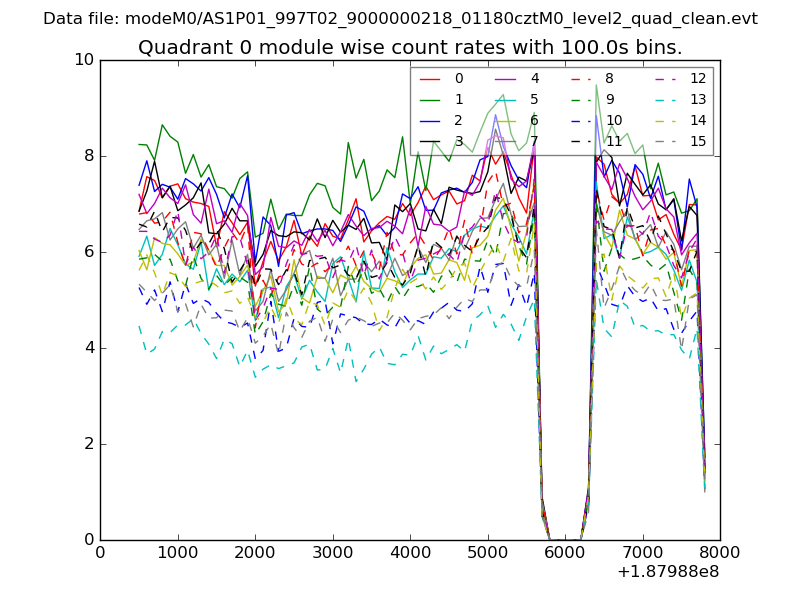 |
 |
| Module-wise count rates for Quadrant B Data is divided into 100 sec bins |
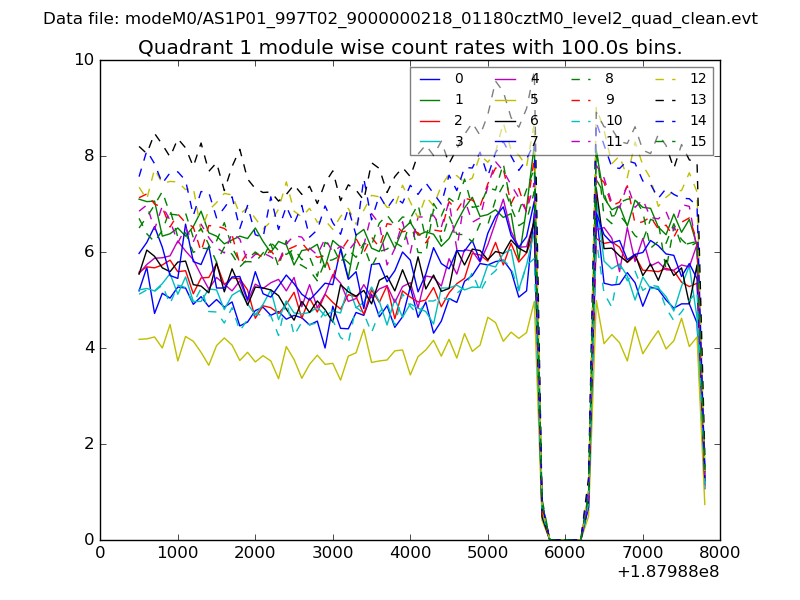 |
 |
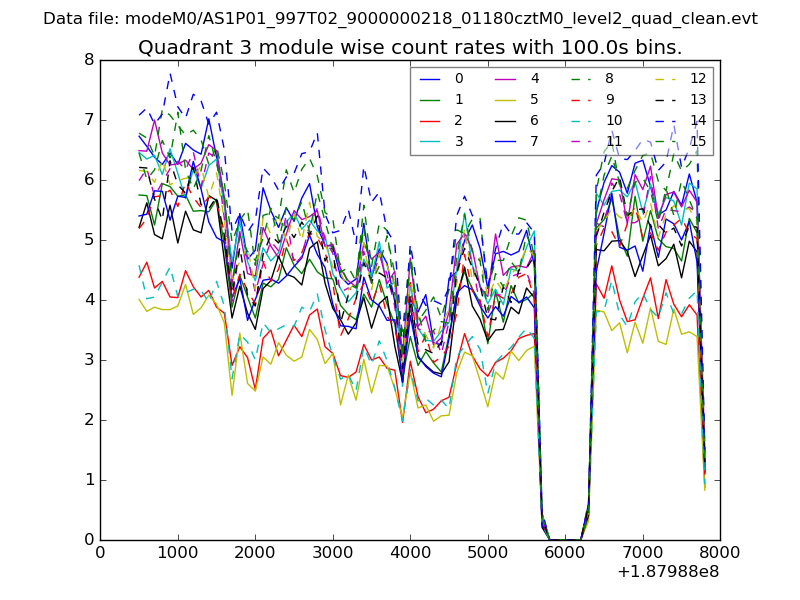
| Module-wise count rates for Quadrant C Data is divided into 100 sec bins |
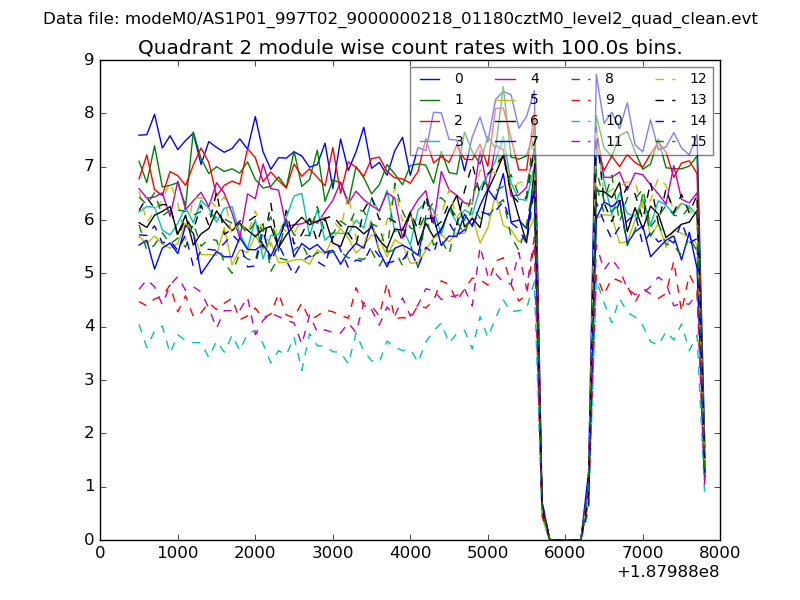 |
 |
| Module-wise count rates for Quadrant D Data is divided into 100 sec bins |
 |
 |
| Parameter | Plot |
|---|---|
| CZT HV Monitor | 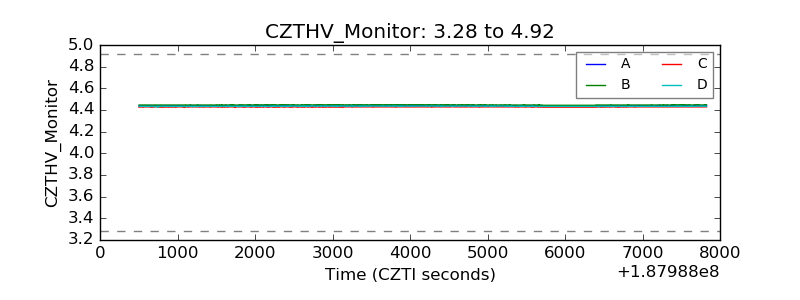 |
| D_VDD | 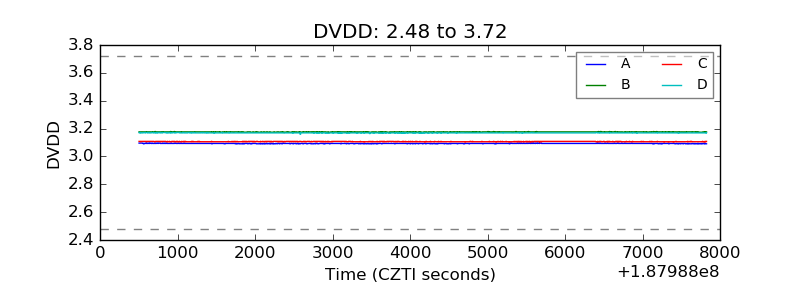 |
| Temperature 1 | 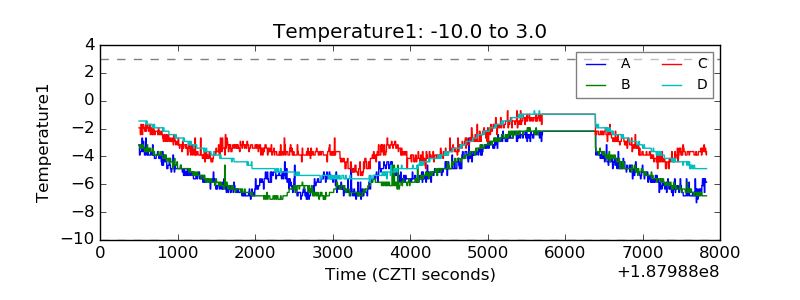 |
| Veto HV Monitor | 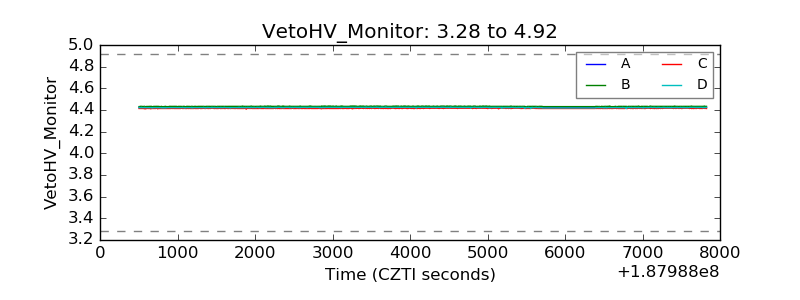 |
| Veto LLD | 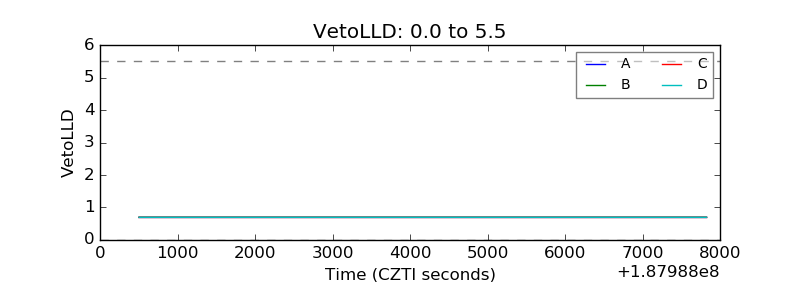 |
| Alpha Counter | 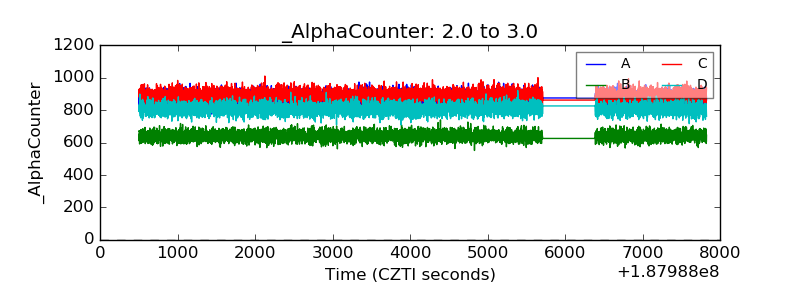 |
| _CPM_Rate | 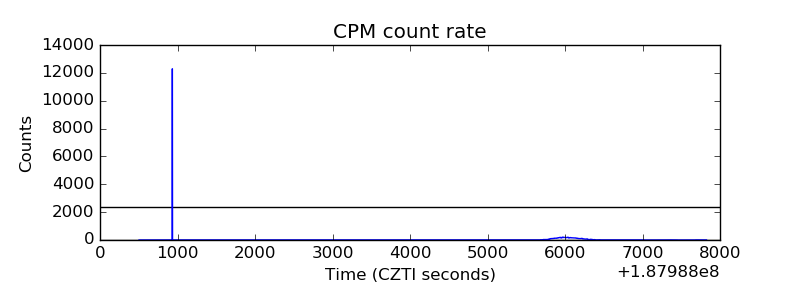 |
| CZT Counter | 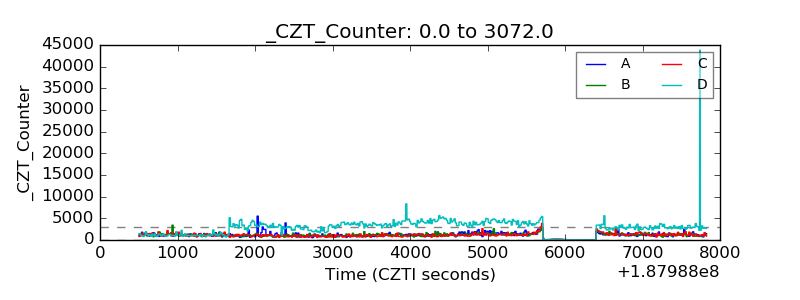 |
| +2.5 Volts monitor |  |
| +5 Volts monitor | 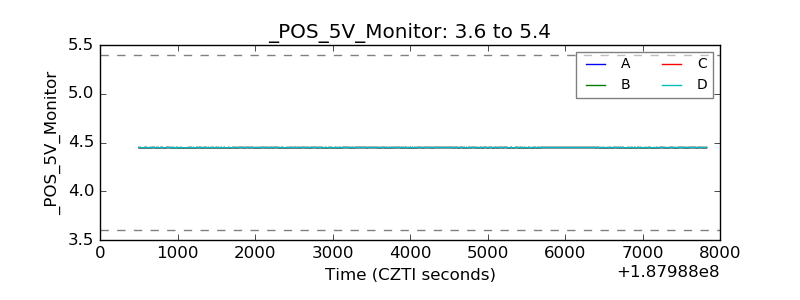 |
| _ROLL_ROT | 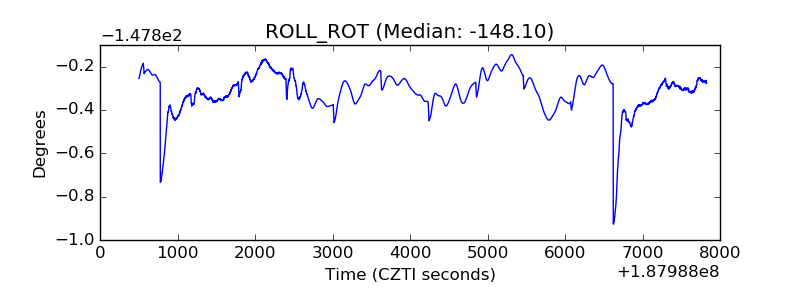 |
| _Roll_DEC | 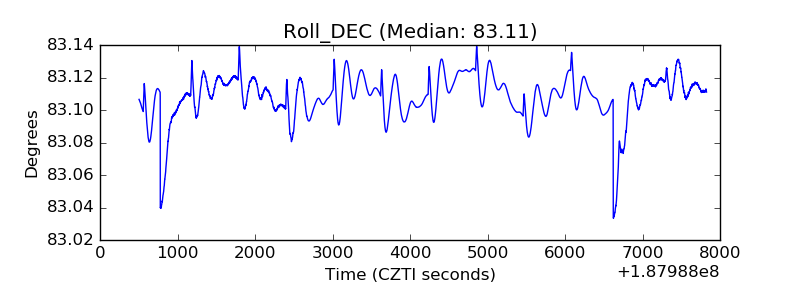 |
| _Roll_RA | 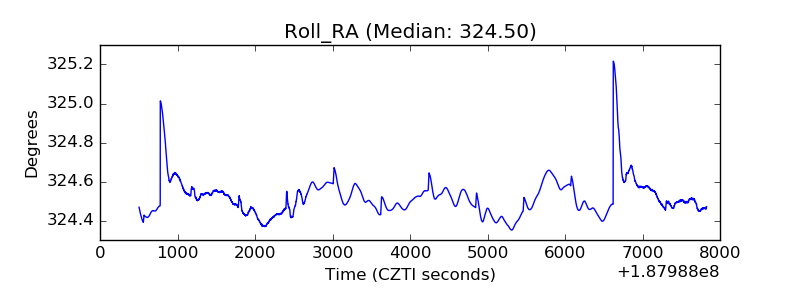 |
| Veto Counter | 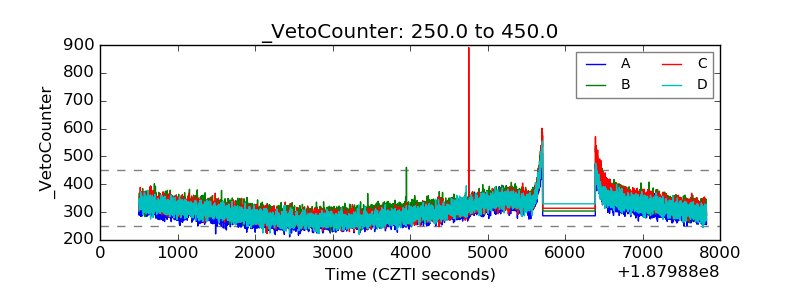 |