| Param | Original file | Final file |
|---|---|---|
| Filename | modeM0/AS1P01_997T02_9000000218_01181cztM0_level2.evt | modeM0/AS1P01_997T02_9000000218_01181cztM0_level2_quad_clean.evt |
| Size (bytes) | 1,418,425,920 | 89,121,600 |
| Size | 1.3 GB | 85.0 MB |
| Events in quadrant A | 7,904,030 | 607,764 |
| Events in quadrant B | 9,104,160 | 572,100 |
| Events in quadrant C | 7,467,425 | 604,804 |
| Events in quadrant D | 18,062,698 | 468,069 |
| Mode M9 | |||
|---|---|---|---|
| Quadrant | BADHDUFLAG | Total packets | Discarded packets |
| A | 0 | 9 | 0 |
| B | 0 | 9 | 0 |
| C | 0 | 9 | 0 |
| D | 0 | 9 | 0 |
| Mode M0 | |||
|---|---|---|---|
| Quadrant | BADHDUFLAG | Total packets | Discarded packets |
| A | 0 | 28032 | 2 |
| B | 0 | 31670 | 1 |
| C | 0 | 26684 | 1 |
| D | 0 | 58614 | 1 |
| Mode SS | |||
|---|---|---|---|
| Quadrant | BADHDUFLAG | Total packets | Discarded packets |
| A | 0 | 130 | 0 |
| B | 0 | 130 | 0 |
| C | 0 | 130 | 0 |
| D | 0 | 130 | 0 |
| Quadrant | Total seconds | Saturated seconds | Saturation percentage |
|---|---|---|---|
| A | 6362 | 184 | 2.892172% |
| B | 6362 | 670 | 10.531279% |
| C | 6362 | 5 | 0.078592% |
| D | 6362 | 3343 | 52.546369% |
Noise dominated data is calculated using 1-second bins in cleaned event files. If a bin has >2000 counts, and if more than 50% of those come from <1% of pixels, then it is considered to be noise-dominated and hence unusable.
| Quadrant | # 1 sec bins | Bins with >0 counts | Bins with >2000 counts | High rate bins dominated by noise | Noise dominated (total time) | Noise dominated (detector-on time) | Marked lightcurve |
|---|---|---|---|---|---|---|---|
| A | 7267 | 6363 | 379 | 379 | 5.22% | 5.96% | 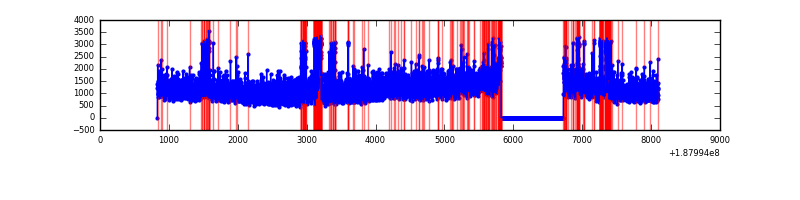 |
| B | 7267 | 6363 | 954 | 954 | 13.13% | 14.99% |  |
| C | 7266 | 6362 | 122 | 122 | 1.68% | 1.92% | 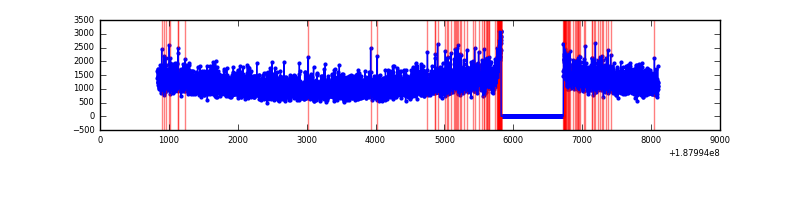 |
| D | 7267 | 6363 | 6177 | 6177 | 85.00% | 97.08% |  |
Top three noisy pixels from each quadrant. If the there are fewer than three noisy pixels in the level2.evt file, extra rows are filled as -1
| Pixel properties | Quadrant properties | ||||||
|---|---|---|---|---|---|---|---|
| Quadrant | DetID | PixID | Counts | Sigma | Mean | Median | Sigma |
| A | 4 | 32 | 673776 | 1500.24 | 1867 | 1881 | 447.9 |
| A | 15 | 233 | 59063 | 127.68 | 1867 | 1881 | 447.9 |
| A | 11 | 79 | 8384 | 14.52 | 1867 | 1881 | 447.9 |
| B | 8 | 234 | 1843658 | 4184.44 | 1869 | 1881 | 440.1 |
| B | 6 | 53 | 63721 | 140.5 | 1869 | 1881 | 440.1 |
| B | 15 | 22 | 24568 | 51.54 | 1869 | 1881 | 440.1 |
| C | 15 | 241 | 355322 | 695.41 | 1811 | 1877 | 508.3 |
| C | 3 | 111 | 20212 | 36.07 | 1811 | 1877 | 508.3 |
| C | 3 | 79 | 12262 | 20.43 | 1811 | 1877 | 508.3 |
| D | 1 | 239 | 10692503 | 22780.62 | 1518 | 1571 | 469.3 |
| D | 10 | 84 | 887710 | 1888.22 | 1518 | 1571 | 469.3 |
| D | 2 | 16 | 750467 | 1595.77 | 1518 | 1571 | 469.3 |
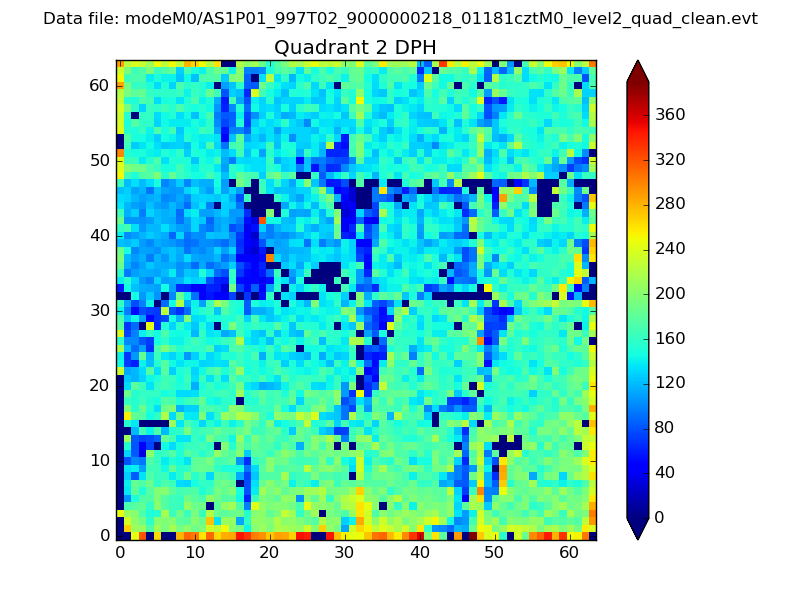
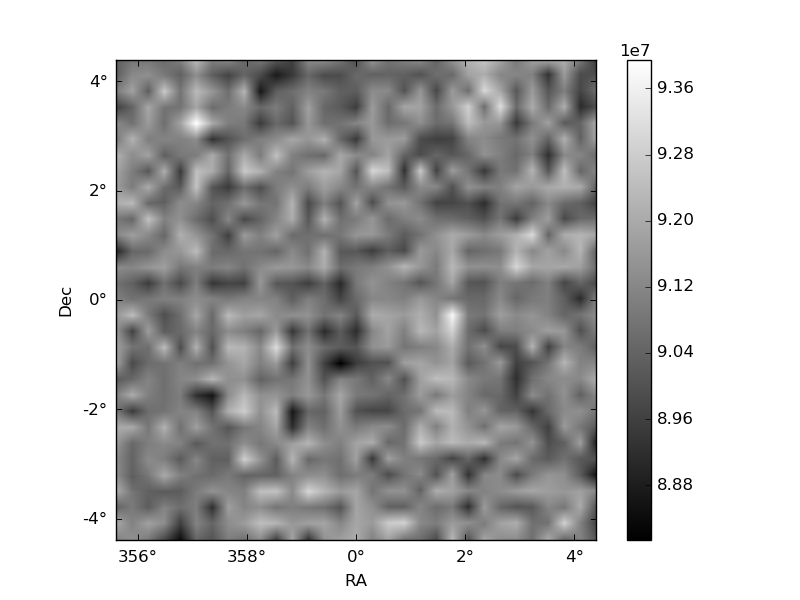
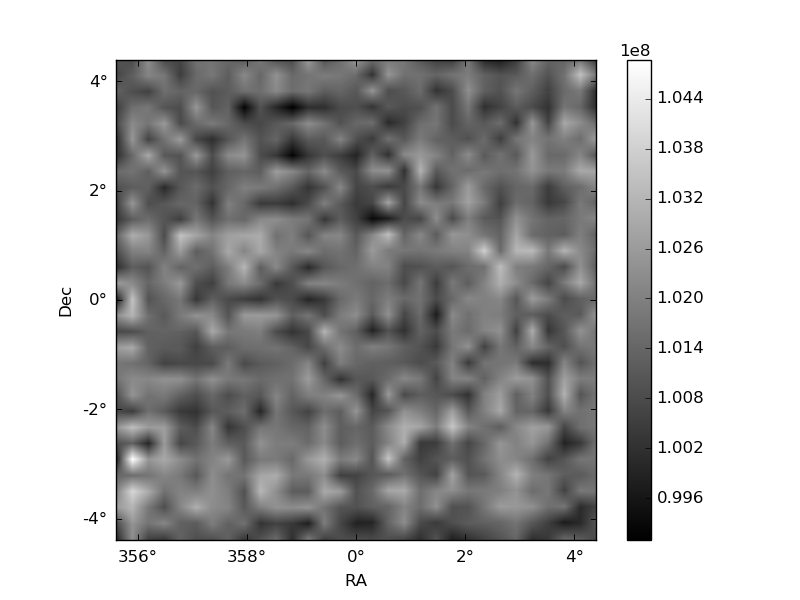
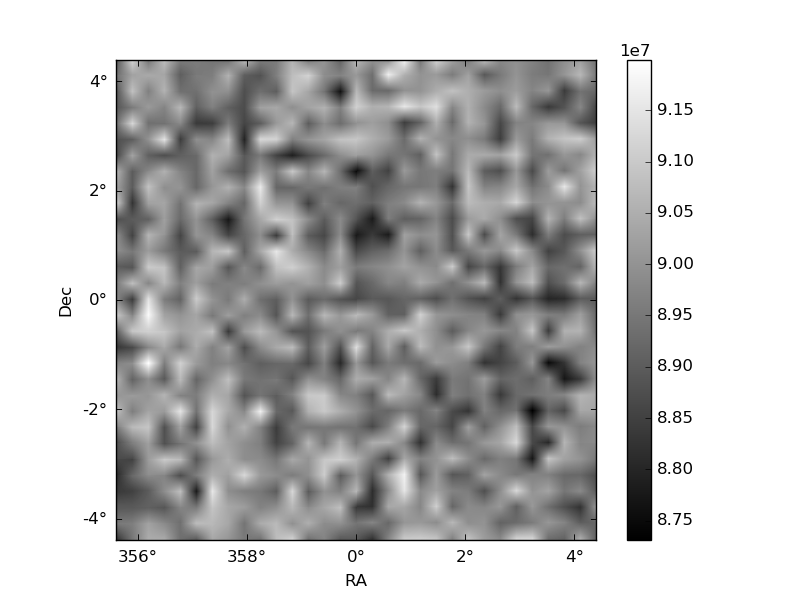
Histogram calculated using DETX and DETY for each event in the final _common_clean file
| Quadrant A | 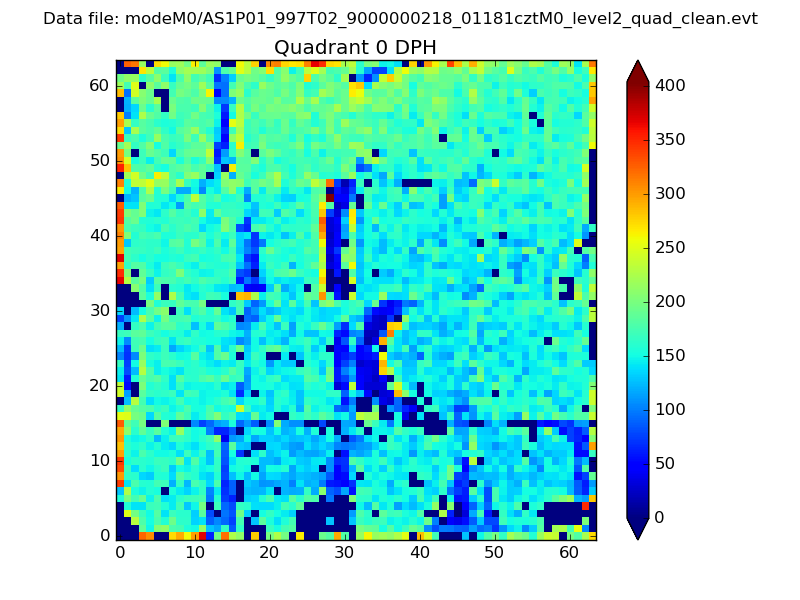 |
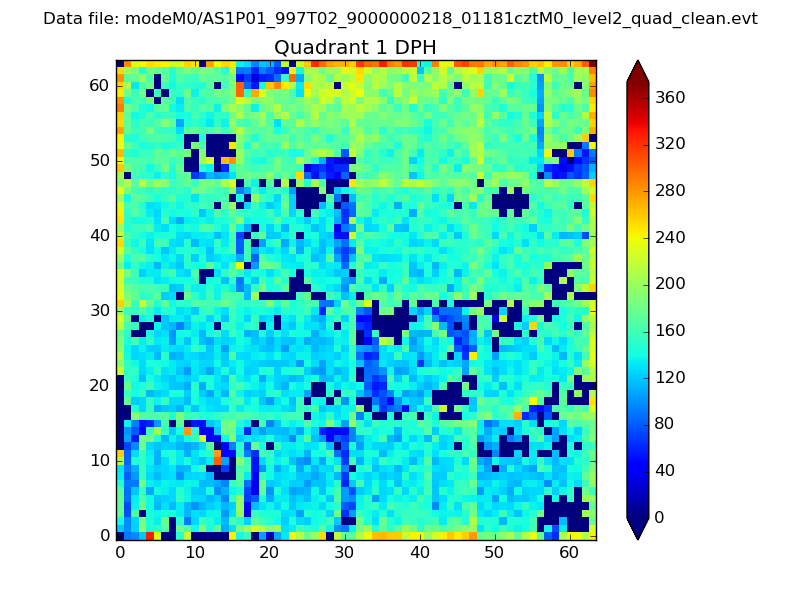 |
Quadrant B |
|---|---|---|---|
| Quadrant D | 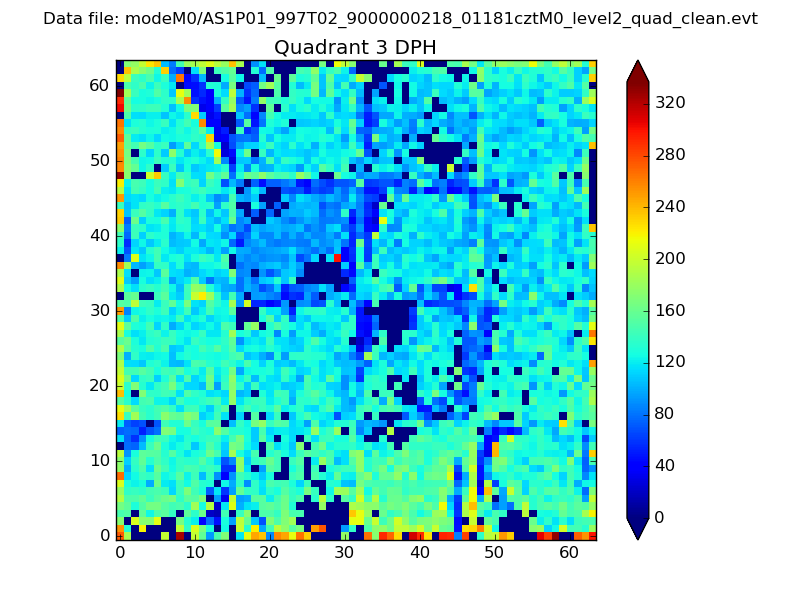 |
 |
Quadrant C |
| Plot type | Count rate plots | Images |
|---|---|---|
| Comparison with Poisson distribution Blue bars denote a histogram of data divided into 1 sec bins. Red curve is a Poisson curve with rate = median count rate of data. |
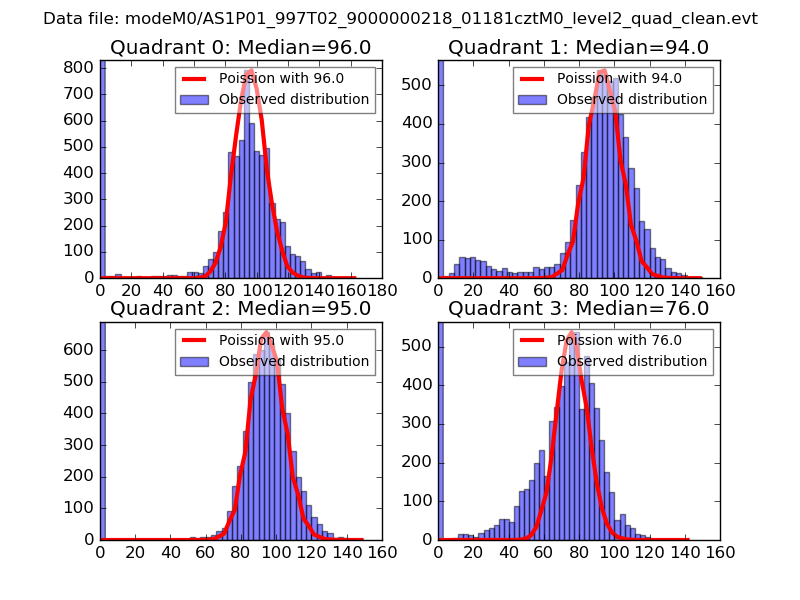 |
 |
| Quadrant-wise count rates Data is divided into 100 sec bins |
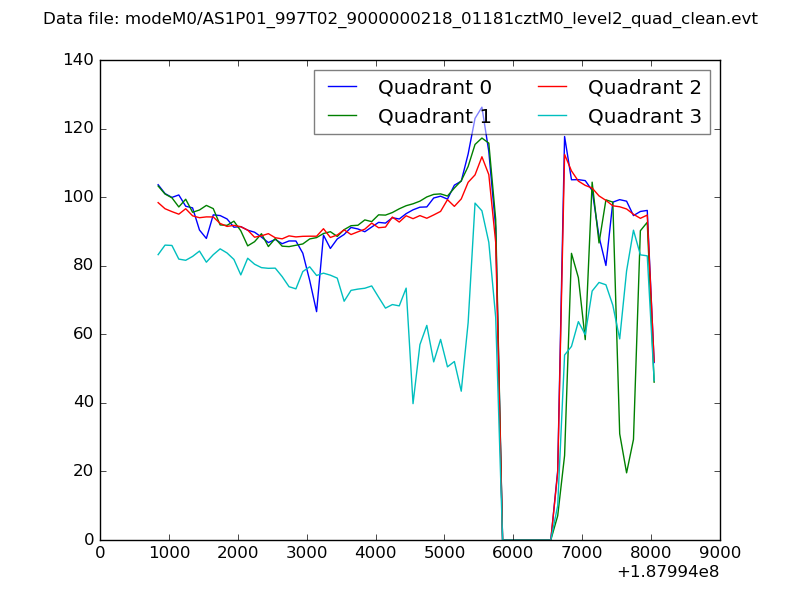 |
|
| Module-wise count rates for Quadrant A Data is divided into 100 sec bins |
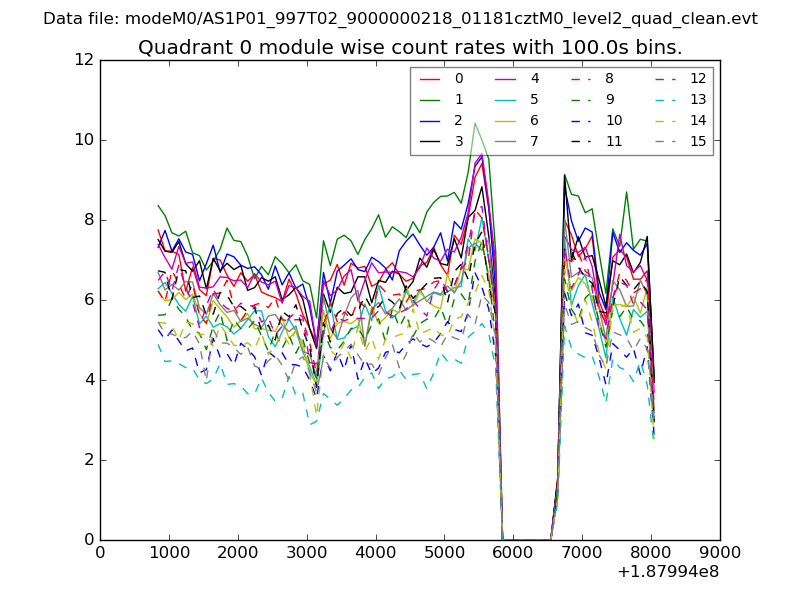 |
 |
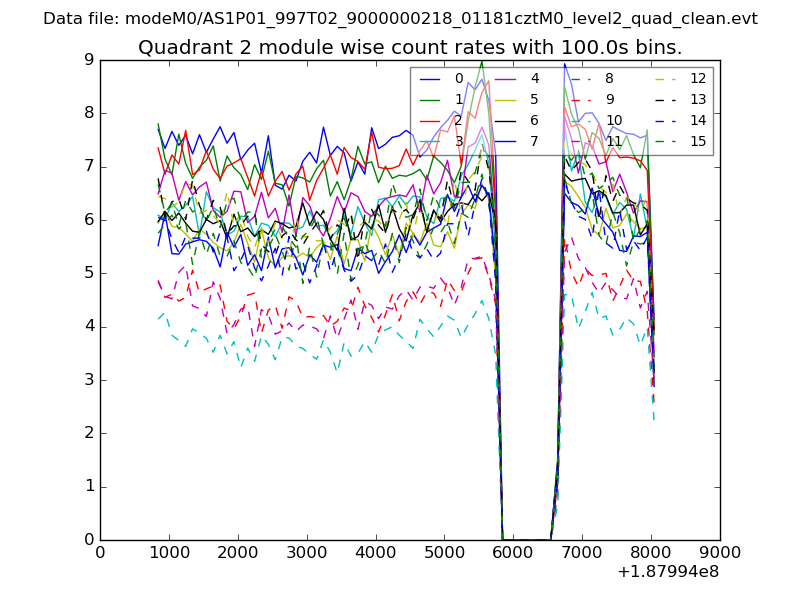
| Module-wise count rates for Quadrant B Data is divided into 100 sec bins |
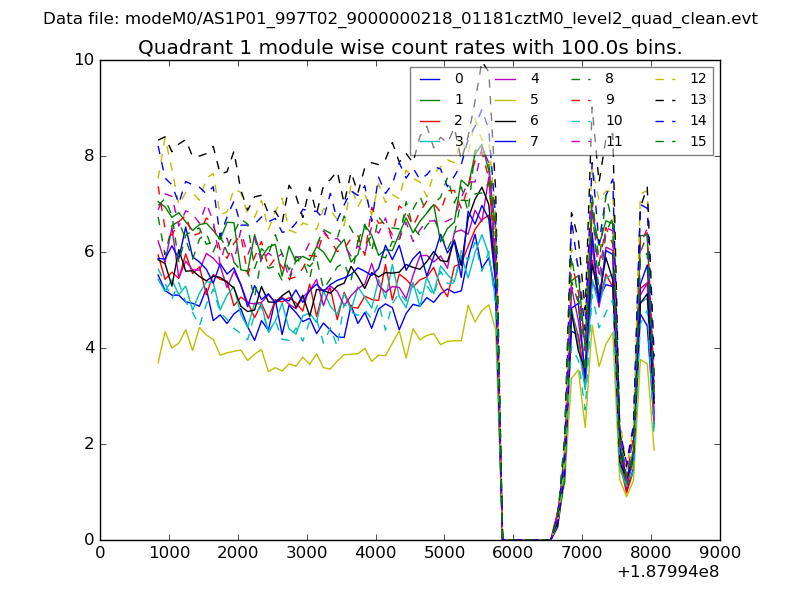 |
 |
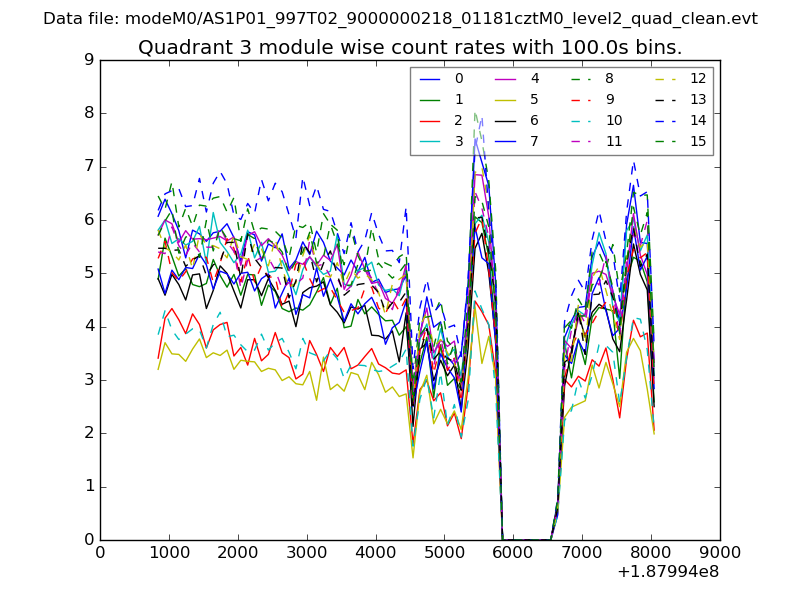
| Module-wise count rates for Quadrant C Data is divided into 100 sec bins |
 |
 |
| Module-wise count rates for Quadrant D Data is divided into 100 sec bins |
 |
 |
| Parameter | Plot |
|---|---|
| CZT HV Monitor | 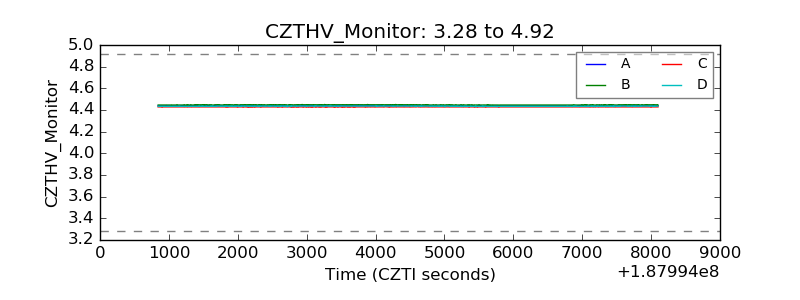 |
| D_VDD | 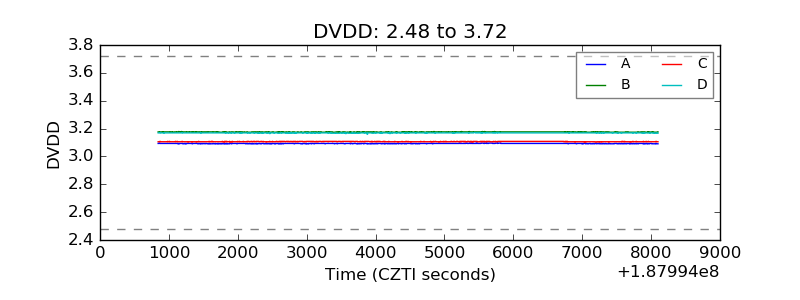 |
| Temperature 1 | 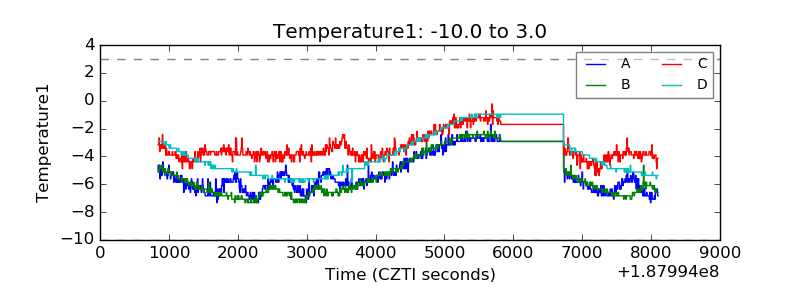 |
| Veto HV Monitor | 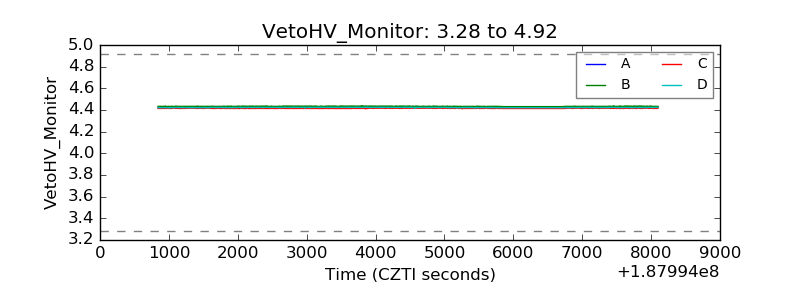 |
| Veto LLD | 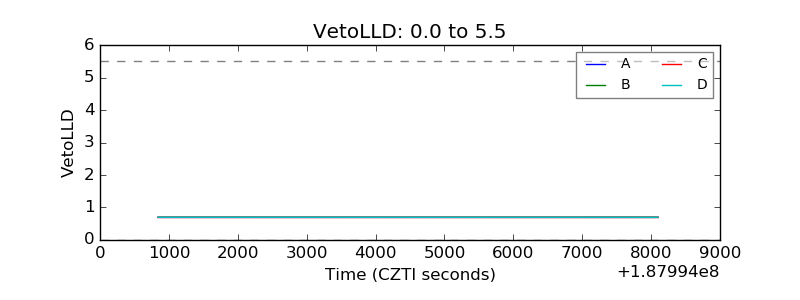 |
| Alpha Counter | 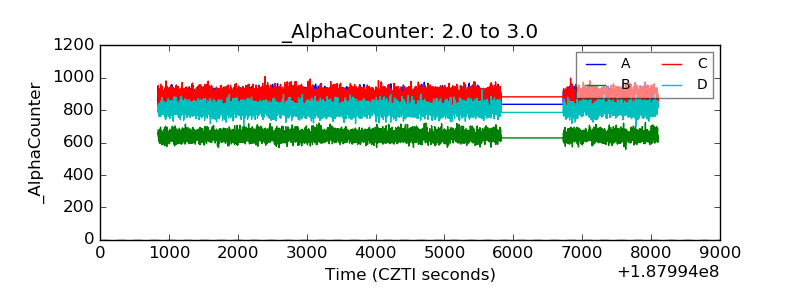 |
| _CPM_Rate | 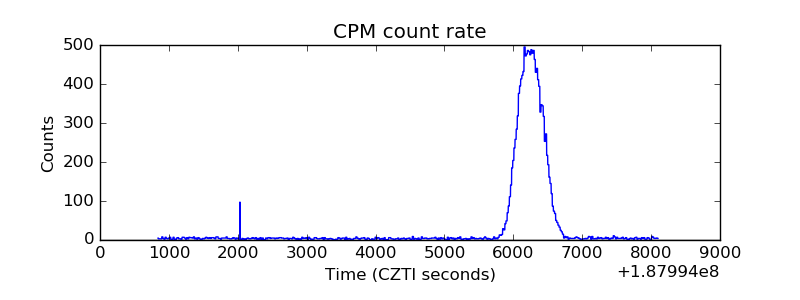 |
| CZT Counter | 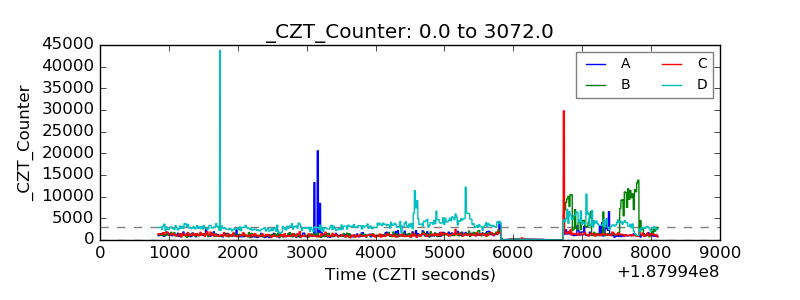 |
| +2.5 Volts monitor |  |
| +5 Volts monitor |  |
| _ROLL_ROT | 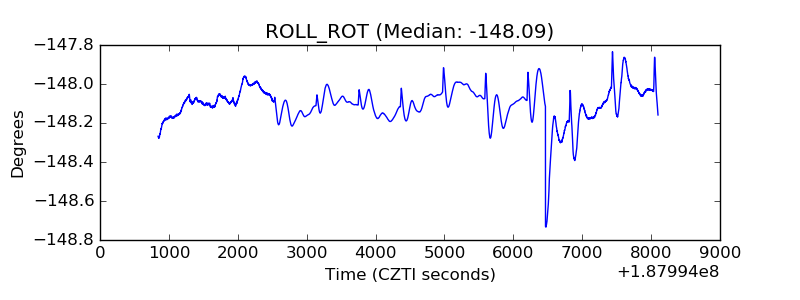 |
| _Roll_DEC | 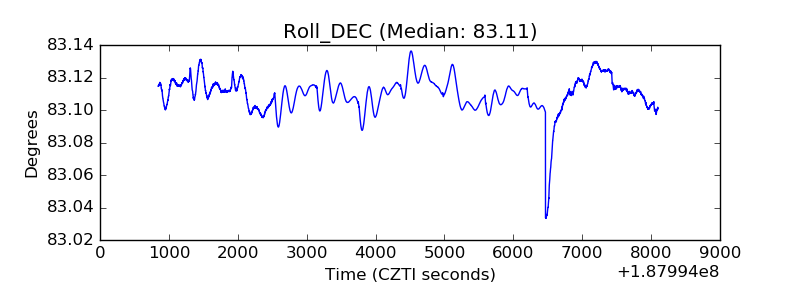 |
| _Roll_RA | 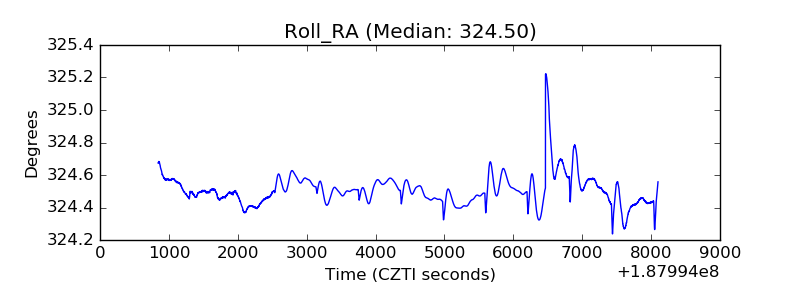 |
| Veto Counter | 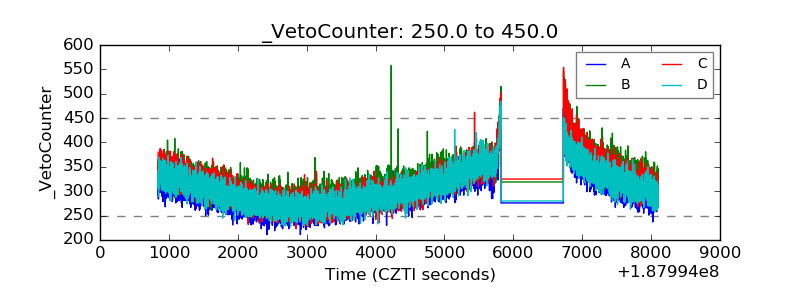 |