| Param | Original file | Final file |
|---|---|---|
| Filename | modeM0/AS1P01_997T02_9000000218_01182cztM0_level2.evt | modeM0/AS1P01_997T02_9000000218_01182cztM0_level2_quad_clean.evt |
| Size (bytes) | 1,099,543,680 | 68,333,760 |
| Size | 1.0 GB | 65.2 MB |
| Events in quadrant A | 5,795,284 | 466,994 |
| Events in quadrant B | 7,988,446 | 411,411 |
| Events in quadrant C | 5,547,716 | 461,882 |
| Events in quadrant D | 13,646,870 | 385,032 |
| Mode M9 | |||
|---|---|---|---|
| Quadrant | BADHDUFLAG | Total packets | Discarded packets |
| A | 0 | 1 | 0 |
| B | 0 | 1 | 0 |
| C | 0 | 1 | 0 |
| D | 0 | 1 | 0 |
| Mode M0 | |||
|---|---|---|---|
| Quadrant | BADHDUFLAG | Total packets | Discarded packets |
| A | 0 | 20696 | 0 |
| B | 0 | 27318 | 0 |
| C | 0 | 19963 | 0 |
| D | 0 | 44162 | 0 |
| Mode SS | |||
|---|---|---|---|
| Quadrant | BADHDUFLAG | Total packets | Discarded packets |
| A | 0 | 100 | 0 |
| B | 0 | 100 | 0 |
| C | 0 | 100 | 0 |
| D | 0 | 100 | 0 |
| Quadrant | Total seconds | Saturated seconds | Saturation percentage |
|---|---|---|---|
| A | 4882 | 77 | 1.577222% |
| B | 4882 | 926 | 18.967636% |
| C | 4882 | 3 | 0.061450% |
| D | 4882 | 1700 | 34.821794% |
Noise dominated data is calculated using 1-second bins in cleaned event files. If a bin has >2000 counts, and if more than 50% of those come from <1% of pixels, then it is considered to be noise-dominated and hence unusable.
| Quadrant | # 1 sec bins | Bins with >0 counts | Bins with >2000 counts | High rate bins dominated by noise | Noise dominated (total time) | Noise dominated (detector-on time) | Marked lightcurve |
|---|---|---|---|---|---|---|---|
| A | 4882 | 4882 | 201 | 201 | 4.12% | 4.12% | 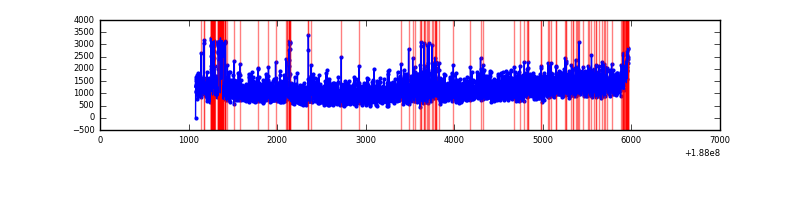 |
| B | 4882 | 4882 | 1247 | 1247 | 25.54% | 25.54% | 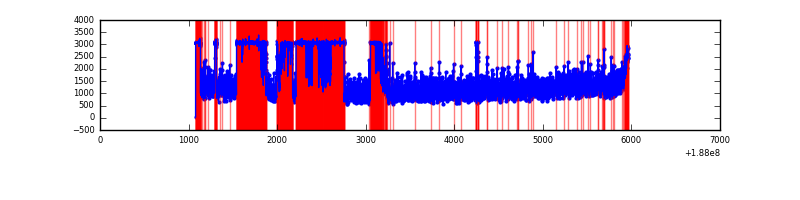 |
| C | 4882 | 4882 | 81 | 81 | 1.66% | 1.66% | 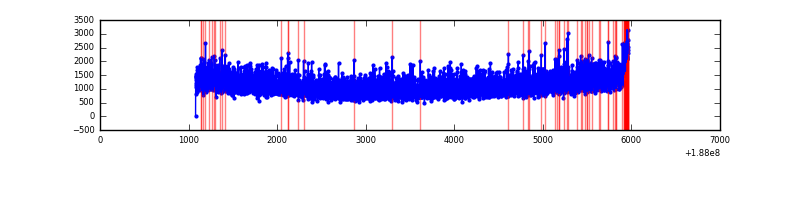 |
| D | 4882 | 4882 | 4793 | 4793 | 98.18% | 98.18% | 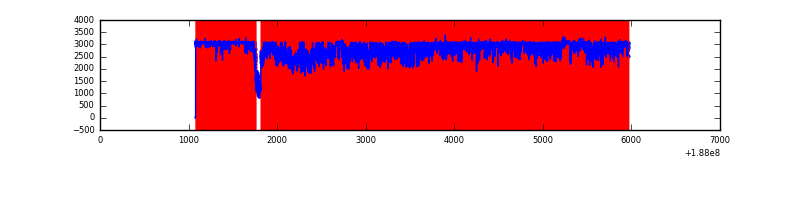 |
Top three noisy pixels from each quadrant. If the there are fewer than three noisy pixels in the level2.evt file, extra rows are filled as -1
| Pixel properties | Quadrant properties | ||||||
|---|---|---|---|---|---|---|---|
| Quadrant | DetID | PixID | Counts | Sigma | Mean | Median | Sigma |
| A | 4 | 32 | 287843 | 842.48 | 1420 | 1434 | 340.0 |
| A | 15 | 233 | 30192 | 84.59 | 1420 | 1434 | 340.0 |
| A | 8 | 14 | 16867 | 45.4 | 1420 | 1434 | 340.0 |
| B | 8 | 234 | 2802175 | 8725.19 | 1345 | 1354 | 321.0 |
| B | 5 | 191 | 35194 | 105.42 | 1345 | 1354 | 321.0 |
| B | 6 | 53 | 10767 | 29.32 | 1345 | 1354 | 321.0 |
| C | 15 | 241 | 269688 | 716.6 | 1343 | 1390 | 374.4 |
| C | 3 | 111 | 15556 | 37.84 | 1343 | 1390 | 374.4 |
| C | 3 | 79 | 10486 | 24.29 | 1343 | 1390 | 374.4 |
| D | 1 | 239 | 8555274 | 22509.57 | 1218 | 1261 | 380.0 |
| D | 10 | 84 | 486855 | 1277.82 | 1218 | 1261 | 380.0 |
| D | 10 | 85 | 23727 | 59.12 | 1218 | 1261 | 380.0 |
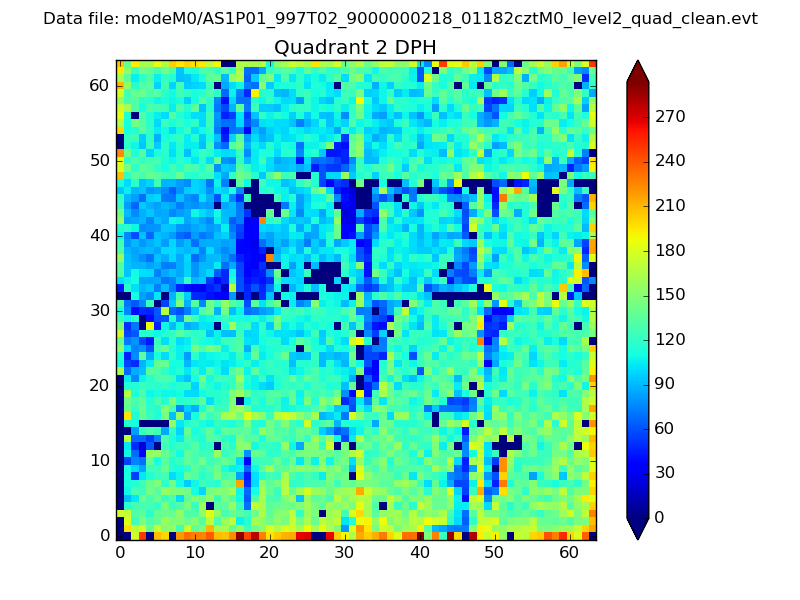
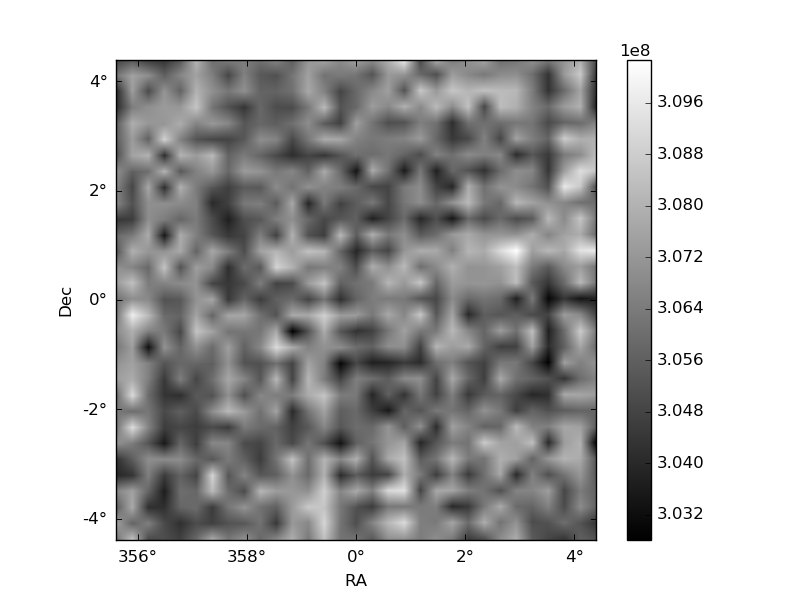
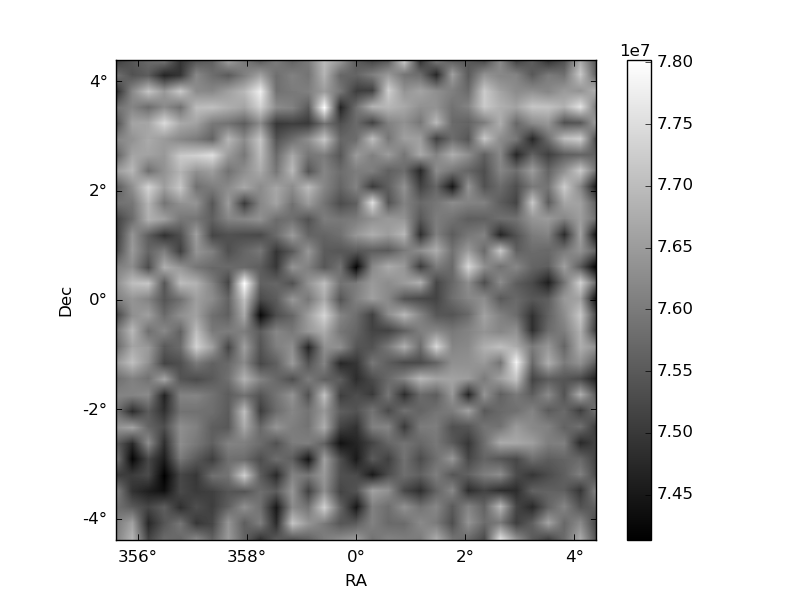
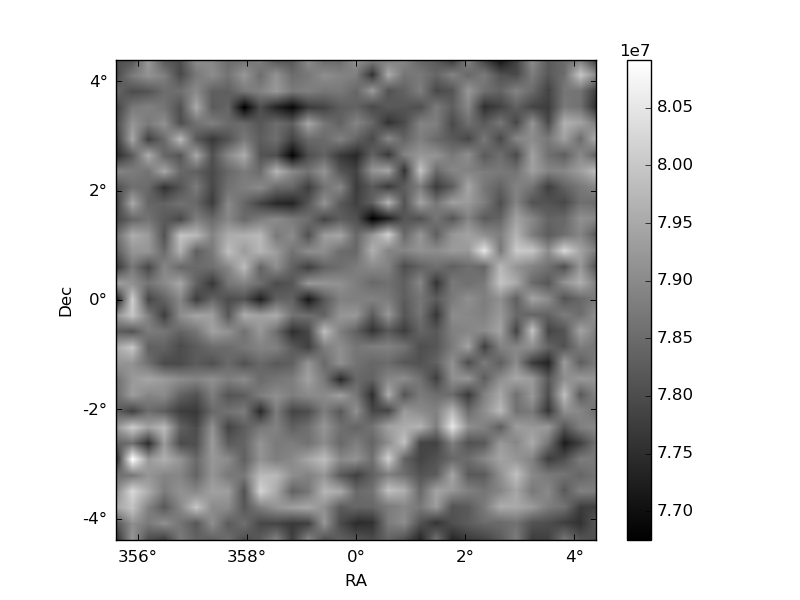
Histogram calculated using DETX and DETY for each event in the final _common_clean file
| Quadrant A | 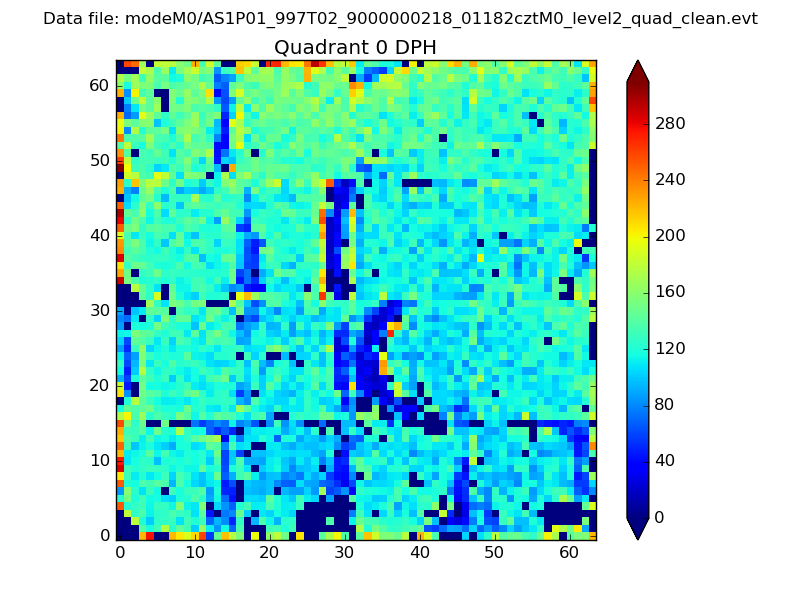 |
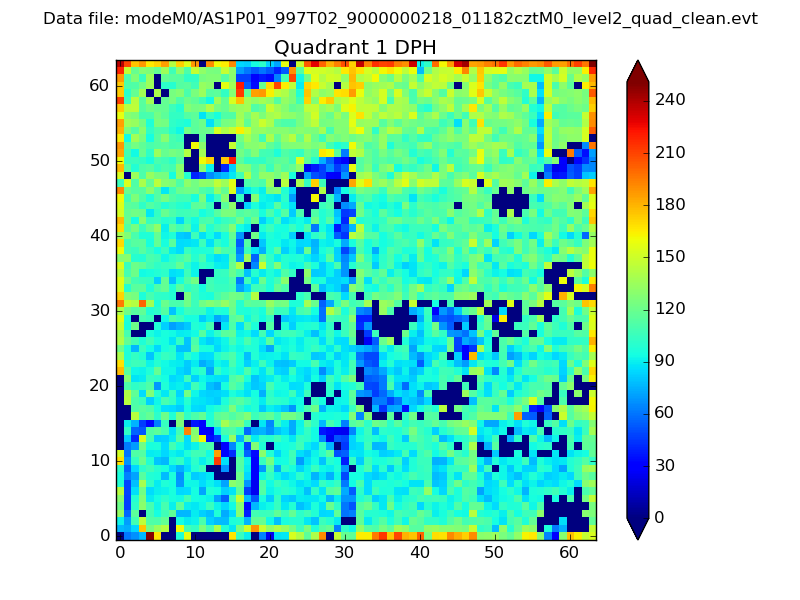 |
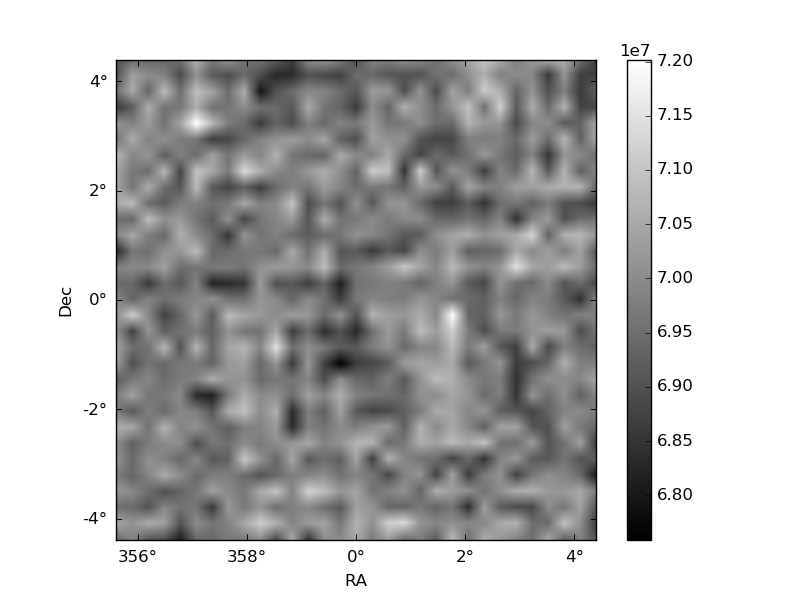
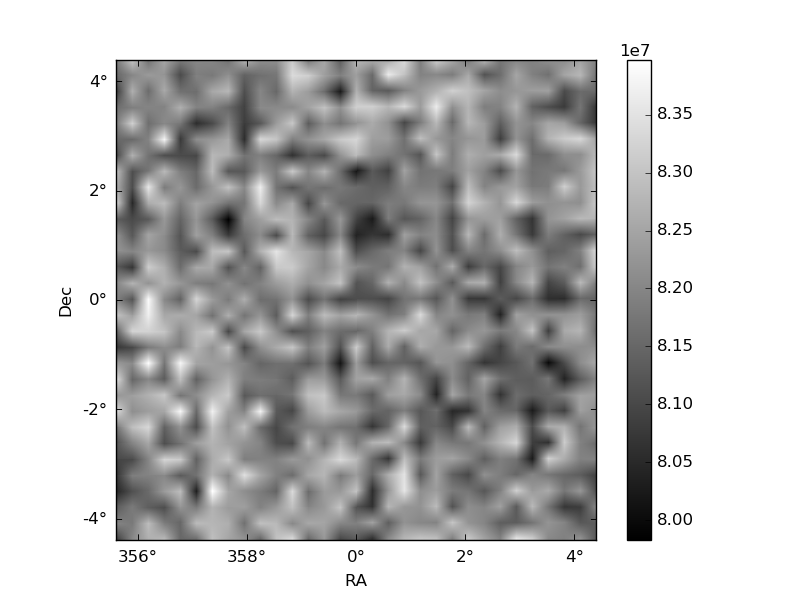
Quadrant B |
|---|---|---|---|
| Quadrant D | 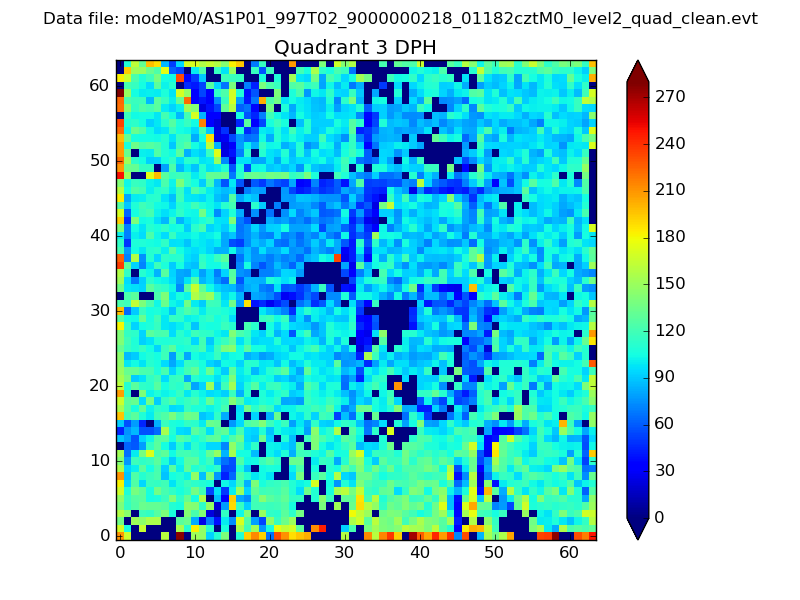 |
 |
Quadrant C |
| Plot type | Count rate plots | Images |
|---|---|---|
| Comparison with Poisson distribution Blue bars denote a histogram of data divided into 1 sec bins. Red curve is a Poisson curve with rate = median count rate of data. |
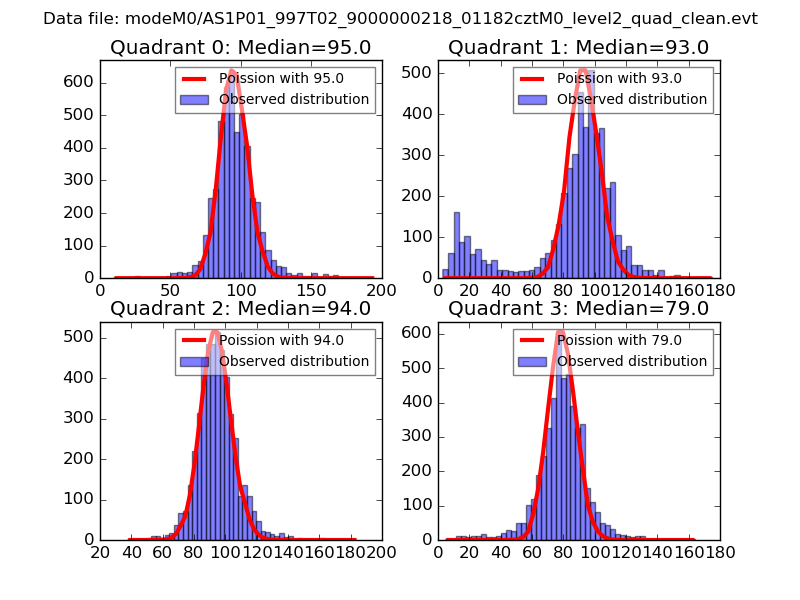 |
 |
| Quadrant-wise count rates Data is divided into 100 sec bins |
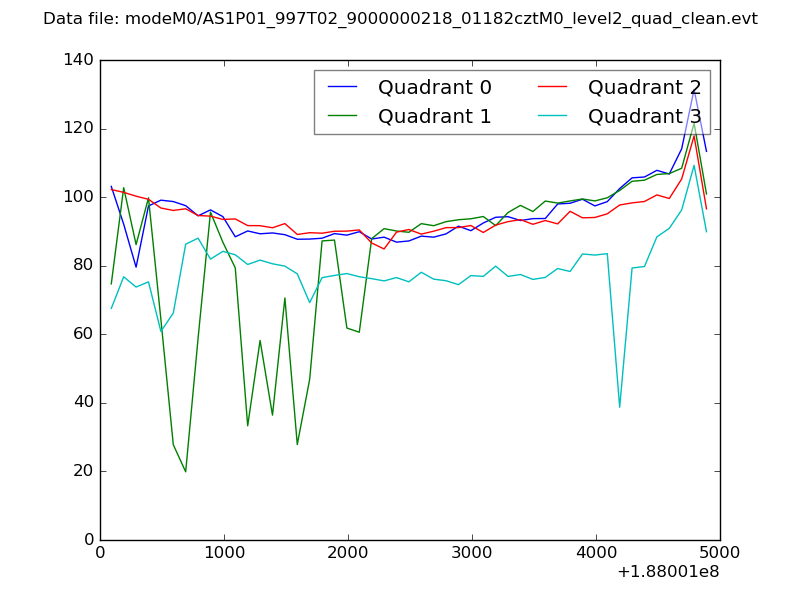 |
|
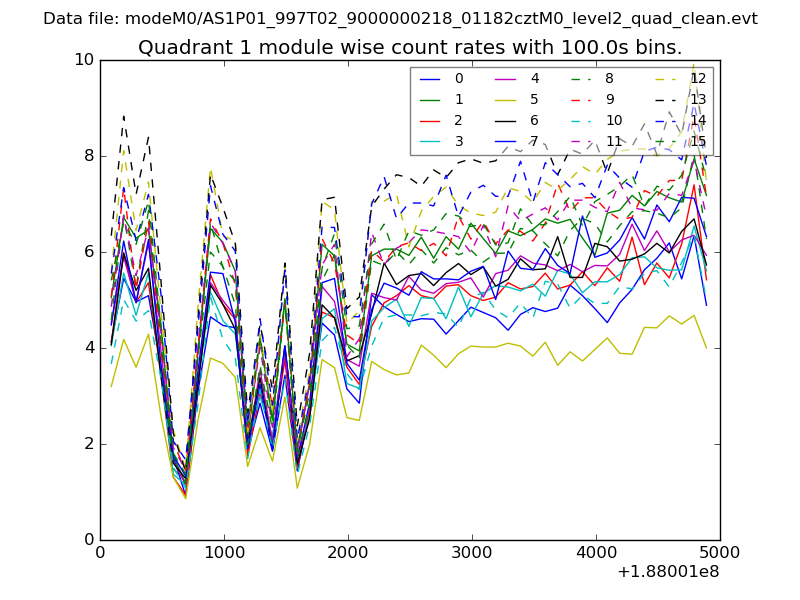
| Module-wise count rates for Quadrant A Data is divided into 100 sec bins |
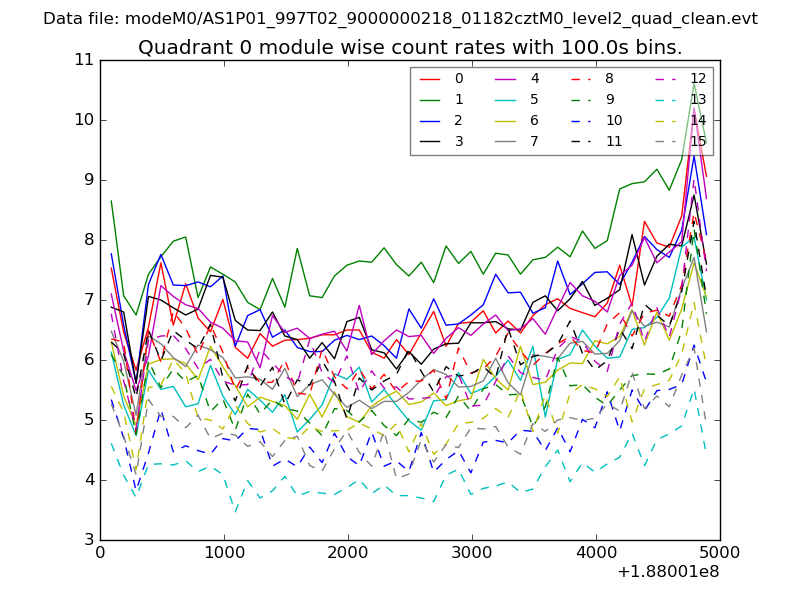 |
 |
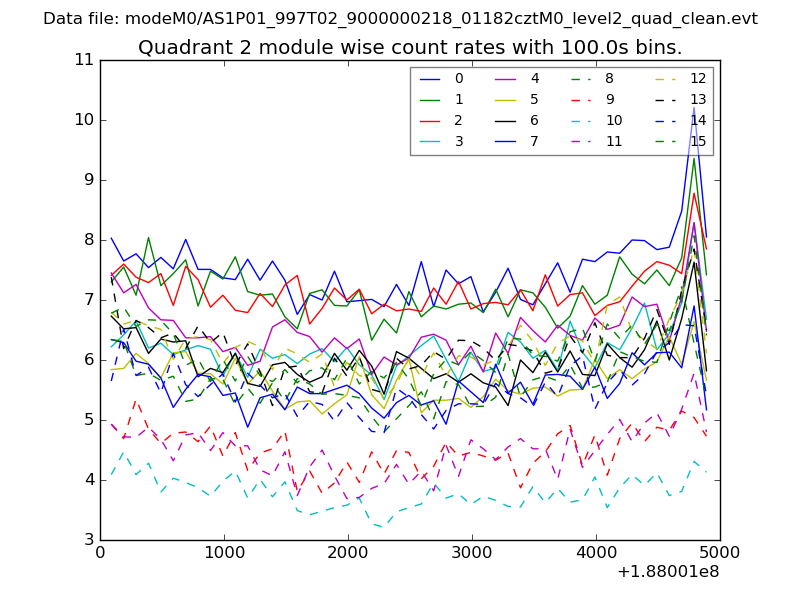
| Module-wise count rates for Quadrant B Data is divided into 100 sec bins |
 |
 |
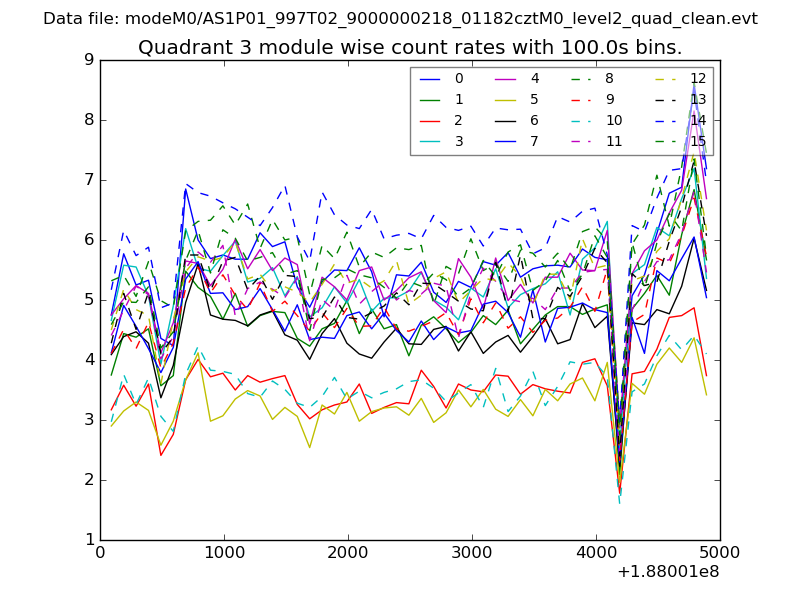
| Module-wise count rates for Quadrant C Data is divided into 100 sec bins |
 |
 |
| Module-wise count rates for Quadrant D Data is divided into 100 sec bins |
 |
 |
| Parameter | Plot |
|---|---|
| CZT HV Monitor | 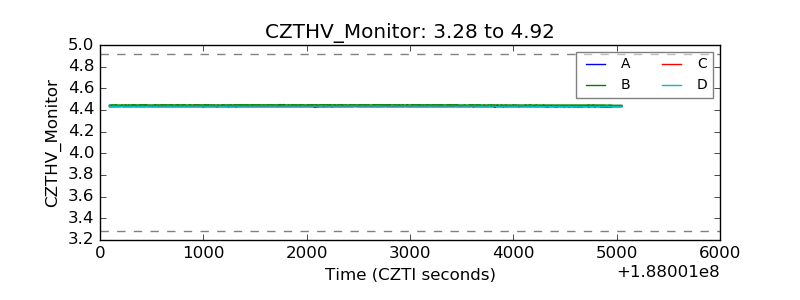 |
| D_VDD | 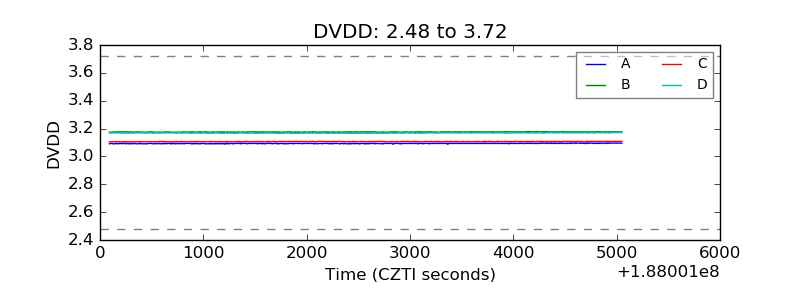 |
| Temperature 1 | 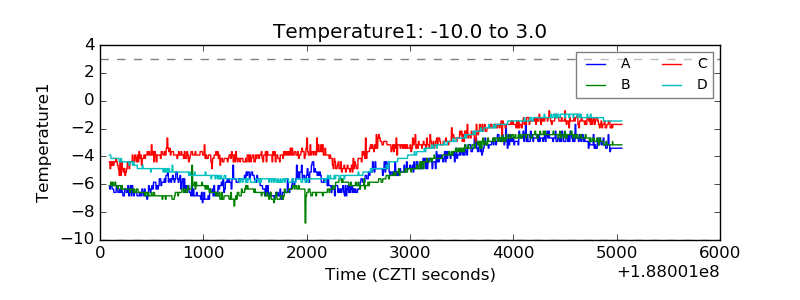 |
| Veto HV Monitor | 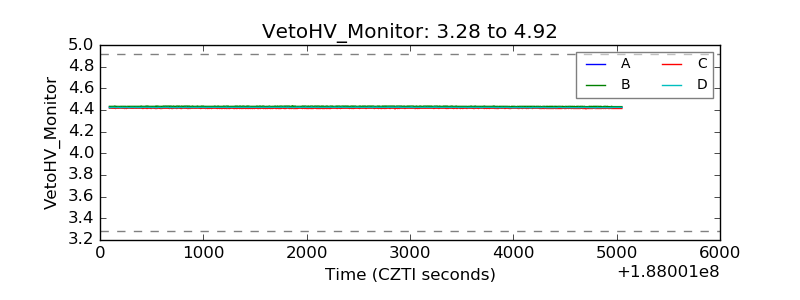 |
| Veto LLD | 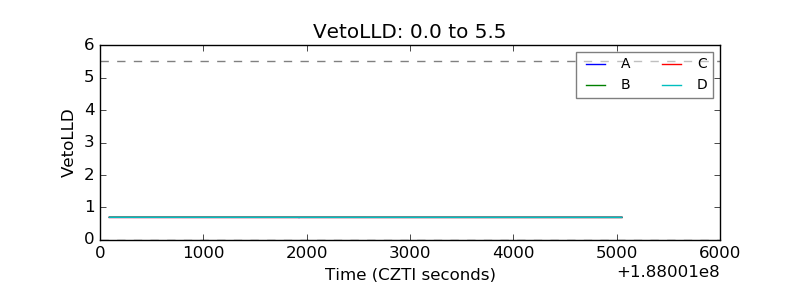 |
| Alpha Counter | 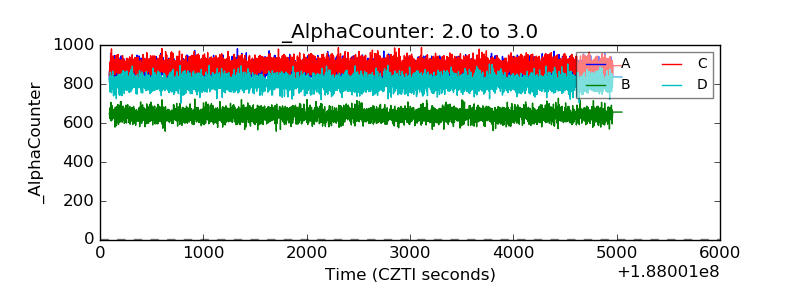 |
| _CPM_Rate | 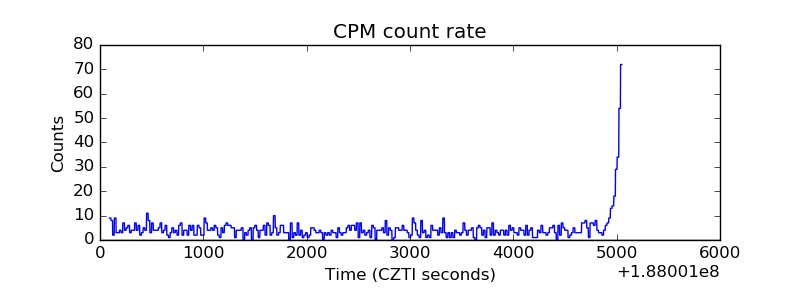 |
| CZT Counter | 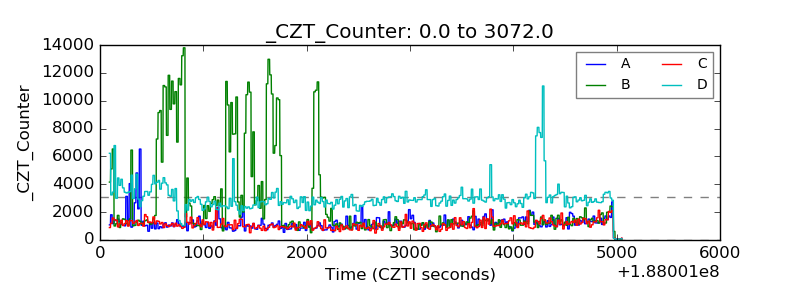 |
| +2.5 Volts monitor |  |
| +5 Volts monitor | 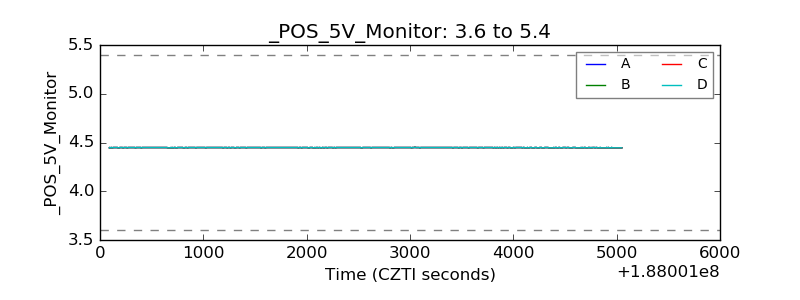 |
| _ROLL_ROT | 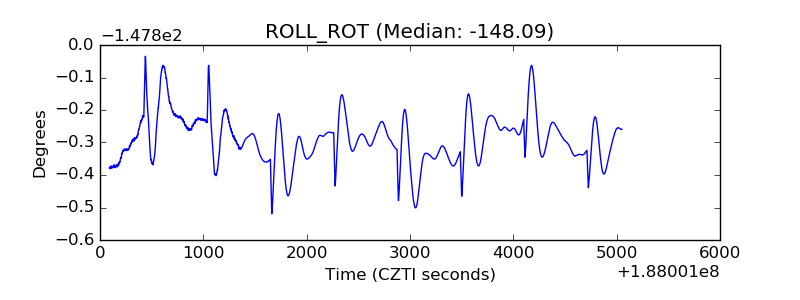 |
| _Roll_DEC | 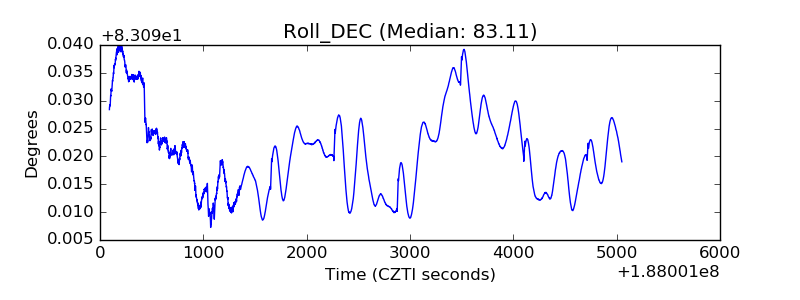 |
| _Roll_RA | 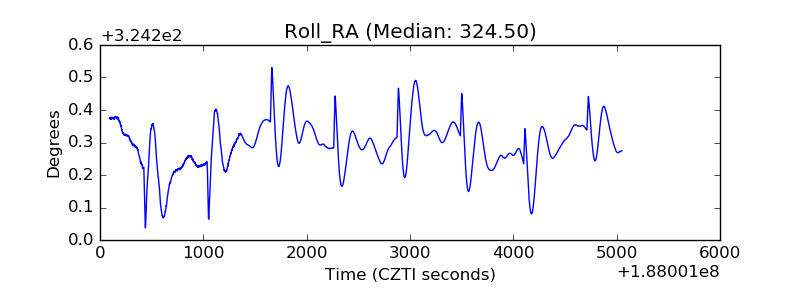 |
| Veto Counter | 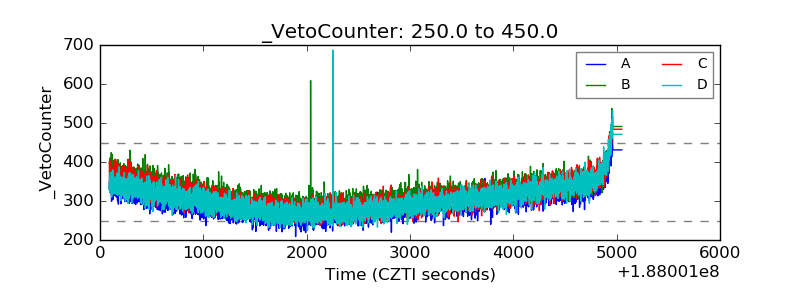 |