| Param | Original file | Final file |
|---|---|---|
| Filename | modeM0/AS1P01_997T02_9000000218_01184cztM0_level2.evt | modeM0/AS1P01_997T02_9000000218_01184cztM0_level2_quad_clean.evt |
| Size (bytes) | 116,634,240 | 8,029,440 |
| Size | 111.2 MB | 7.7 MB |
| Events in quadrant A | 596,274 | 56,927 |
| Events in quadrant B | 647,743 | 57,376 |
| Events in quadrant C | 630,839 | 56,438 |
| Events in quadrant D | 1,618,944 | 26,794 |
| Mode M9 | |||
|---|---|---|---|
| Quadrant | BADHDUFLAG | Total packets | Discarded packets |
| A | 1 | 251318637792 | 0 |
| B | 1 | -1 | -1 |
| C | 1 | -1 | -1 |
| D | 1 | -1 | -1 |
| Mode M0 | |||
|---|---|---|---|
| Quadrant | BADHDUFLAG | Total packets | Discarded packets |
| A | 0 | 2604 | 453 |
| B | 0 | 2796 | 491 |
| C | 0 | 2674 | 424 |
| D | 0 | 6340 | 1070 |
| Mode SS | |||
|---|---|---|---|
| Quadrant | BADHDUFLAG | Total packets | Discarded packets |
| A | 0 | 12 | 2 |
| B | 0 | 12 | 2 |
| C | 0 | 14 | 4 |
| D | 0 | 12 | 2 |
| Quadrant | Total seconds | Saturated seconds | Saturation percentage |
|---|---|---|---|
| A | 532 | 0 | 0.000000% |
| B | 530 | 0 | 0.000000% |
| C | 533 | 0 | 0.000000% |
| D | 527 | 527 | 100.000000% |
Noise dominated data is calculated using 1-second bins in cleaned event files. If a bin has >2000 counts, and if more than 50% of those come from <1% of pixels, then it is considered to be noise-dominated and hence unusable.
| Quadrant | # 1 sec bins | Bins with >0 counts | Bins with >2000 counts | High rate bins dominated by noise | Noise dominated (total time) | Noise dominated (detector-on time) | Marked lightcurve |
|---|---|---|---|---|---|---|---|
| A | 535 | 534 | 5 | 5 | 0.93% | 0.94% | 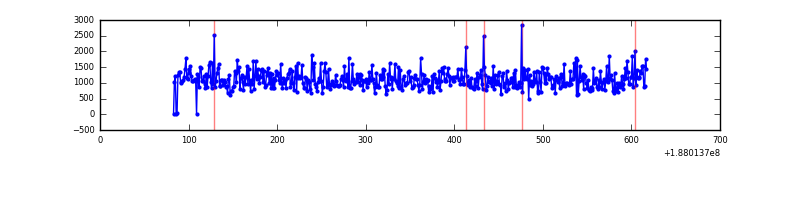 |
| B | 535 | 534 | 6 | 6 | 1.12% | 1.12% | 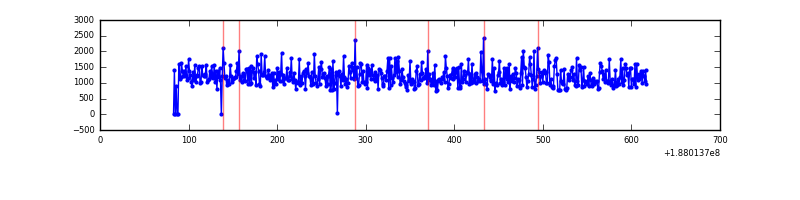 |
| C | 533 | 533 | 8 | 8 | 1.50% | 1.50% | 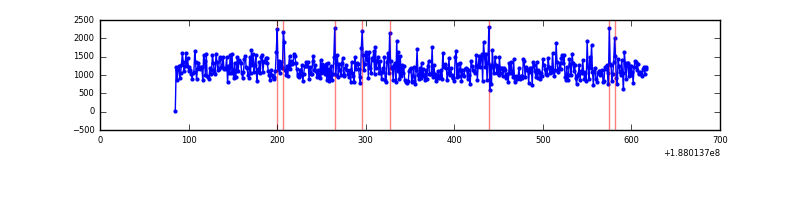 |
| D | 532 | 531 | 526 | 526 | 98.87% | 99.06% | 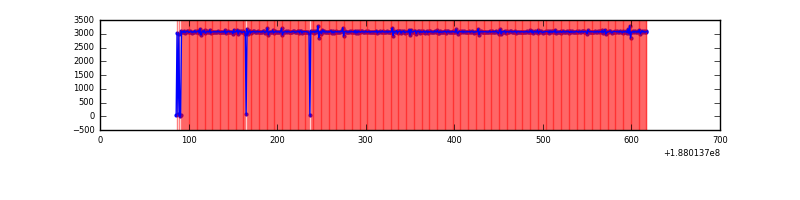 |
Top three noisy pixels from each quadrant. If the there are fewer than three noisy pixels in the level2.evt file, extra rows are filled as -1
| Pixel properties | Quadrant properties | ||||||
|---|---|---|---|---|---|---|---|
| Quadrant | DetID | PixID | Counts | Sigma | Mean | Median | Sigma |
| A | 15 | 233 | 992 | 21.62 | 154 | 154 | 38.7 |
| A | 4 | 32 | 675 | 13.44 | 154 | 154 | 38.7 |
| A | 11 | 79 | 605 | 11.63 | 154 | 154 | 38.7 |
| B | 8 | 219 | 10843 | 259.74 | 167 | 166 | 41.1 |
| B | 6 | 53 | 567 | 9.76 | 167 | 166 | 41.1 |
| B | 7 | 111 | 481 | 7.66 | 167 | 166 | 41.1 |
| C | 15 | 241 | 31346 | 708.8 | 151 | 157 | 44.0 |
| C | 12 | 4 | 2106 | 44.29 | 151 | 157 | 44.0 |
| C | 3 | 111 | 1491 | 30.32 | 151 | 157 | 44.0 |
| D | 1 | 239 | 1294955 | 48420.96 | 83 | 84 | 26.7 |
| D | 10 | 125 | 5309 | 195.39 | 83 | 84 | 26.7 |
| D | 13 | 205 | 3503 | 127.85 | 83 | 84 | 26.7 |
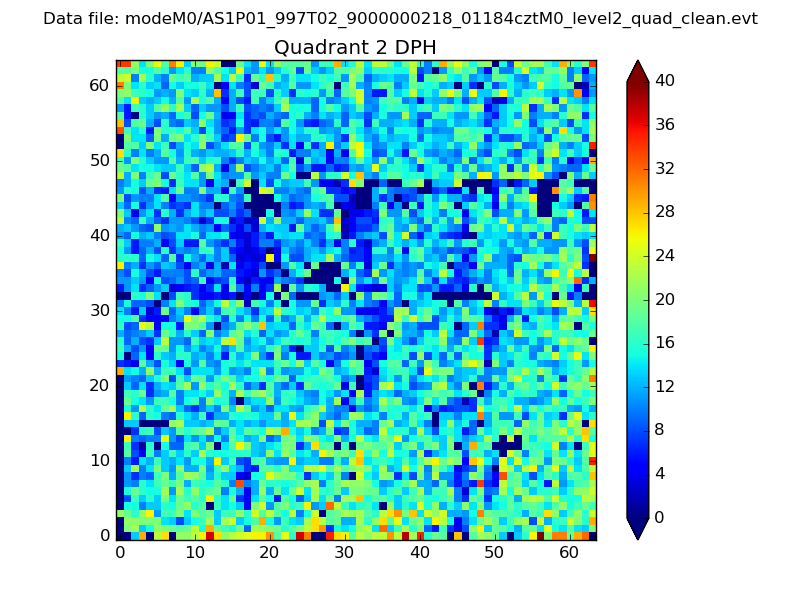
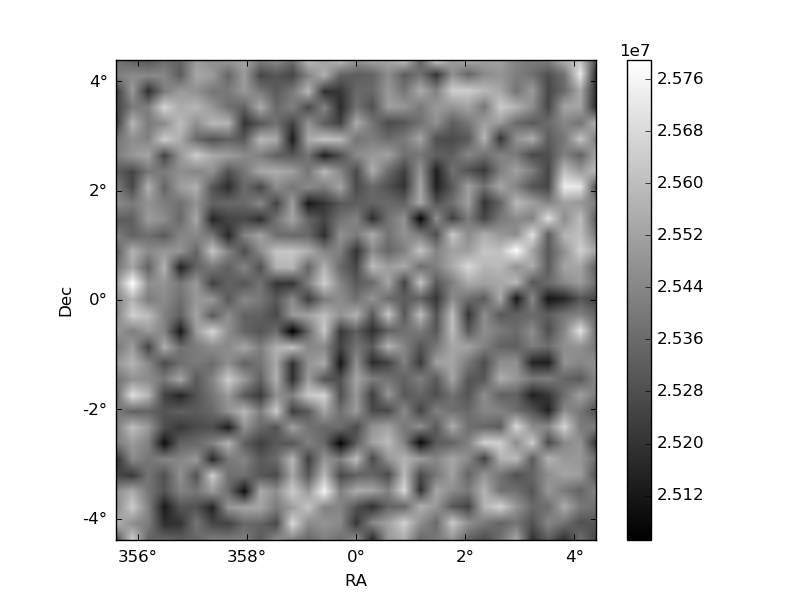
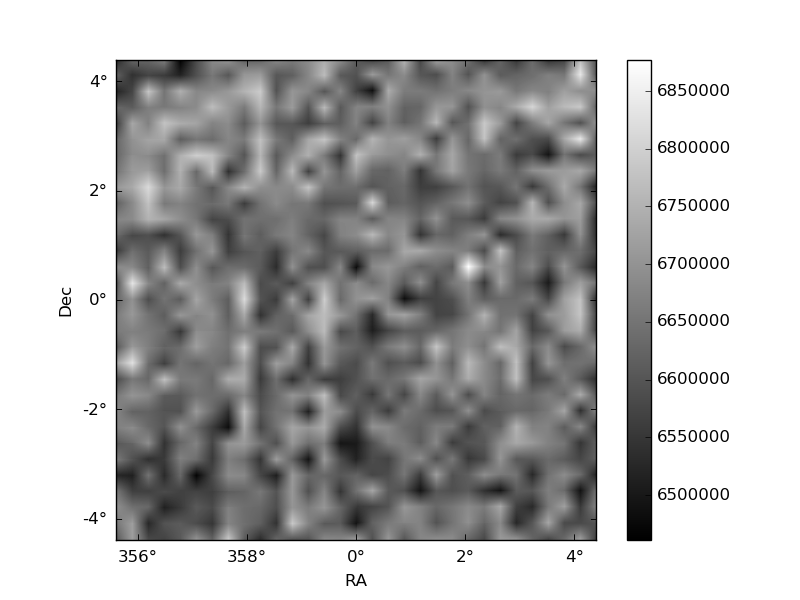
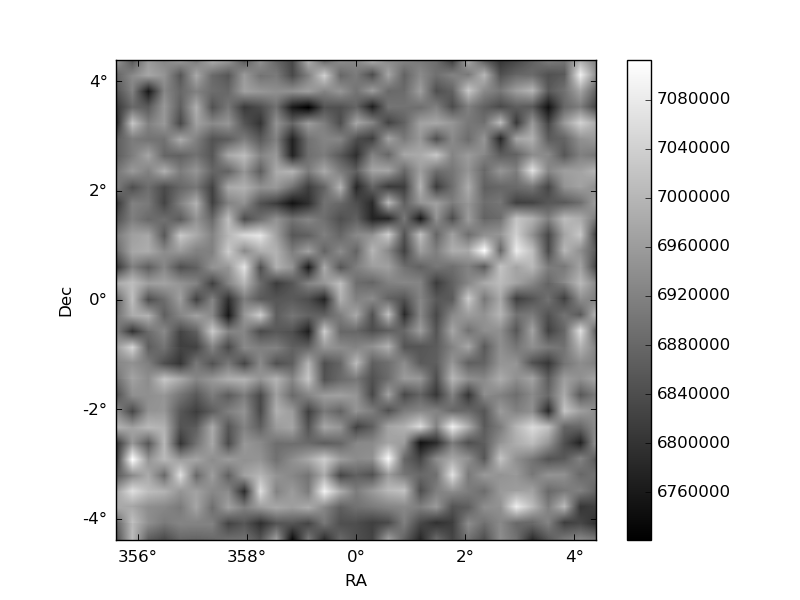
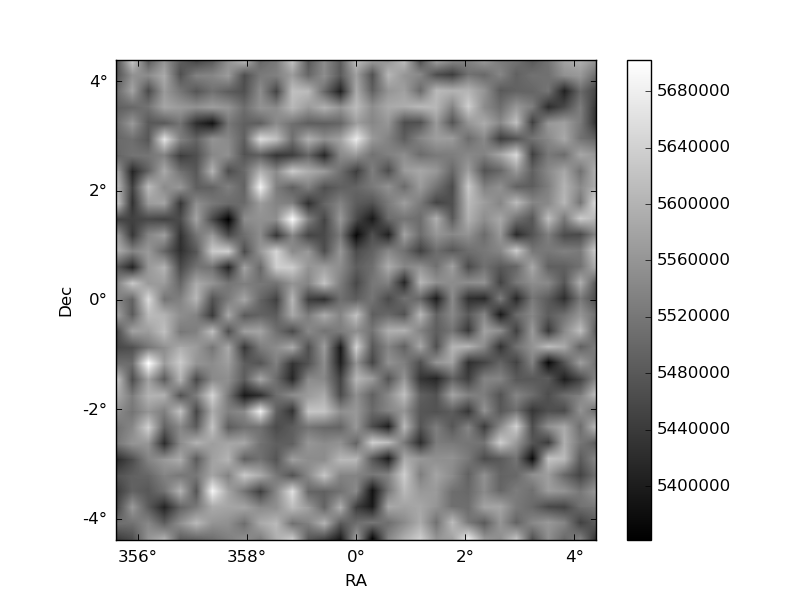
Histogram calculated using DETX and DETY for each event in the final _common_clean file
| Quadrant A | 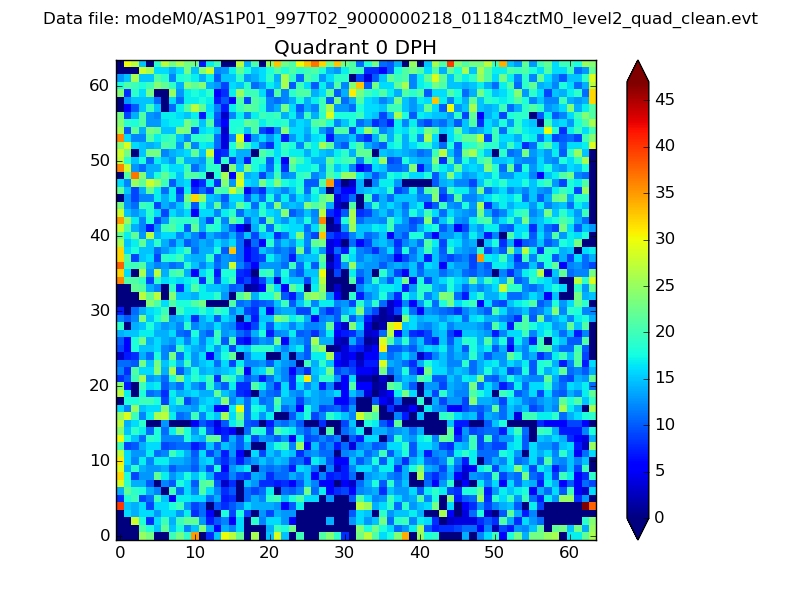 |
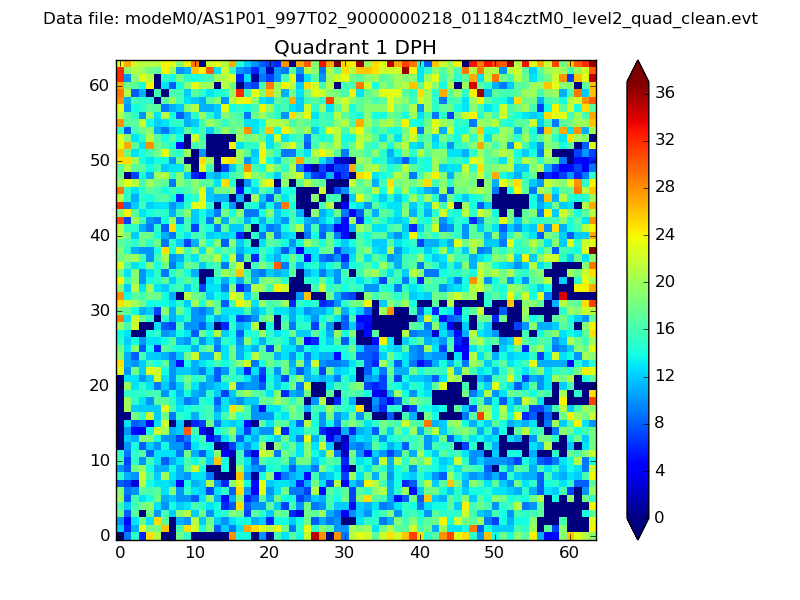 |
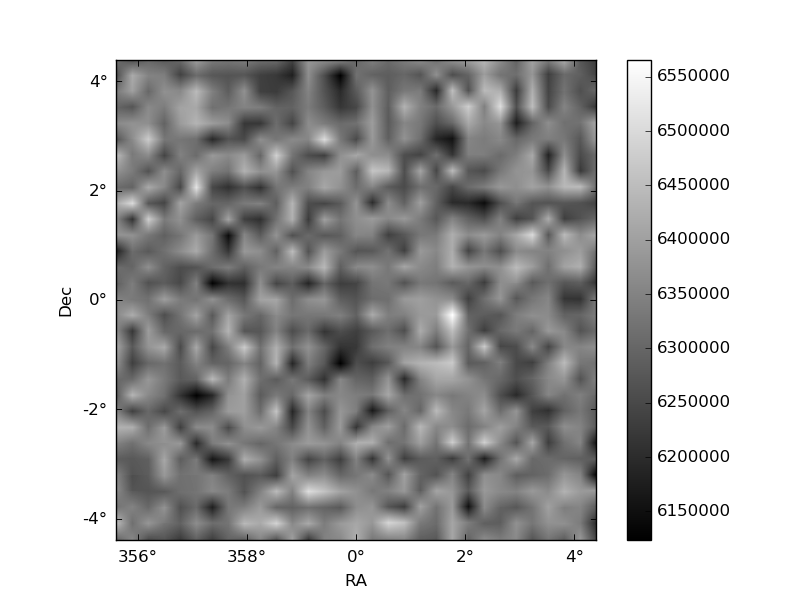
Quadrant B |
|---|---|---|---|
| Quadrant D | 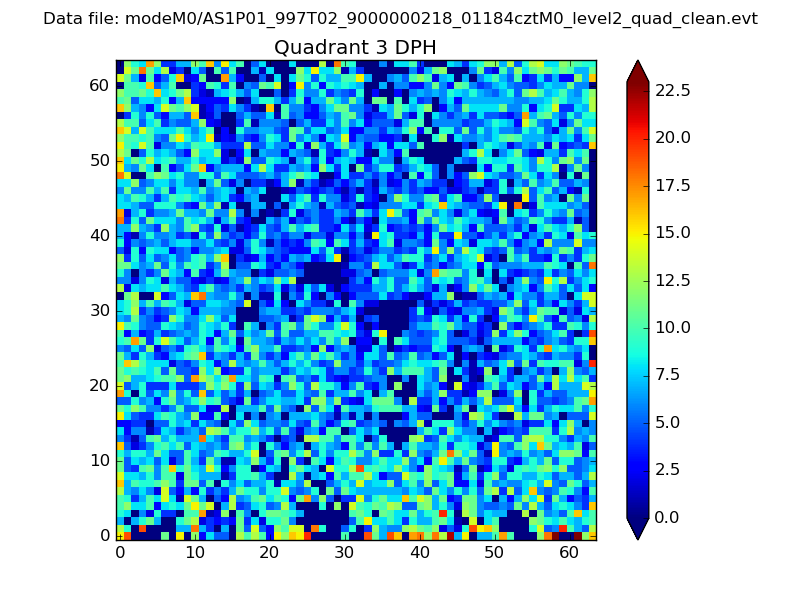 |
 |
Quadrant C |
| Plot type | Count rate plots | Images |
|---|---|---|
| Comparison with Poisson distribution Blue bars denote a histogram of data divided into 1 sec bins. Red curve is a Poisson curve with rate = median count rate of data. |
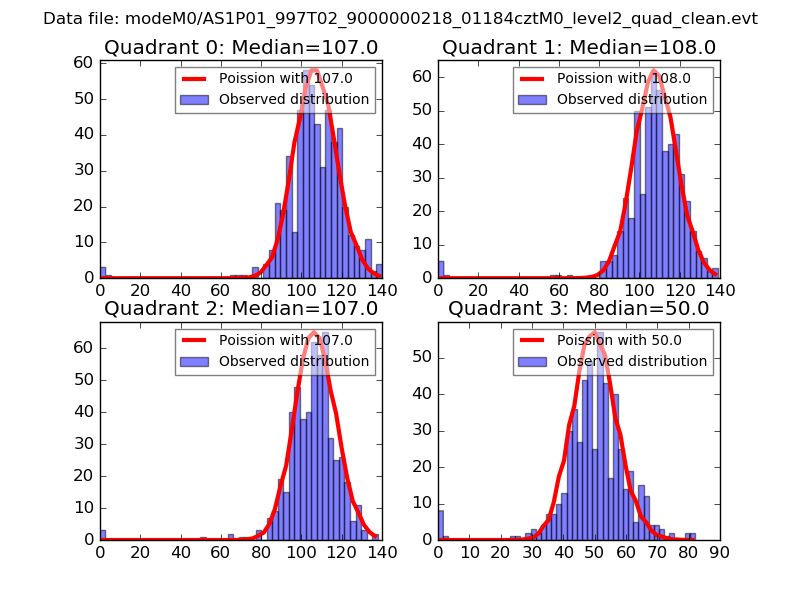 |
 |
| Quadrant-wise count rates Data is divided into 100 sec bins |
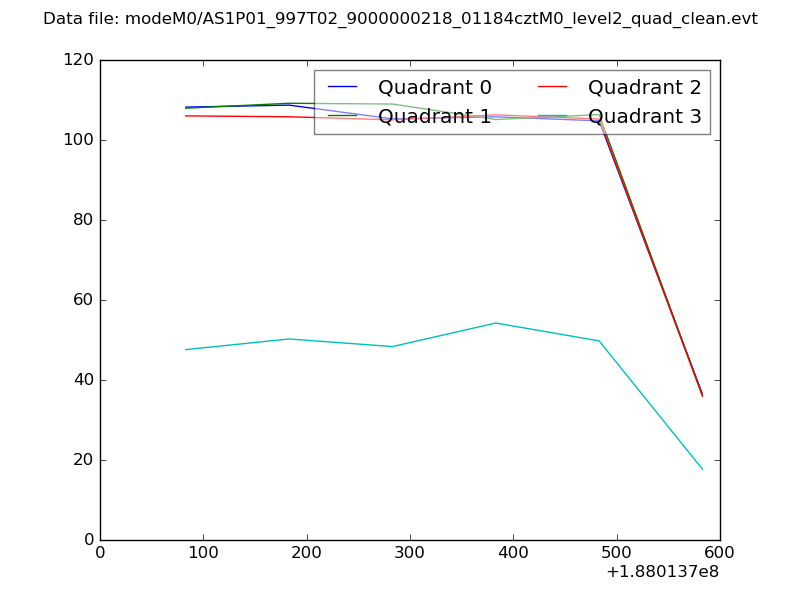 |
|
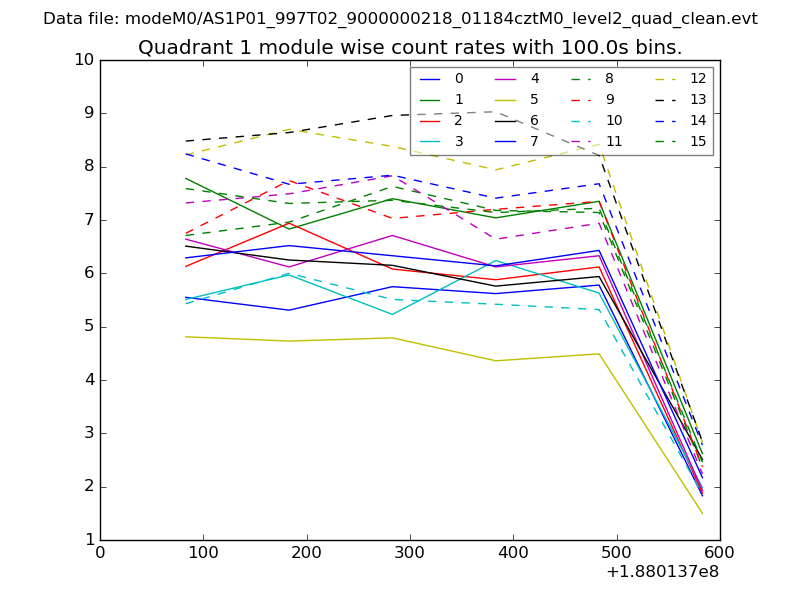
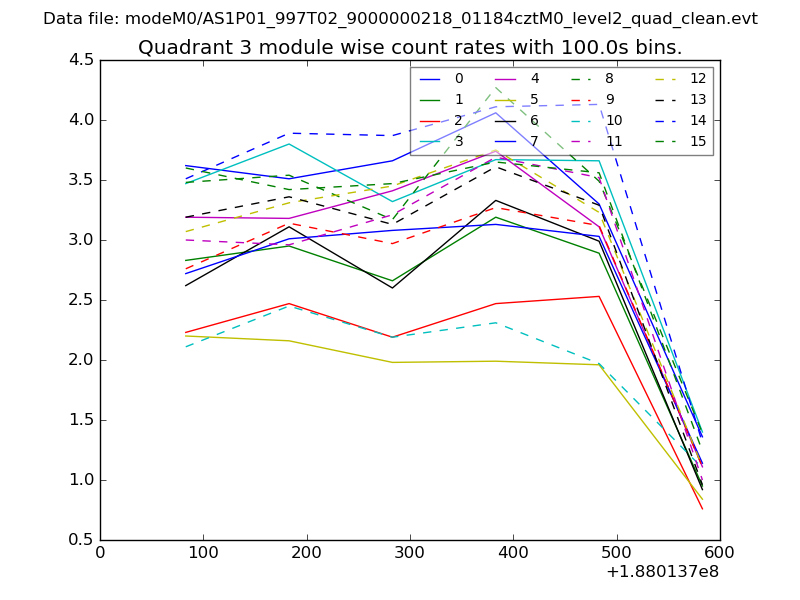
| Module-wise count rates for Quadrant A Data is divided into 100 sec bins |
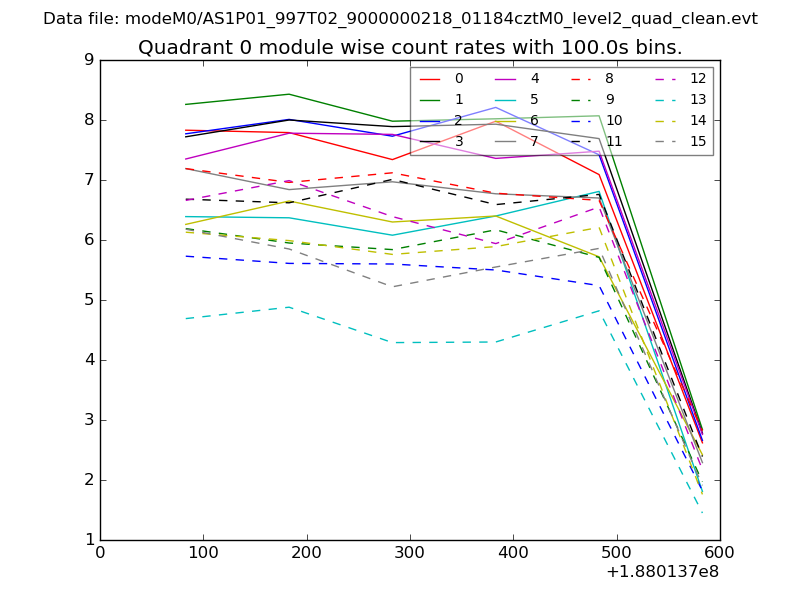 |
 |
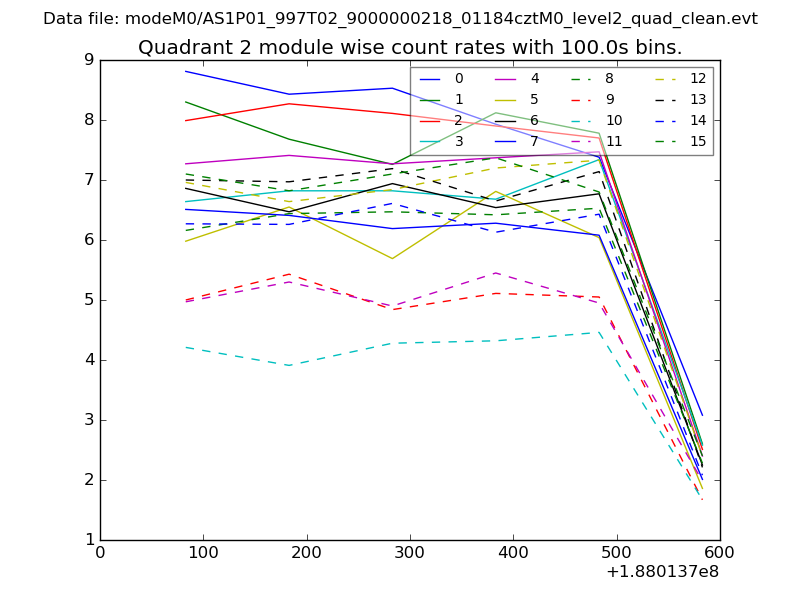
| Module-wise count rates for Quadrant B Data is divided into 100 sec bins |
 |
 |
| Module-wise count rates for Quadrant C Data is divided into 100 sec bins |
 |
 |
| Module-wise count rates for Quadrant D Data is divided into 100 sec bins |
 |
 |
| Parameter | Plot |
|---|---|
| CZT HV Monitor | 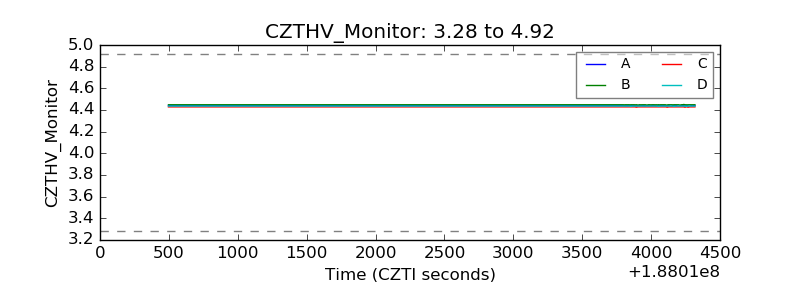 |
| D_VDD | 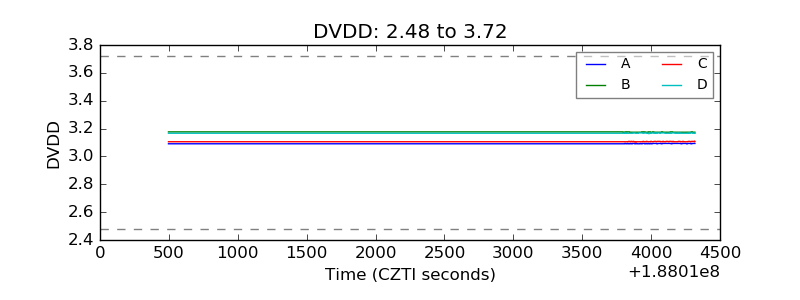 |
| Temperature 1 | 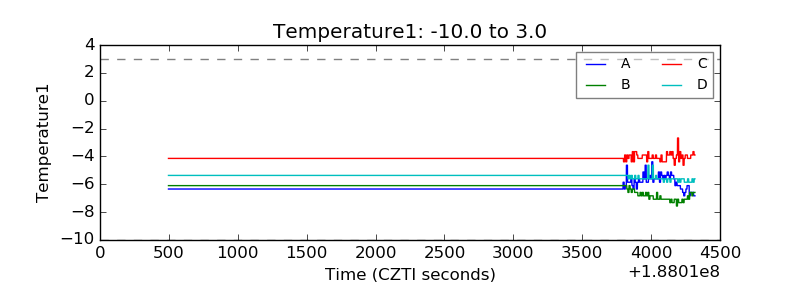 |
| Veto HV Monitor | 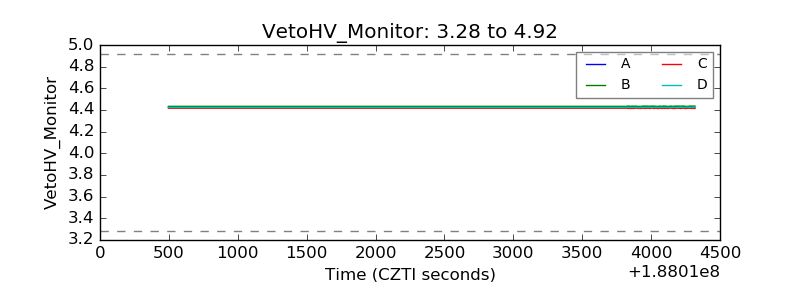 |
| Veto LLD | 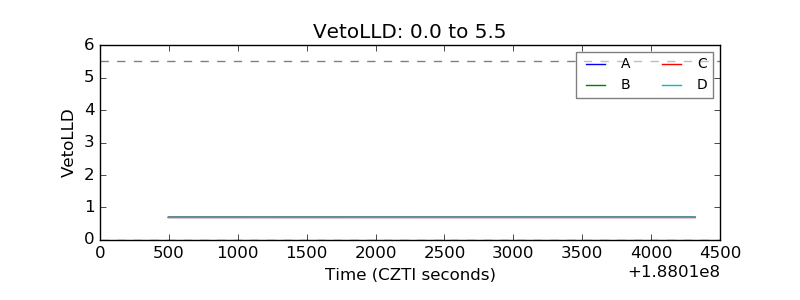 |
| Alpha Counter | 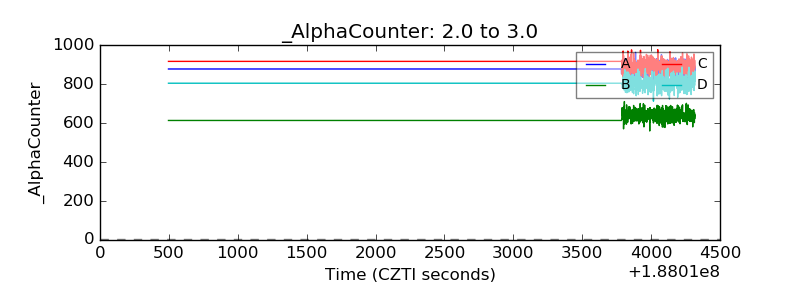 |
| _CPM_Rate | 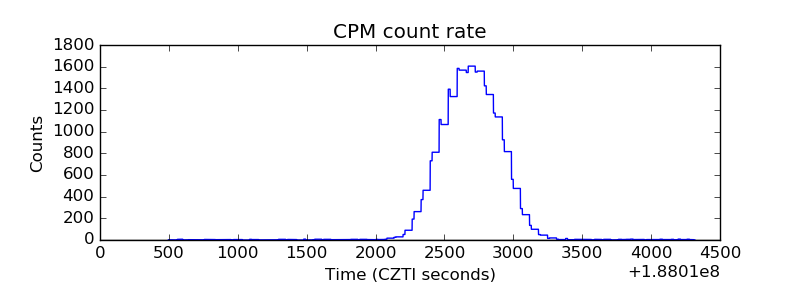 |
| CZT Counter | 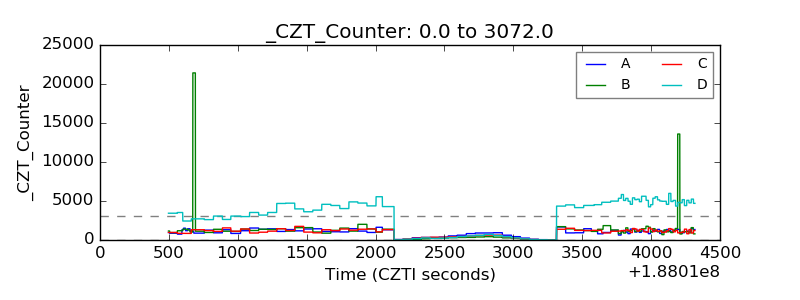 |
| +2.5 Volts monitor | 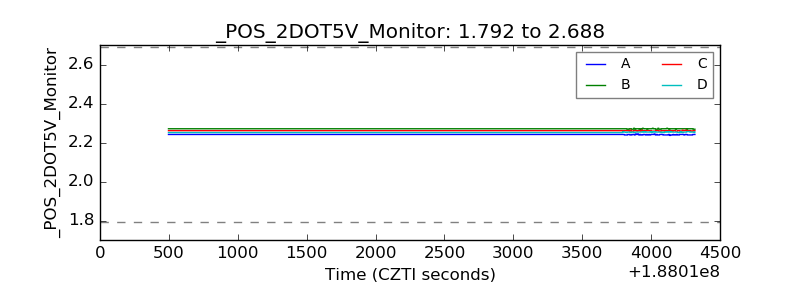 |
| +5 Volts monitor |  |
| _ROLL_ROT | 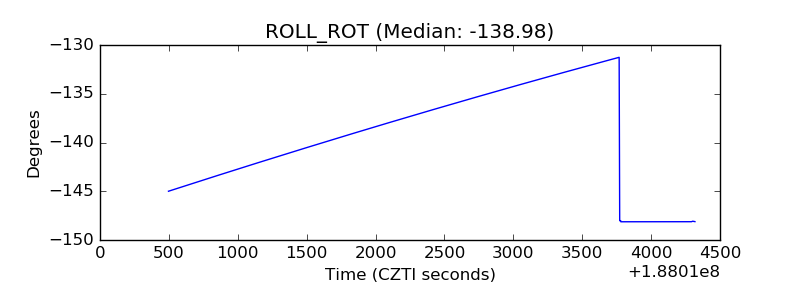 |
| _Roll_DEC | 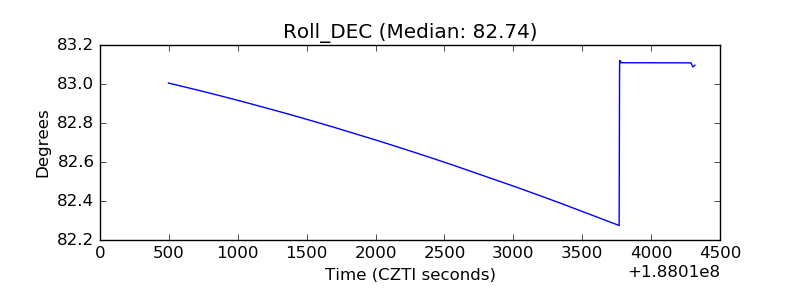 |
| _Roll_RA | 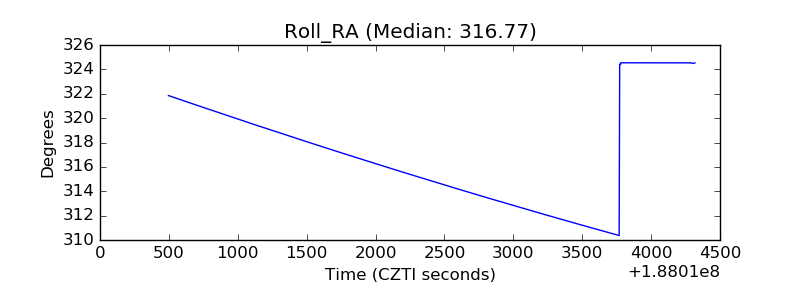 |
| Veto Counter | 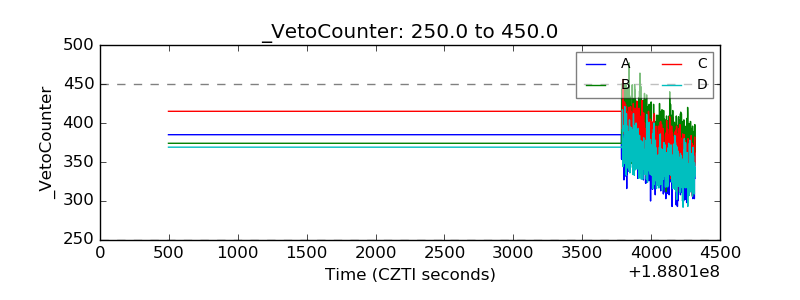 |