| Param | Original file | Final file |
|---|---|---|
| Filename | modeM0/AS1G04_007T02_9000000220cztM0_level2.fits | modeM0/AS1G04_007T02_9000000220cztM0_level2_quad_clean.evt |
| Size (bytes) | 1,537,156,800 | 2,378,410,560 |
| Size | 1.4 GB | 2.2 GB |
| Events in quadrant A | 9,015,090 | 16,036,749 |
| Events in quadrant B | 8,841,084 | 15,833,785 |
| Events in quadrant C | 8,741,744 | 14,955,520 |
| Events in quadrant D | 6,924,428 | 12,205,961 |
| Mode M9 | |||
|---|---|---|---|
| Quadrant | BADHDUFLAG | Total packets | Discarded packets |
| A | 0 | 224 | 0 |
| B | 0 | 224 | 0 |
| C | 0 | 224 | 0 |
| D | 0 | 225 | 0 |
| Mode M0 | |||
|---|---|---|---|
| Quadrant | BADHDUFLAG | Total packets | Discarded packets |
| A | 0 | 814307 | 0 |
| B | 0 | 855590 | 0 |
| C | 0 | 806331 | 0 |
| D | 0 | 987160 | 0 |
| Mode SS | |||
|---|---|---|---|
| Quadrant | BADHDUFLAG | Total packets | Discarded packets |
| A | 0 | 3908 | 0 |
| B | 0 | 3908 | 0 |
| C | 0 | 3908 | 0 |
| D | 0 | 3908 | 0 |
| Quadrant | Total seconds | Saturated seconds | Saturation percentage |
|---|---|---|---|
| A | 189767 | 968 | 0.510099% |
| B | 189767 | 2220 | 1.169856% |
| C | 189767 | 471 | 0.248199% |
| D | 189766 | 29528 | 15.560216% |
Noise dominated data is calculated using 1-second bins in cleaned event files. If a bin has >2000 counts, and if more than 50% of those come from <1% of pixels, then it is considered to be noise-dominated and hence unusable.
| Quadrant | # 1 sec bins | Bins with >0 counts | Bins with >2000 counts | High rate bins dominated by noise | Noise dominated (total time) | Noise dominated (detector-on time) | Marked lightcurve |
|---|---|---|---|---|---|---|---|
| A | 225607 | 190684 | 0 | 0 | 0.00% | 0.00% |  |
| B | 225605 | 190594 | 0 | 0 | 0.00% | 0.00% |  |
| C | 225605 | 190611 | 0 | 0 | 0.00% | 0.00% |  |
| D | 225607 | 189689 | 0 | 0 | 0.00% | 0.00% |  |
Top three noisy pixels from each quadrant. If the there are fewer than three noisy pixels in the level2.evt file, extra rows are filled as -1
| Pixel properties | Quadrant properties | ||||||
|---|---|---|---|---|---|---|---|
| Quadrant | DetID | PixID | Counts | Sigma | Mean | Median | Sigma |
| A | 0 | 29 | 8266 | 11.29 | 2336 | 2182 | 538.9 |
| A | 7 | 110 | 8210 | 11.19 | 2336 | 2182 | 538.9 |
| A | 14 | 188 | 6789 | 8.55 | 2336 | 2182 | 538.9 |
| B | 2 | 9 | 7133 | 11.6 | 2345 | 2234 | 422.4 |
| B | 5 | 128 | 6065 | 9.07 | 2345 | 2234 | 422.4 |
| B | 14 | 254 | 5992 | 8.9 | 2345 | 2234 | 422.4 |
| C | 12 | 241 | 6100 | 7.1 | 2307 | 2133 | 558.6 |
| C | 9 | 242 | 5823 | 6.6 | 2307 | 2133 | 558.6 |
| C | 2 | 191 | 5692 | 6.37 | 2307 | 2133 | 558.6 |
| D | 11 | 82 | 5011 | 6.88 | 1976 | 1813 | 464.6 |
| D | 3 | 30 | 4954 | 6.76 | 1976 | 1813 | 464.6 |
| D | 6 | 44 | 4916 | 6.68 | 1976 | 1813 | 464.6 |
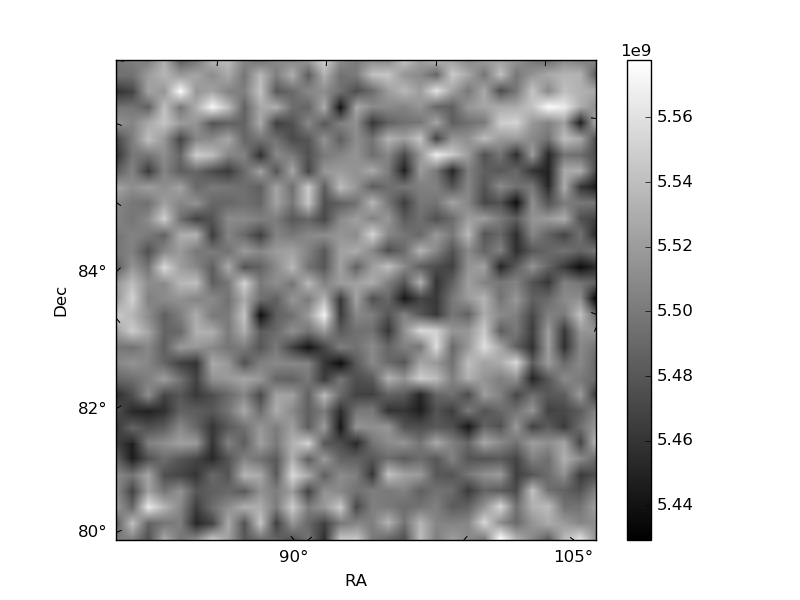
Histogram calculated using DETX and DETY for each event in the final _common_clean file
| Quadrant A |  |
 |
Quadrant B |
|---|---|---|---|
| Quadrant D |  |
 |
Quadrant C |
| Plot type | Count rate plots | Images |
|---|---|---|
| Comparison with Poisson distribution Blue bars denote a histogram of data divided into 1 sec bins. Red curve is a Poisson curve with rate = median count rate of data. |
 |
 |
| Quadrant-wise count rates Data is divided into 100 sec bins |
 |
|
| Module-wise count rates for Quadrant A Data is divided into 100 sec bins |
 |
 |
| Module-wise count rates for Quadrant B Data is divided into 100 sec bins |
 |
 |
| Module-wise count rates for Quadrant C Data is divided into 100 sec bins |
 |
 |
| Module-wise count rates for Quadrant D Data is divided into 100 sec bins |
 |
 |
| Parameter | Plot |
|---|---|
| CZT HV Monitor |  |
| D_VDD |  |
| Temperature 1 |  |
| Veto HV Monitor |  |
| Veto LLD |  |
| Alpha Counter |  |
| _CPM_Rate |  |
| CZT Counter |  |
| +2.5 Volts monitor |  |
| +5 Volts monitor |  |
| _ROLL_ROT | 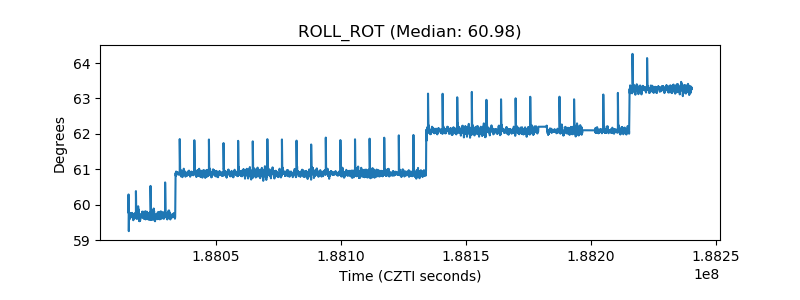 |
| _Roll_DEC | 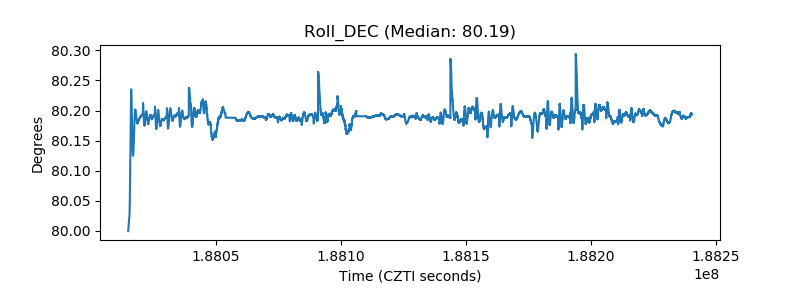 |
| _Roll_RA | 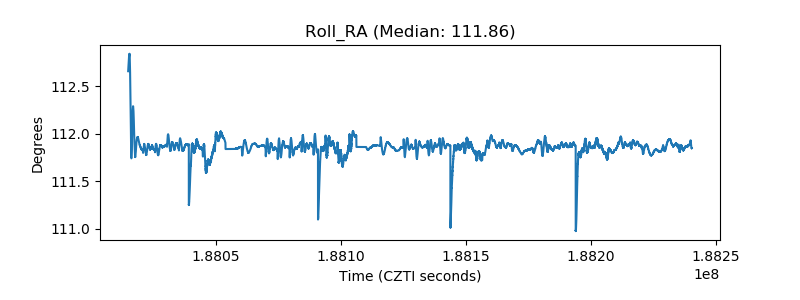 |
| Veto Counter |  |