| Param | Original file | Final file |
|---|---|---|
| Filename | modeM0/AS1G04_007T02_9000000220_01185cztM0_level2.evt | modeM0/AS1G04_007T02_9000000220_01185cztM0_level2_quad_clean.evt |
| Size (bytes) | 1,128,608,640 | 70,188,480 |
| Size | 1.1 GB | 66.9 MB |
| Events in quadrant A | 6,055,655 | 526,452 |
| Events in quadrant B | 6,488,167 | 529,601 |
| Events in quadrant C | 5,838,333 | 505,580 |
| Events in quadrant D | 15,464,448 | 208,494 |
| Mode M9 | |||
|---|---|---|---|
| Quadrant | BADHDUFLAG | Total packets | Discarded packets |
| A | 0 | 12 | 0 |
| B | 0 | 12 | 0 |
| C | 0 | 12 | 0 |
| D | 0 | 12 | 0 |
| Mode M0 | |||
|---|---|---|---|
| Quadrant | BADHDUFLAG | Total packets | Discarded packets |
| A | 0 | 21575 | 2 |
| B | 0 | 22820 | 1 |
| C | 0 | 20923 | 1 |
| D | 0 | 50341 | 1 |
| Mode SS | |||
|---|---|---|---|
| Quadrant | BADHDUFLAG | Total packets | Discarded packets |
| A | 0 | 102 | 0 |
| B | 0 | 102 | 0 |
| C | 0 | 102 | 0 |
| D | 0 | 102 | 0 |
| Quadrant | Total seconds | Saturated seconds | Saturation percentage |
|---|---|---|---|
| A | 5034 | 5 | 0.099325% |
| B | 5034 | 21 | 0.417163% |
| C | 5034 | 11 | 0.218514% |
| D | 5034 | 5034 | 100.000000% |
Noise dominated data is calculated using 1-second bins in cleaned event files. If a bin has >2000 counts, and if more than 50% of those come from <1% of pixels, then it is considered to be noise-dominated and hence unusable.
| Quadrant | # 1 sec bins | Bins with >0 counts | Bins with >2000 counts | High rate bins dominated by noise | Noise dominated (total time) | Noise dominated (detector-on time) | Marked lightcurve |
|---|---|---|---|---|---|---|---|
| A | 6259 | 5035 | 126 | 126 | 2.01% | 2.50% | 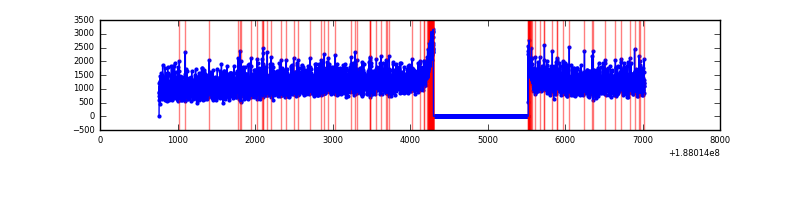 |
| B | 6259 | 5035 | 300 | 300 | 4.79% | 5.96% | 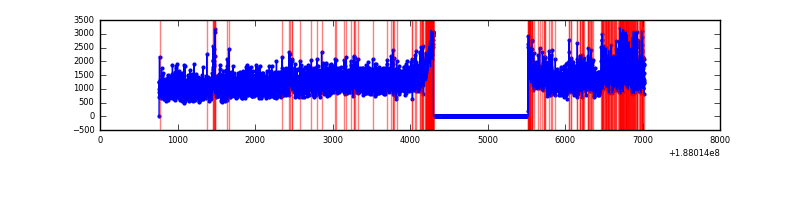 |
| C | 6259 | 5035 | 110 | 110 | 1.76% | 2.18% | 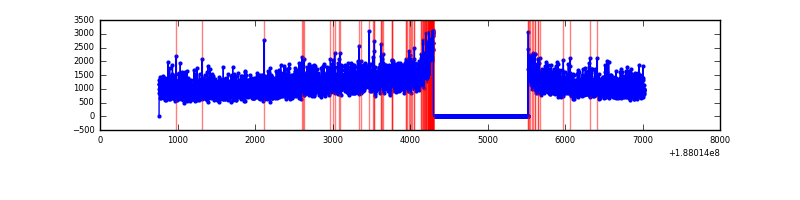 |
| D | 6259 | 5035 | 5033 | 5033 | 80.41% | 99.96% | 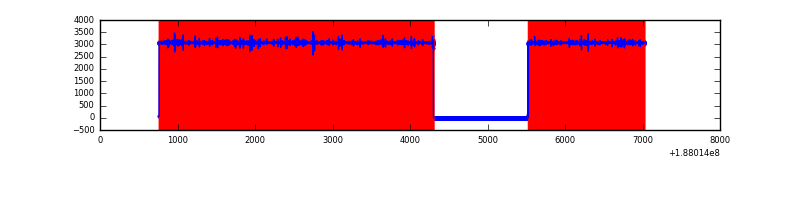 |
Top three noisy pixels from each quadrant. If the there are fewer than three noisy pixels in the level2.evt file, extra rows are filled as -1
| Pixel properties | Quadrant properties | ||||||
|---|---|---|---|---|---|---|---|
| Quadrant | DetID | PixID | Counts | Sigma | Mean | Median | Sigma |
| A | 15 | 127 | 152599 | 411.59 | 1530 | 1545 | 367.0 |
| A | 4 | 32 | 19540 | 49.03 | 1530 | 1545 | 367.0 |
| A | 8 | 14 | 7881 | 17.26 | 1530 | 1545 | 367.0 |
| B | 5 | 191 | 386796 | 1035.55 | 1577 | 1588 | 372.0 |
| B | 15 | 22 | 33859 | 86.75 | 1577 | 1588 | 372.0 |
| B | 5 | 249 | 19868 | 49.14 | 1577 | 1588 | 372.0 |
| C | 15 | 241 | 298784 | 760.12 | 1402 | 1445 | 391.2 |
| C | 9 | 83 | 25548 | 61.62 | 1402 | 1445 | 391.2 |
| C | 3 | 111 | 16636 | 38.83 | 1402 | 1445 | 391.2 |
| D | 1 | 239 | 11608243 | 50264.01 | 753 | 777 | 230.9 |
| D | 10 | 84 | 1012104 | 4379.37 | 753 | 777 | 230.9 |
| D | 10 | 85 | 9521 | 37.86 | 753 | 777 | 230.9 |
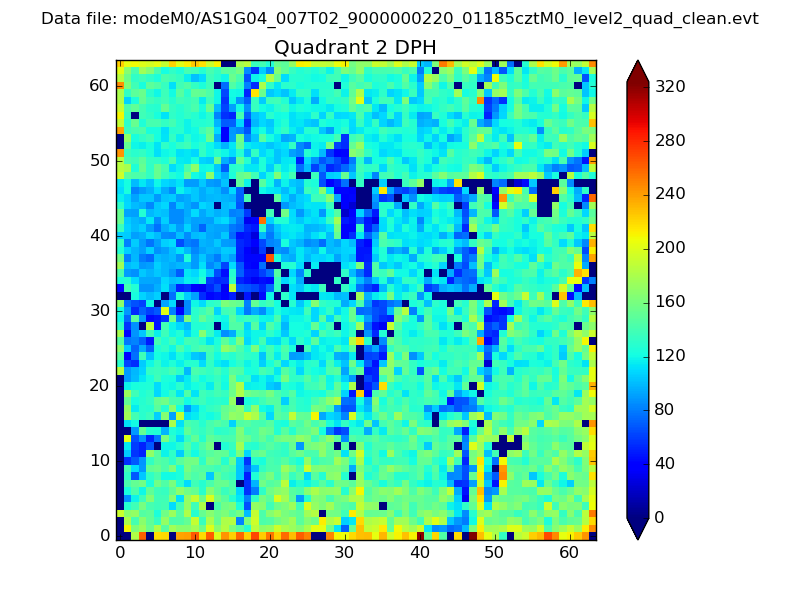
Histogram calculated using DETX and DETY for each event in the final _common_clean file
| Quadrant A | 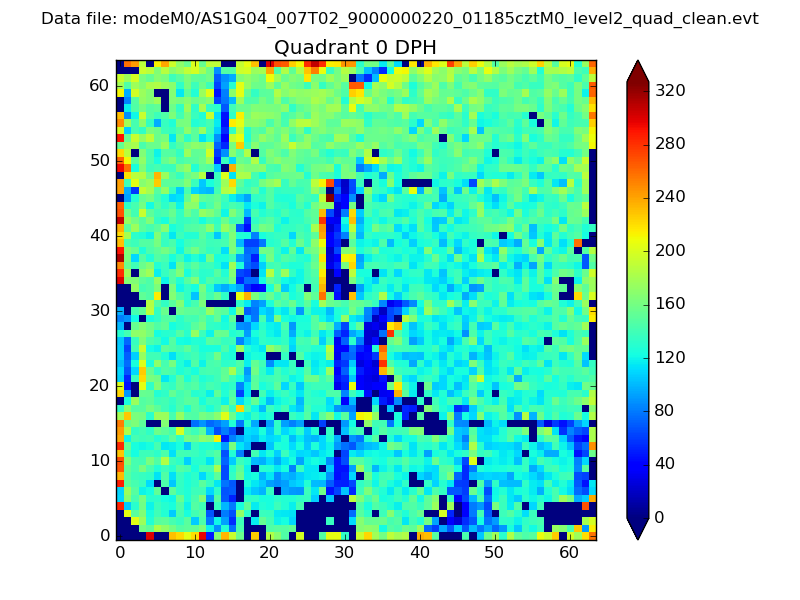 |
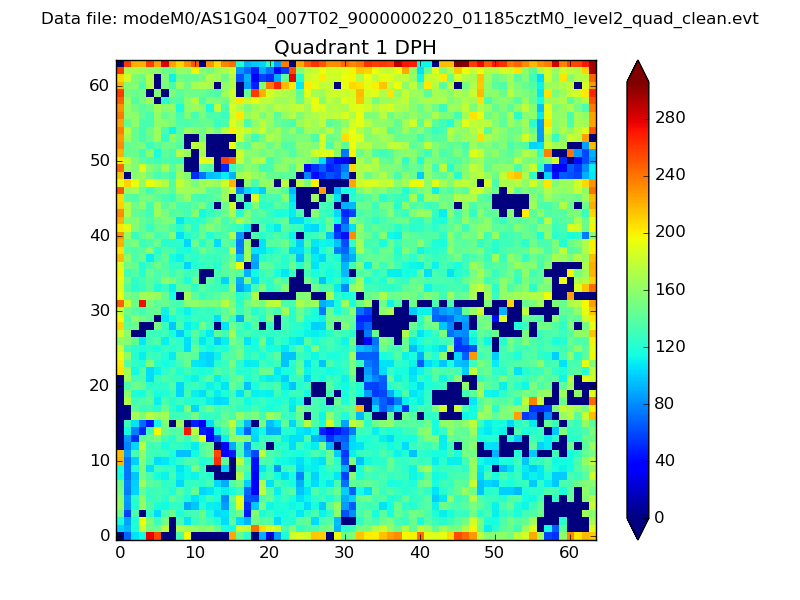 |
Quadrant B |
|---|---|---|---|
| Quadrant D | 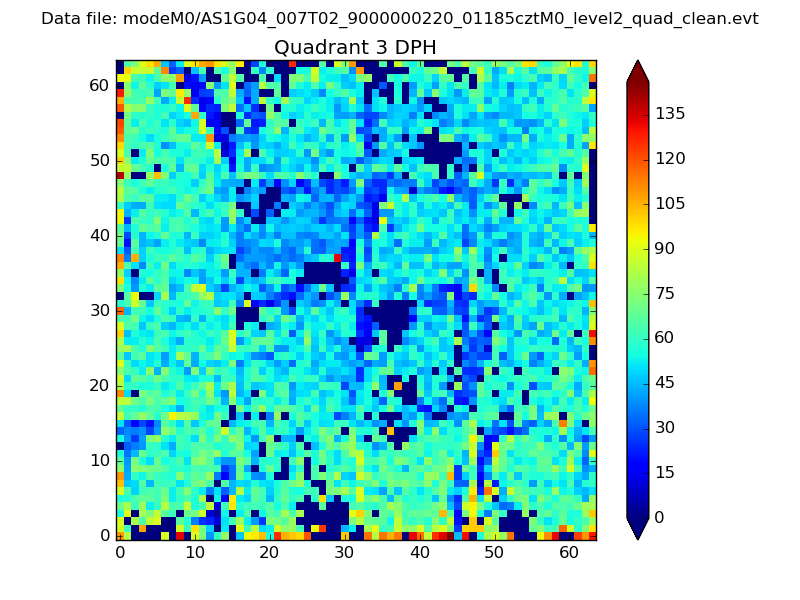 |
 |
Quadrant C |
| Plot type | Count rate plots | Images |
|---|---|---|
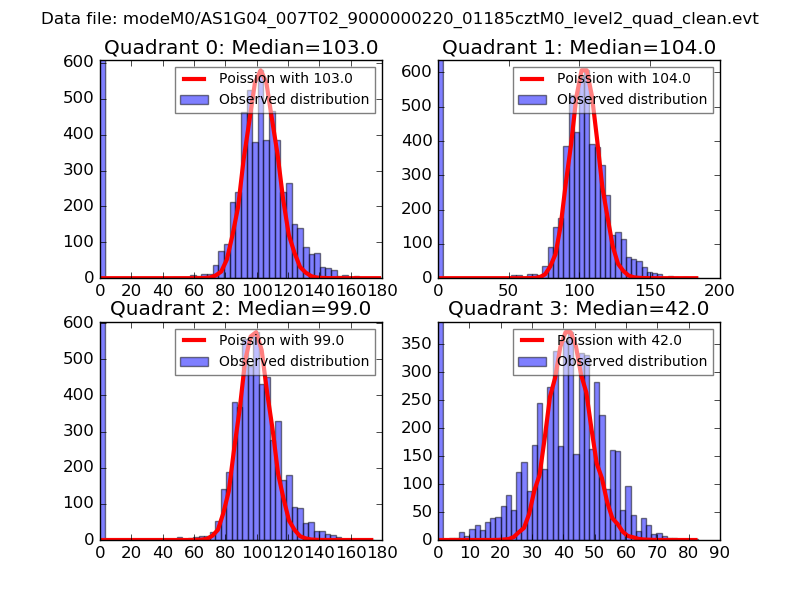
| Comparison with Poisson distribution Blue bars denote a histogram of data divided into 1 sec bins. Red curve is a Poisson curve with rate = median count rate of data. |
 |
 |
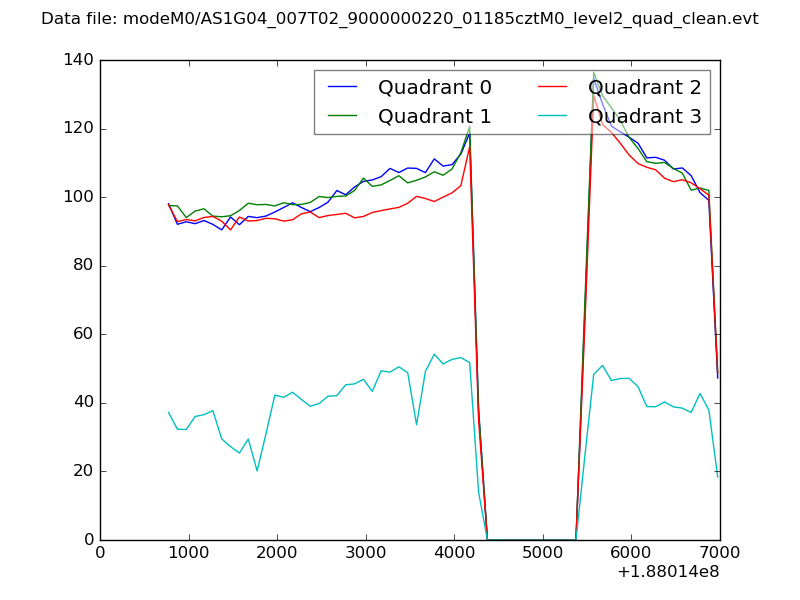
| Quadrant-wise count rates Data is divided into 100 sec bins |
 |
|
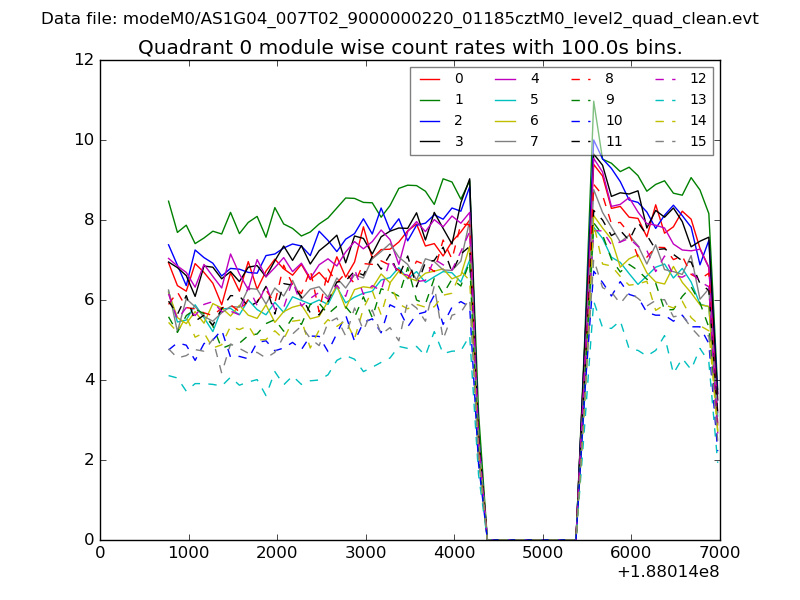
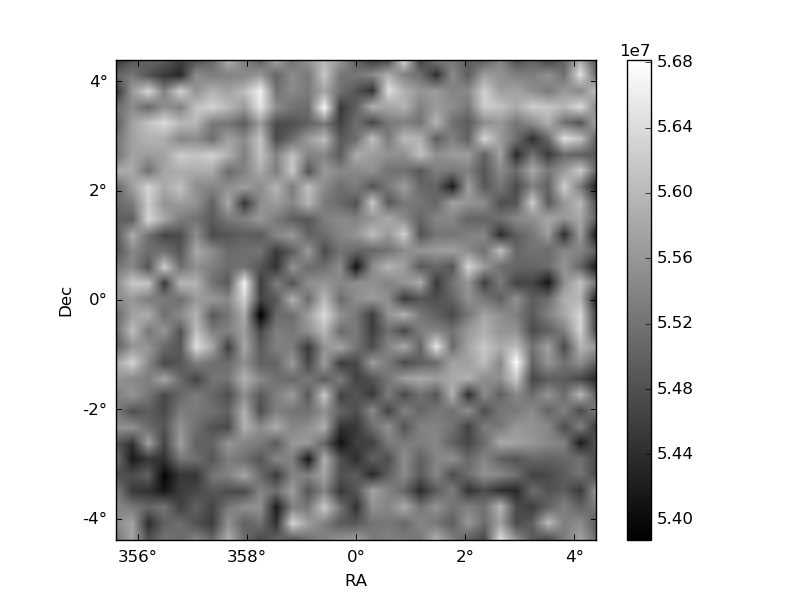
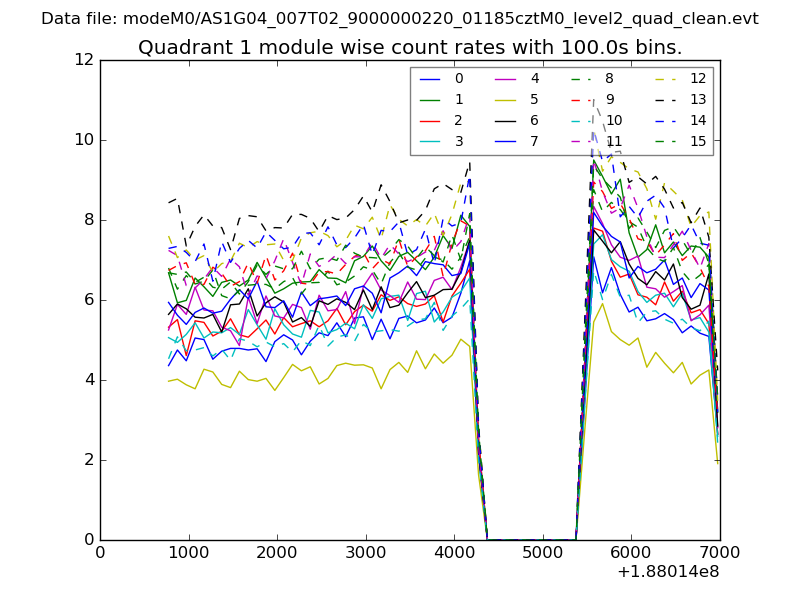
| Module-wise count rates for Quadrant A Data is divided into 100 sec bins |
 |
 |
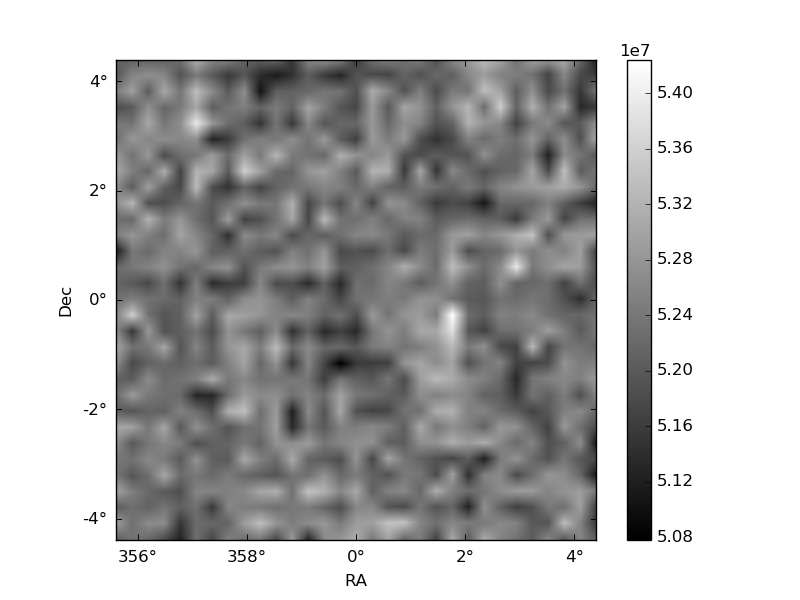
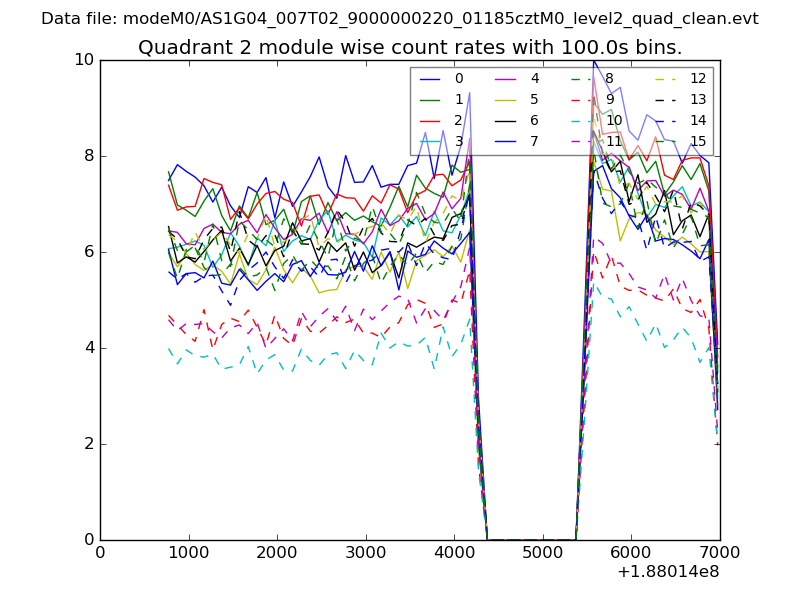
| Module-wise count rates for Quadrant B Data is divided into 100 sec bins |
 |
 |
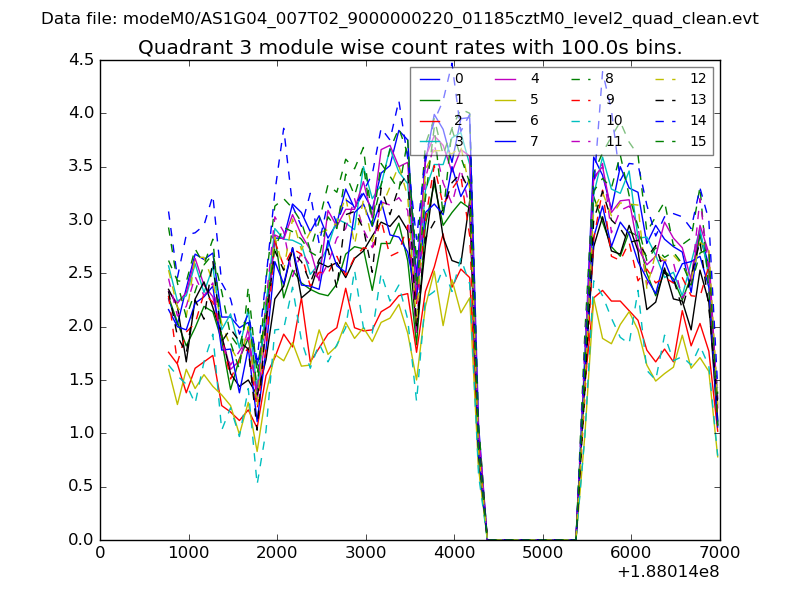
| Module-wise count rates for Quadrant C Data is divided into 100 sec bins |
 |
 |
| Module-wise count rates for Quadrant D Data is divided into 100 sec bins |
 |
 |
| Parameter | Plot |
|---|---|
| CZT HV Monitor | 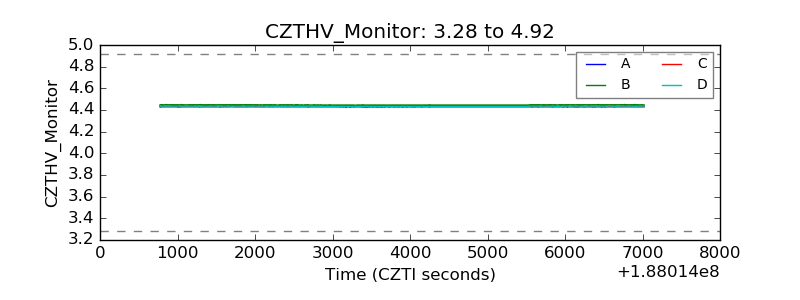 |
| D_VDD | 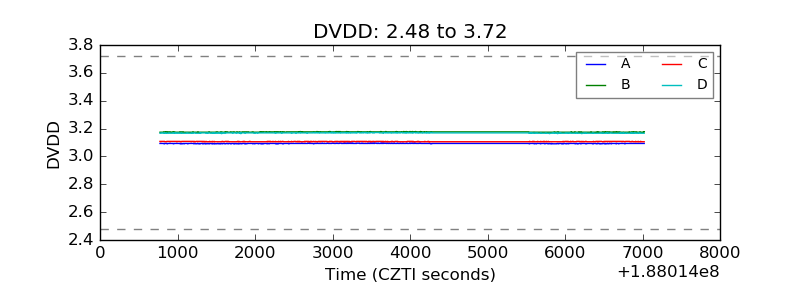 |
| Temperature 1 | 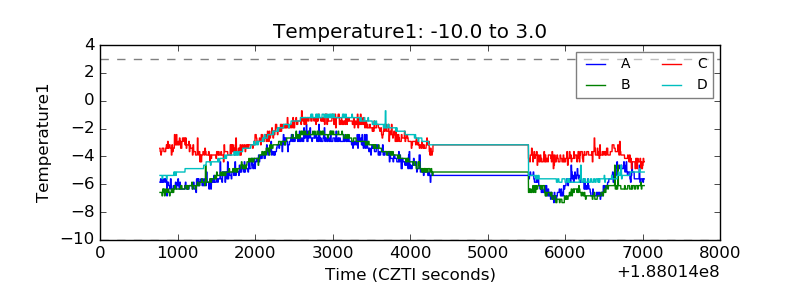 |
| Veto HV Monitor | 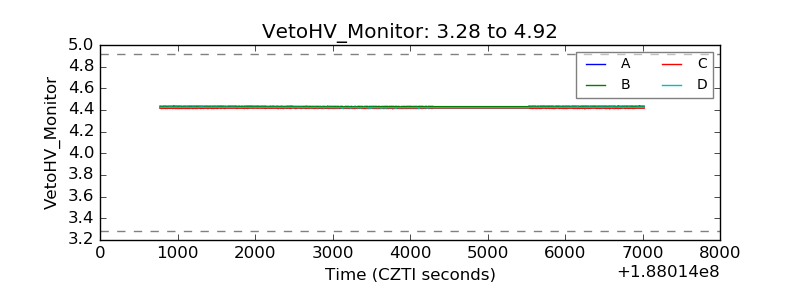 |
| Veto LLD | 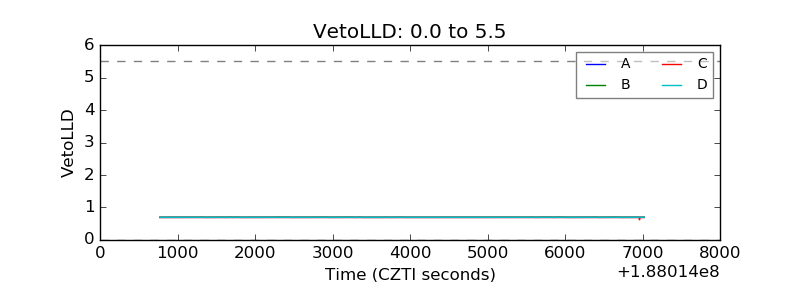 |
| Alpha Counter | 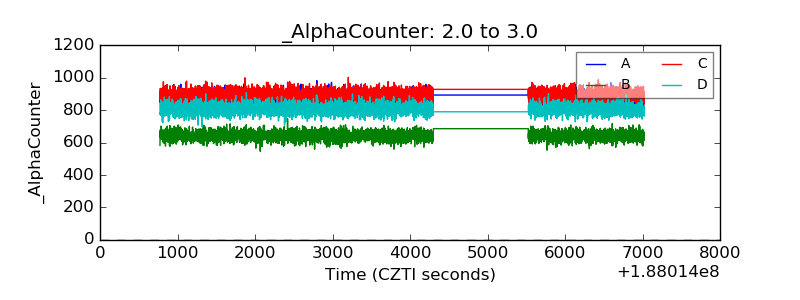 |
| _CPM_Rate | 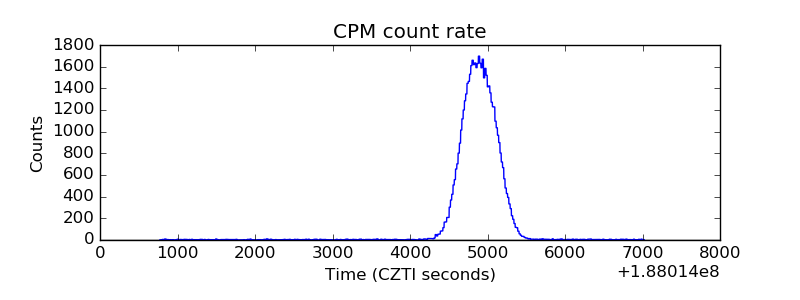 |
| CZT Counter | 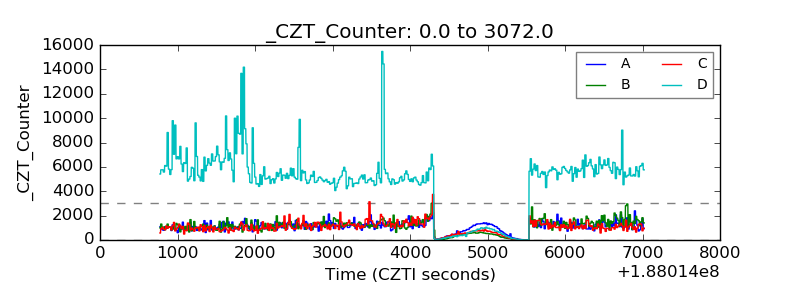 |
| +2.5 Volts monitor |  |
| +5 Volts monitor | 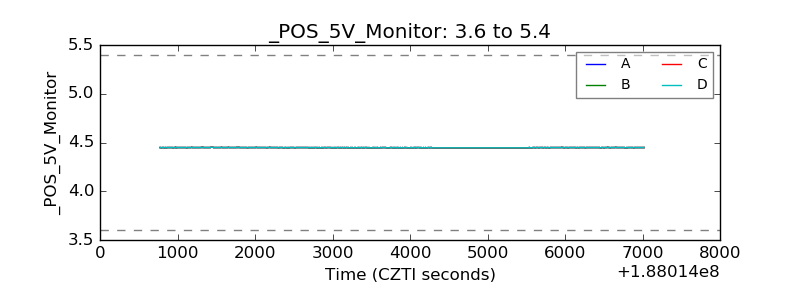 |
| _ROLL_ROT | 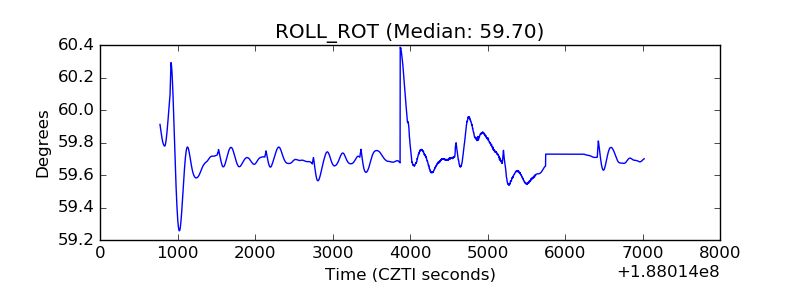 |
| _Roll_DEC | 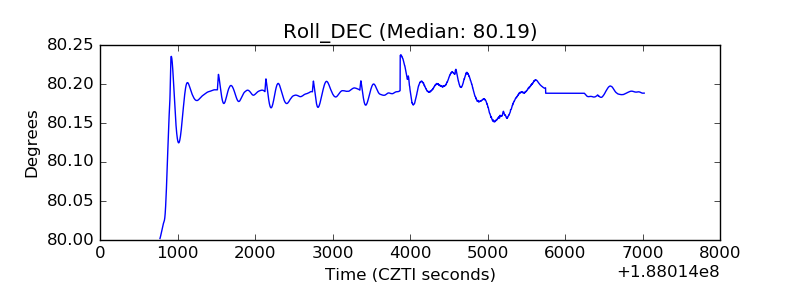 |
| _Roll_RA | 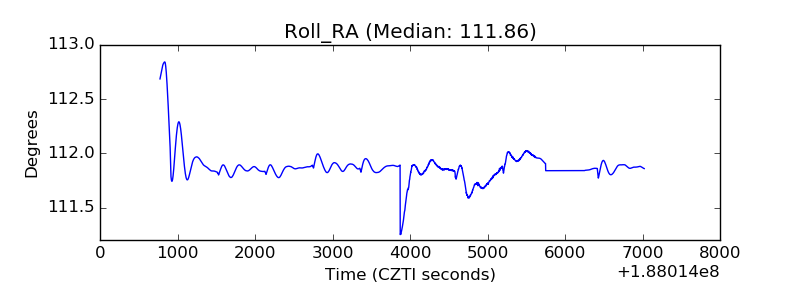 |
| Veto Counter | 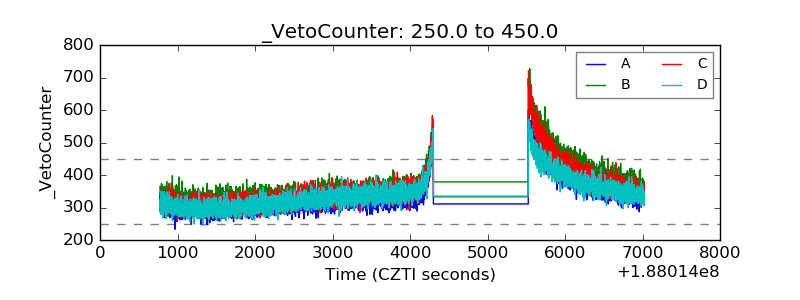 |