| Param | Original file | Final file |
|---|---|---|
| Filename | modeM0/AS1G04_007T02_9000000220_01186cztM0_level2.evt | modeM0/AS1G04_007T02_9000000220_01186cztM0_level2_quad_clean.evt |
| Size (bytes) | 1,278,705,600 | 78,989,760 |
| Size | 1.2 GB | 75.3 MB |
| Events in quadrant A | 7,031,648 | 594,439 |
| Events in quadrant B | 7,735,567 | 596,653 |
| Events in quadrant C | 6,470,410 | 569,090 |
| Events in quadrant D | 17,117,939 | 237,576 |
| Mode M9 | |||
|---|---|---|---|
| Quadrant | BADHDUFLAG | Total packets | Discarded packets |
| A | 0 | 12 | 0 |
| B | 0 | 12 | 0 |
| C | 0 | 12 | 0 |
| D | 0 | 12 | 0 |
| Mode M0 | |||
|---|---|---|---|
| Quadrant | BADHDUFLAG | Total packets | Discarded packets |
| A | 0 | 24850 | 2 |
| B | 0 | 26918 | 1 |
| C | 0 | 23203 | 1 |
| D | 0 | 55733 | 1 |
| Mode SS | |||
|---|---|---|---|
| Quadrant | BADHDUFLAG | Total packets | Discarded packets |
| A | 0 | 116 | 0 |
| B | 0 | 116 | 0 |
| C | 0 | 116 | 0 |
| D | 0 | 116 | 0 |
| Quadrant | Total seconds | Saturated seconds | Saturation percentage |
|---|---|---|---|
| A | 5590 | 6 | 0.107335% |
| B | 5590 | 48 | 0.858676% |
| C | 5590 | 3 | 0.053667% |
| D | 5590 | 5555 | 99.373882% |
Noise dominated data is calculated using 1-second bins in cleaned event files. If a bin has >2000 counts, and if more than 50% of those come from <1% of pixels, then it is considered to be noise-dominated and hence unusable.
| Quadrant | # 1 sec bins | Bins with >0 counts | Bins with >2000 counts | High rate bins dominated by noise | Noise dominated (total time) | Noise dominated (detector-on time) | Marked lightcurve |
|---|---|---|---|---|---|---|---|
| A | 6870 | 5591 | 224 | 224 | 3.26% | 4.01% |  |
| B | 6870 | 5591 | 560 | 560 | 8.15% | 10.02% | 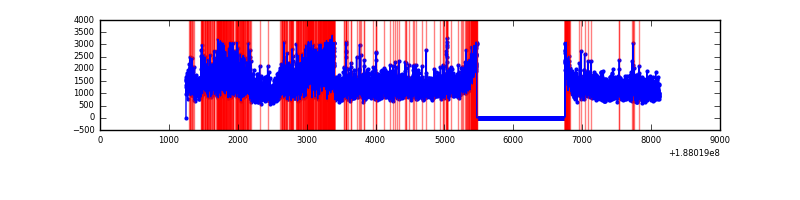 |
| C | 6870 | 5591 | 125 | 125 | 1.82% | 2.24% | 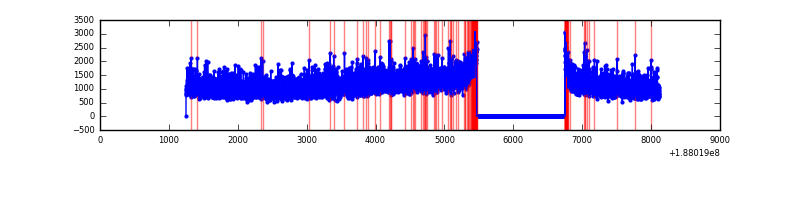 |
| D | 6870 | 5591 | 5557 | 5557 | 80.89% | 99.39% | 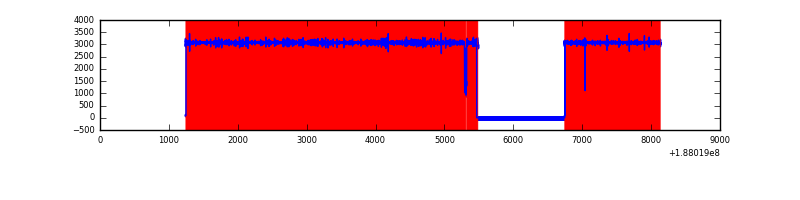 |
Top three noisy pixels from each quadrant. If the there are fewer than three noisy pixels in the level2.evt file, extra rows are filled as -1
| Pixel properties | Quadrant properties | ||||||
|---|---|---|---|---|---|---|---|
| Quadrant | DetID | PixID | Counts | Sigma | Mean | Median | Sigma |
| A | 15 | 127 | 448830 | 1104.12 | 1704 | 1718 | 404.9 |
| A | 8 | 14 | 33328 | 78.06 | 1704 | 1718 | 404.9 |
| A | 11 | 79 | 7704 | 14.78 | 1704 | 1718 | 404.9 |
| B | 5 | 191 | 885777 | 2142.55 | 1756 | 1766 | 412.6 |
| B | 6 | 53 | 94386 | 224.48 | 1756 | 1766 | 412.6 |
| B | 4 | 187 | 24713 | 55.62 | 1756 | 1766 | 412.6 |
| C | 15 | 241 | 332524 | 767.76 | 1555 | 1601 | 431.0 |
| C | 3 | 111 | 19232 | 40.9 | 1555 | 1601 | 431.0 |
| C | 9 | 83 | 18634 | 39.52 | 1555 | 1601 | 431.0 |
| D | 1 | 239 | 13360663 | 51742.77 | 842 | 869 | 258.2 |
| D | 10 | 84 | 557939 | 2157.54 | 842 | 869 | 258.2 |
| D | 10 | 125 | 25029 | 93.57 | 842 | 869 | 258.2 |
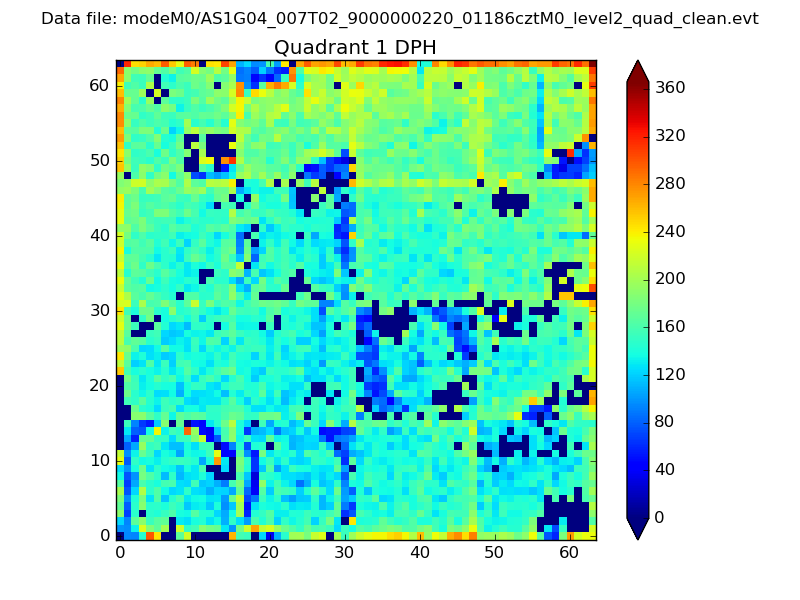
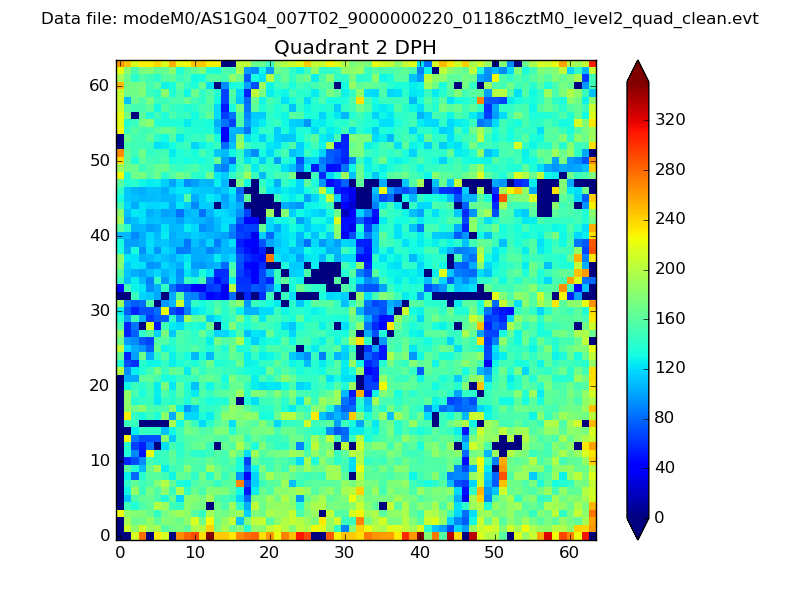
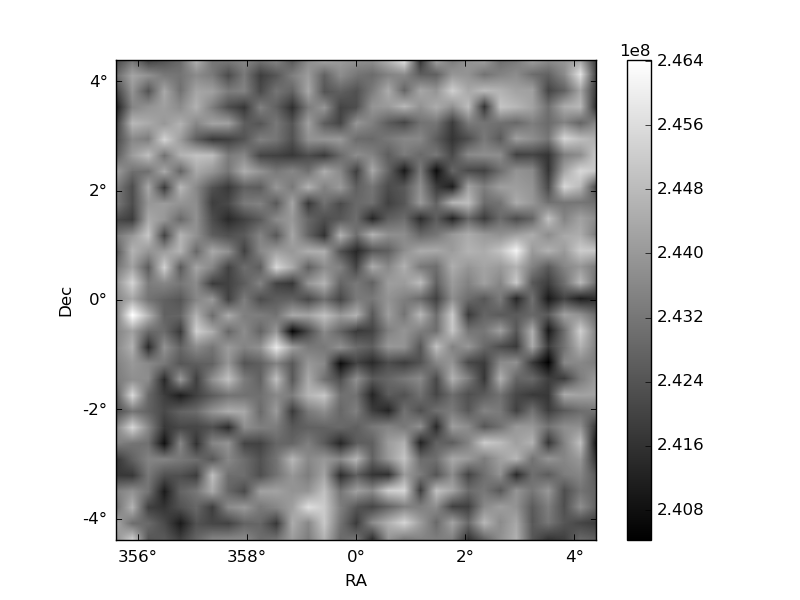
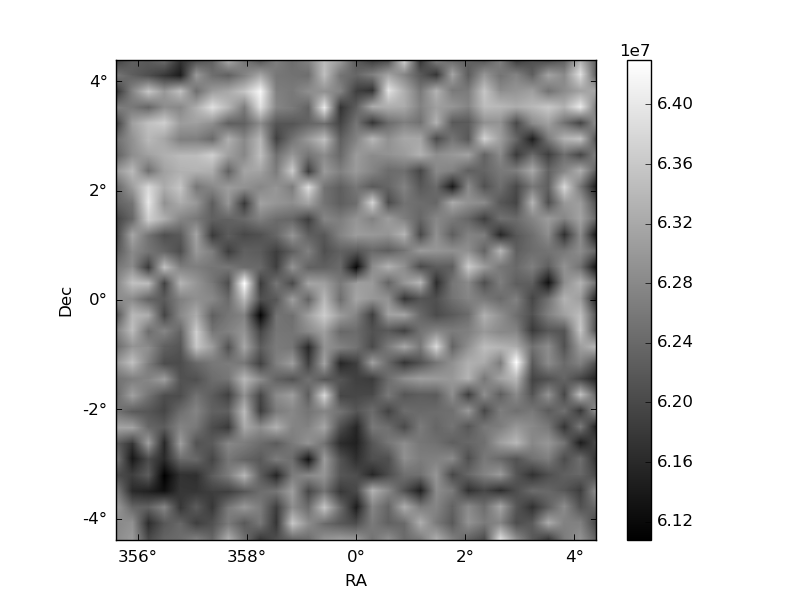
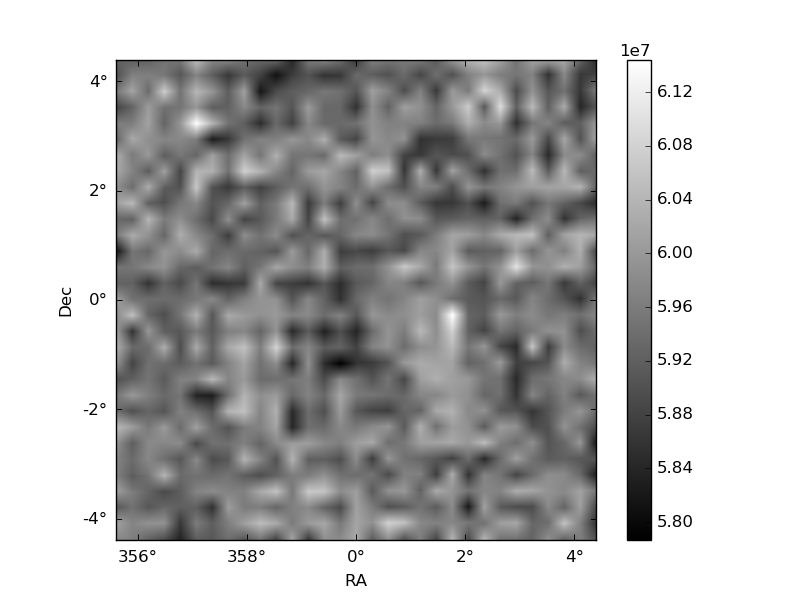
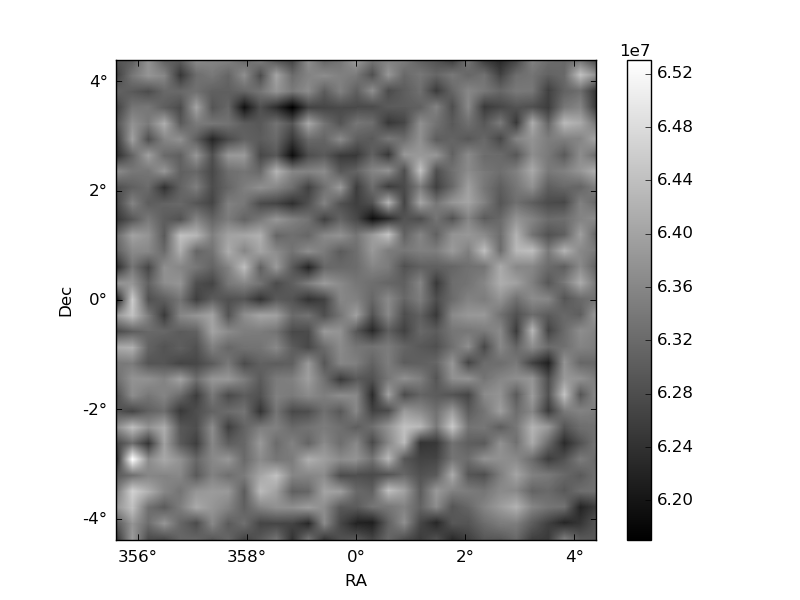
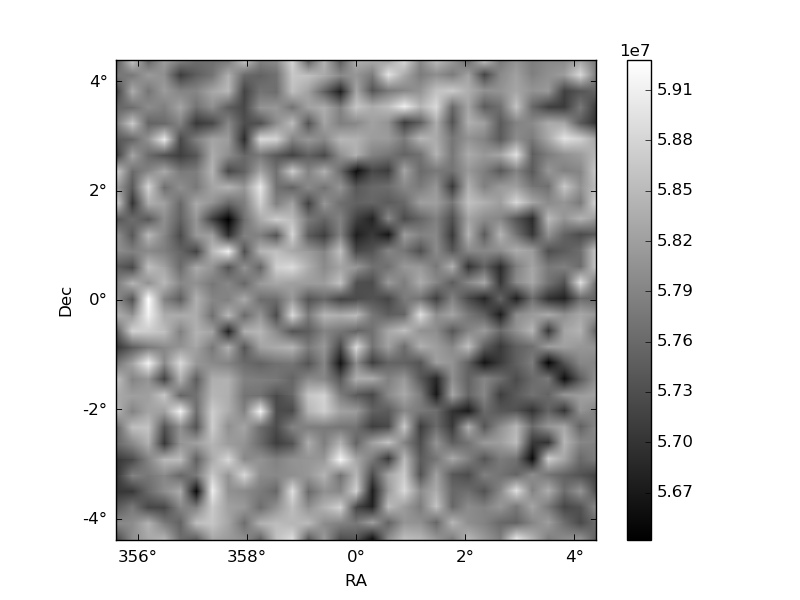
Histogram calculated using DETX and DETY for each event in the final _common_clean file
| Quadrant A | 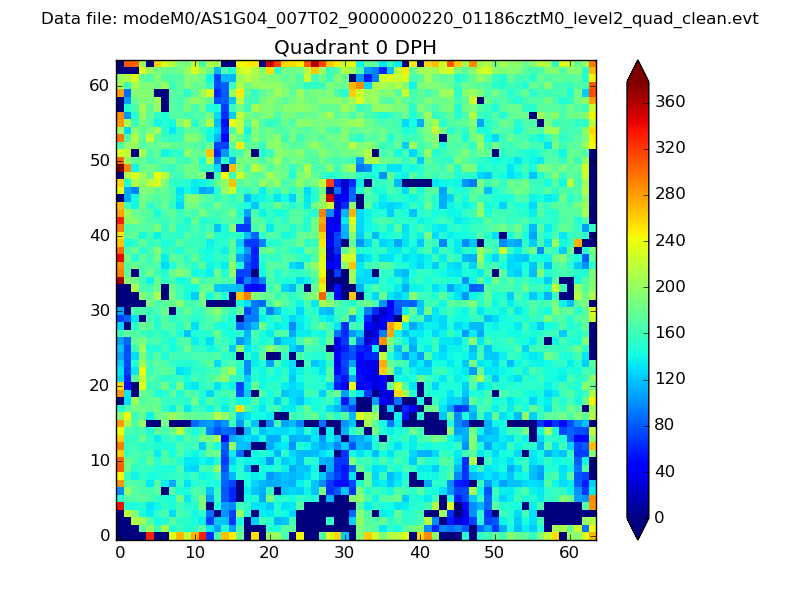 |
 |
Quadrant B |
|---|---|---|---|
| Quadrant D | 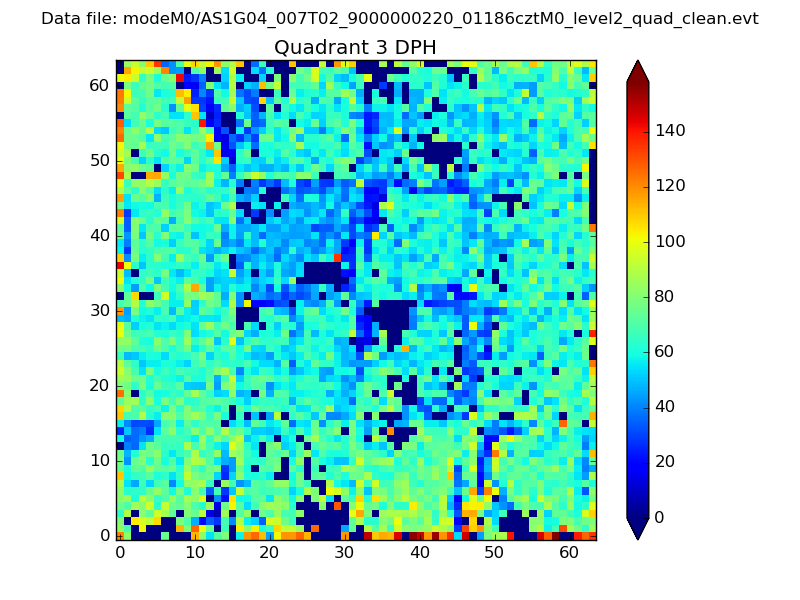 |
 |
Quadrant C |
| Plot type | Count rate plots | Images |
|---|---|---|
| Comparison with Poisson distribution Blue bars denote a histogram of data divided into 1 sec bins. Red curve is a Poisson curve with rate = median count rate of data. |
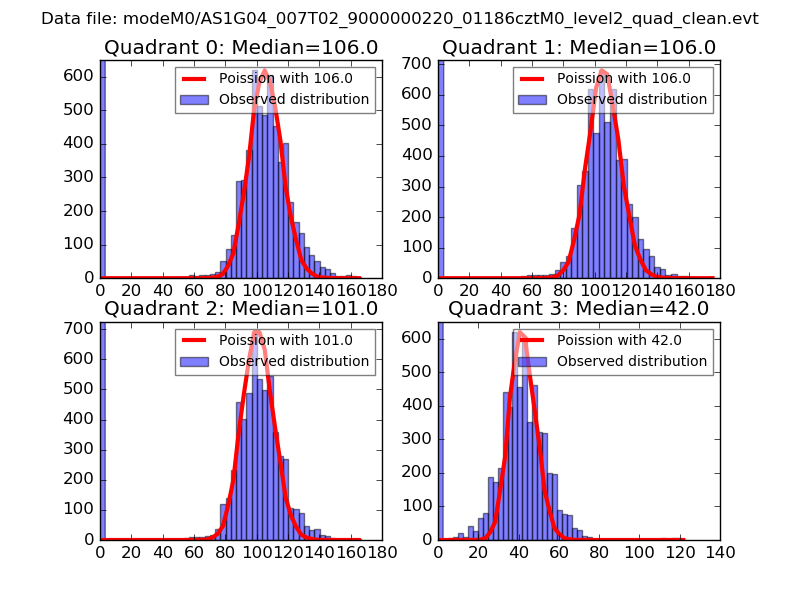 |
 |
| Quadrant-wise count rates Data is divided into 100 sec bins |
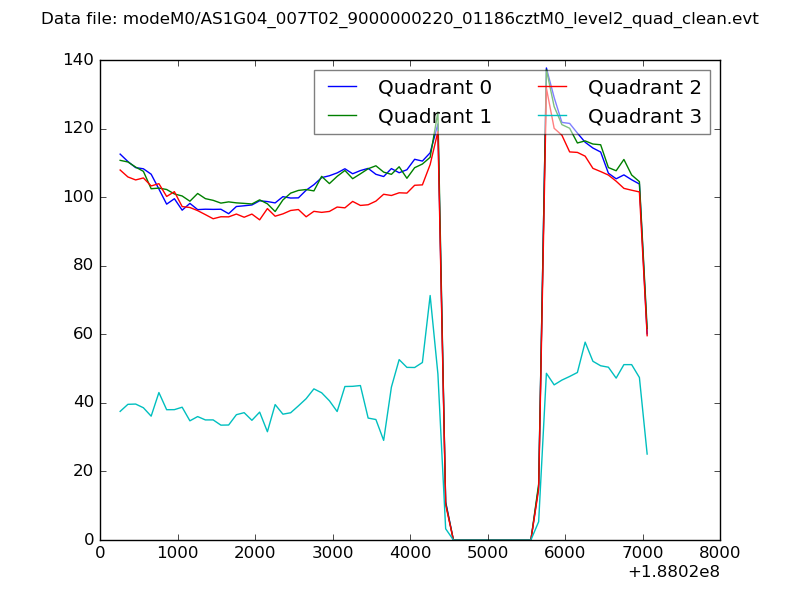 |
|
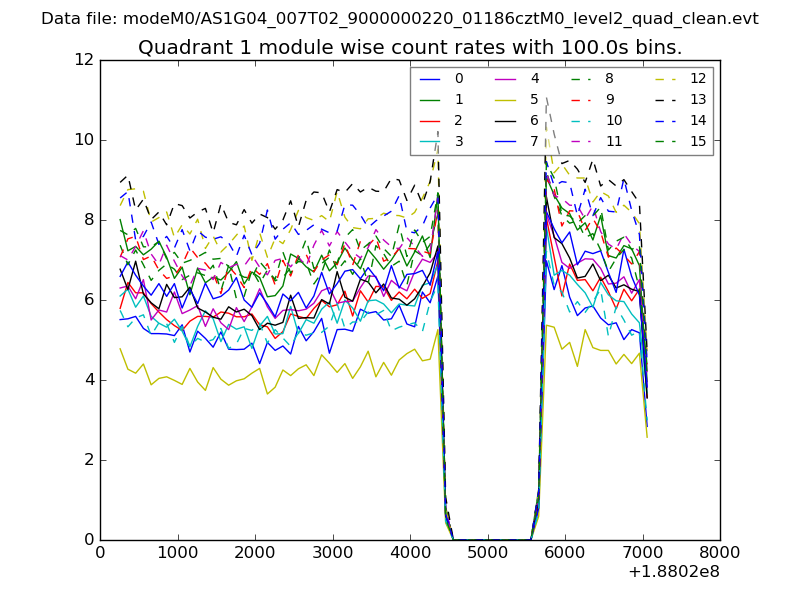
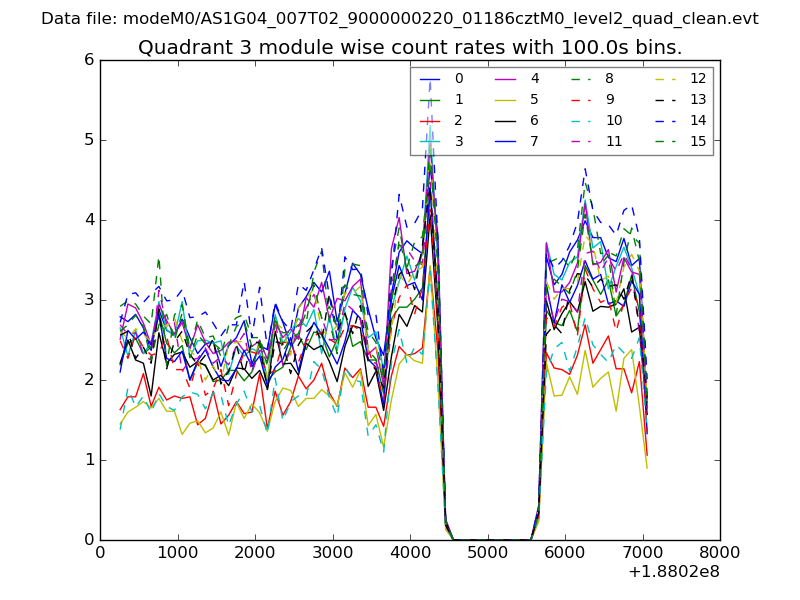
| Module-wise count rates for Quadrant A Data is divided into 100 sec bins |
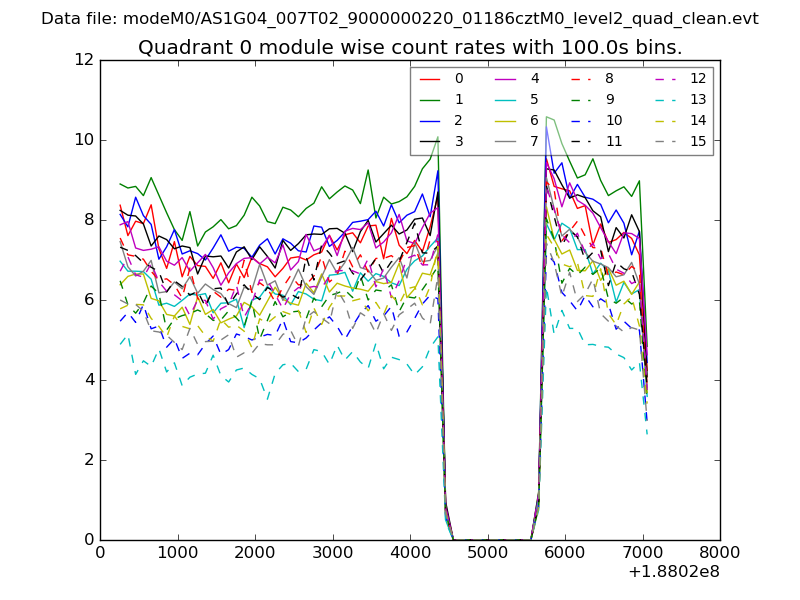 |
 |
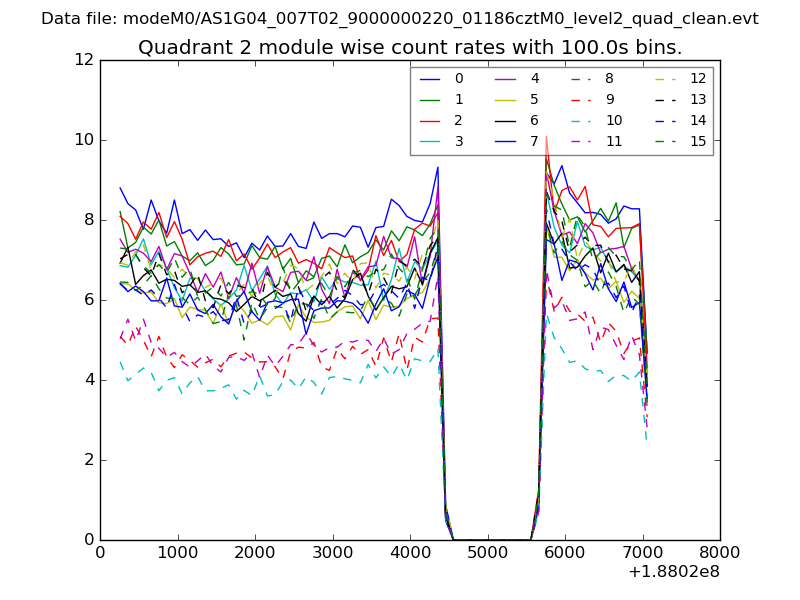
| Module-wise count rates for Quadrant B Data is divided into 100 sec bins |
 |
 |
| Module-wise count rates for Quadrant C Data is divided into 100 sec bins |
 |
 |
| Module-wise count rates for Quadrant D Data is divided into 100 sec bins |
 |
 |
| Parameter | Plot |
|---|---|
| CZT HV Monitor | 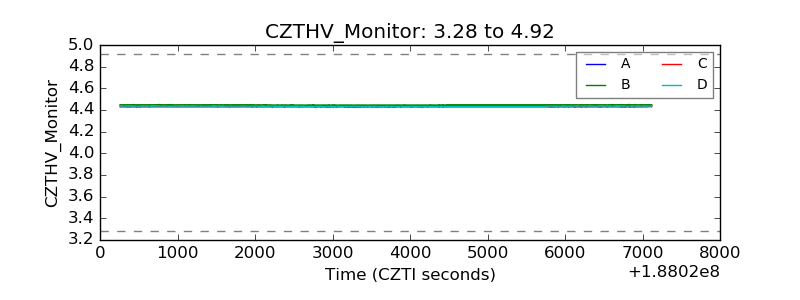 |
| D_VDD | 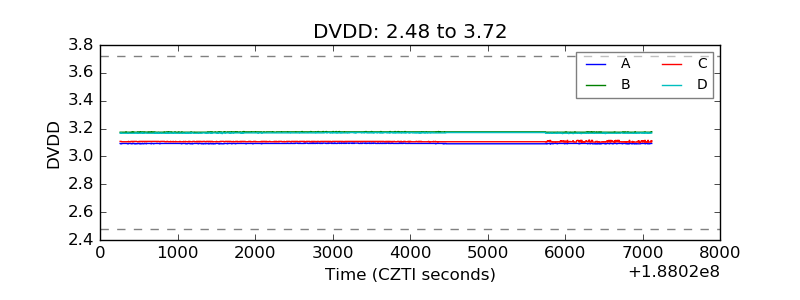 |
| Temperature 1 |  |
| Veto HV Monitor | 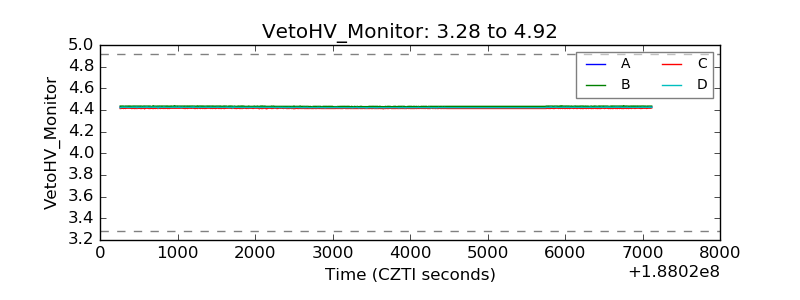 |
| Veto LLD |  |
| Alpha Counter | 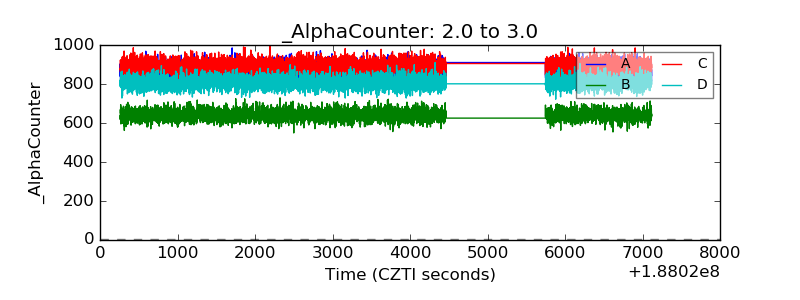 |
| _CPM_Rate | 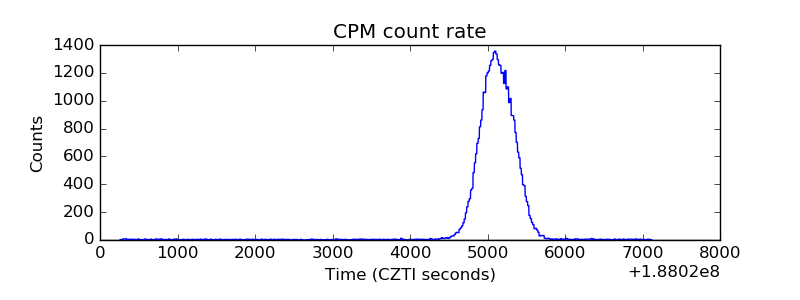 |
| CZT Counter | 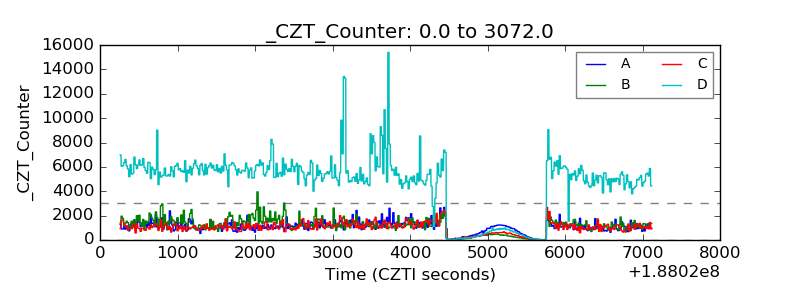 |
| +2.5 Volts monitor |  |
| +5 Volts monitor |  |
| _ROLL_ROT | 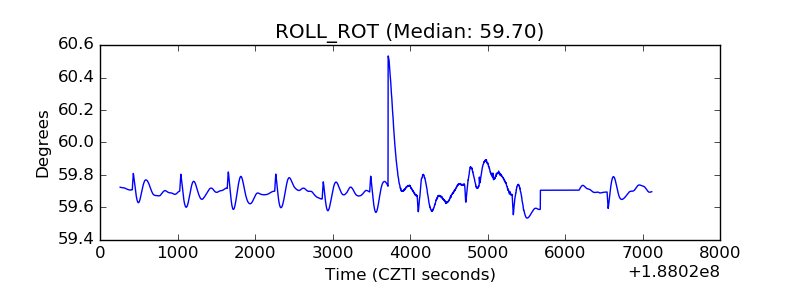 |
| _Roll_DEC | 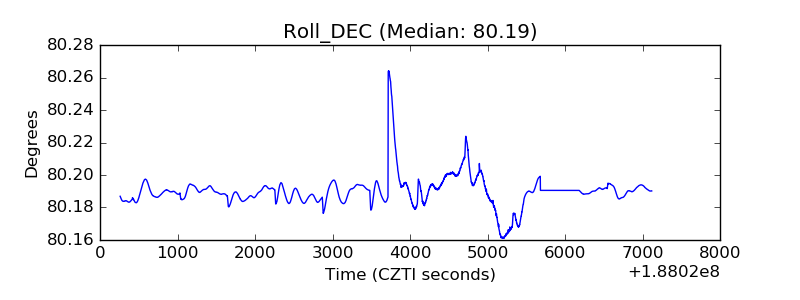 |
| _Roll_RA | 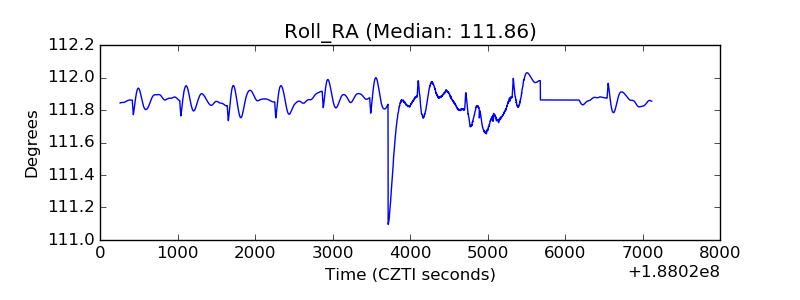 |
| Veto Counter | 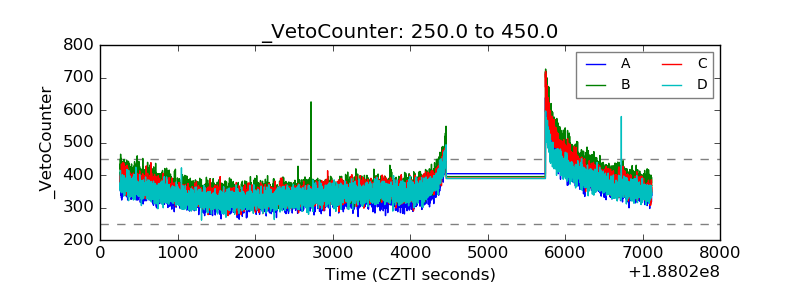 |