| Param | Original file | Final file |
|---|---|---|
| Filename | modeM0/AS1G04_007T02_9000000220_01189cztM0_level2.evt | modeM0/AS1G04_007T02_9000000220_01189cztM0_level2_quad_clean.evt |
| Size (bytes) | 1,147,144,320 | 90,486,720 |
| Size | 1.1 GB | 86.3 MB |
| Events in quadrant A | 7,477,360 | 618,868 |
| Events in quadrant B | 7,866,675 | 612,840 |
| Events in quadrant C | 7,292,100 | 590,999 |
| Events in quadrant D | 11,697,281 | 486,435 |
| Mode M9 | |||
|---|---|---|---|
| Quadrant | BADHDUFLAG | Total packets | Discarded packets |
| A | 0 | 8 | 0 |
| B | 0 | 8 | 0 |
| C | 0 | 8 | 0 |
| D | 0 | 8 | 0 |
| Mode M0 | |||
|---|---|---|---|
| Quadrant | BADHDUFLAG | Total packets | Discarded packets |
| A | 0 | 26615 | 2 |
| B | 0 | 27712 | 1 |
| C | 0 | 26058 | 1 |
| D | 0 | 39470 | 1 |
| Mode SS | |||
|---|---|---|---|
| Quadrant | BADHDUFLAG | Total packets | Discarded packets |
| A | 0 | 124 | 0 |
| B | 0 | 124 | 0 |
| C | 0 | 124 | 0 |
| D | 0 | 124 | 0 |
| Quadrant | Total seconds | Saturated seconds | Saturation percentage |
|---|---|---|---|
| A | 6165 | 44 | 0.713706% |
| B | 6165 | 49 | 0.794809% |
| C | 6165 | 16 | 0.259530% |
| D | 6165 | 2171 | 35.214923% |
Noise dominated data is calculated using 1-second bins in cleaned event files. If a bin has >2000 counts, and if more than 50% of those come from <1% of pixels, then it is considered to be noise-dominated and hence unusable.
| Quadrant | # 1 sec bins | Bins with >0 counts | Bins with >2000 counts | High rate bins dominated by noise | Noise dominated (total time) | Noise dominated (detector-on time) | Marked lightcurve |
|---|---|---|---|---|---|---|---|
| A | 6945 | 6166 | 247 | 247 | 3.56% | 4.01% | 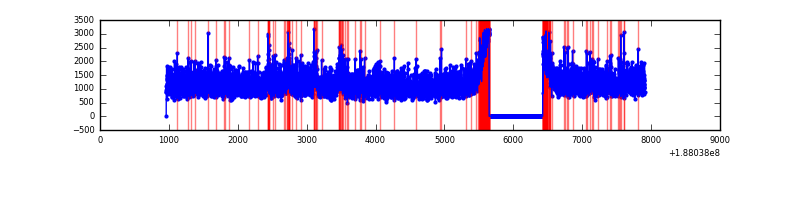 |
| B | 6945 | 6166 | 325 | 325 | 4.68% | 5.27% |  |
| C | 6945 | 6166 | 169 | 169 | 2.43% | 2.74% | 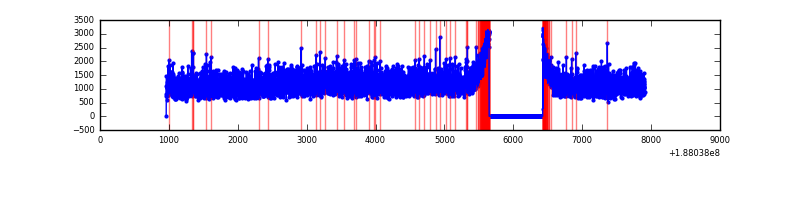 |
| D | 6945 | 6166 | 2480 | 2480 | 35.71% | 40.22% | 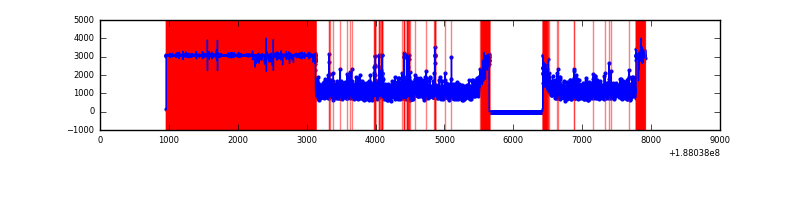 |
Top three noisy pixels from each quadrant. If the there are fewer than three noisy pixels in the level2.evt file, extra rows are filled as -1
| Pixel properties | Quadrant properties | ||||||
|---|---|---|---|---|---|---|---|
| Quadrant | DetID | PixID | Counts | Sigma | Mean | Median | Sigma |
| A | 8 | 14 | 144459 | 308.97 | 1900 | 1912 | 461.4 |
| A | 15 | 223 | 22269 | 44.12 | 1900 | 1912 | 461.4 |
| A | 8 | 15 | 8160 | 13.54 | 1900 | 1912 | 461.4 |
| B | 6 | 53 | 186395 | 393.89 | 1965 | 1974 | 468.2 |
| B | 2 | 32 | 49698 | 101.93 | 1965 | 1974 | 468.2 |
| B | 4 | 185 | 33851 | 68.08 | 1965 | 1974 | 468.2 |
| C | 15 | 241 | 357412 | 724.62 | 1763 | 1822 | 490.7 |
| C | 3 | 111 | 23085 | 43.33 | 1763 | 1822 | 490.7 |
| C | 3 | 79 | 22337 | 41.81 | 1763 | 1822 | 490.7 |
| D | 1 | 239 | 5648191 | 11841.03 | 1520 | 1568 | 476.9 |
| D | 10 | 84 | 262748 | 547.7 | 1520 | 1568 | 476.9 |
| D | 2 | 16 | 28346 | 56.15 | 1520 | 1568 | 476.9 |
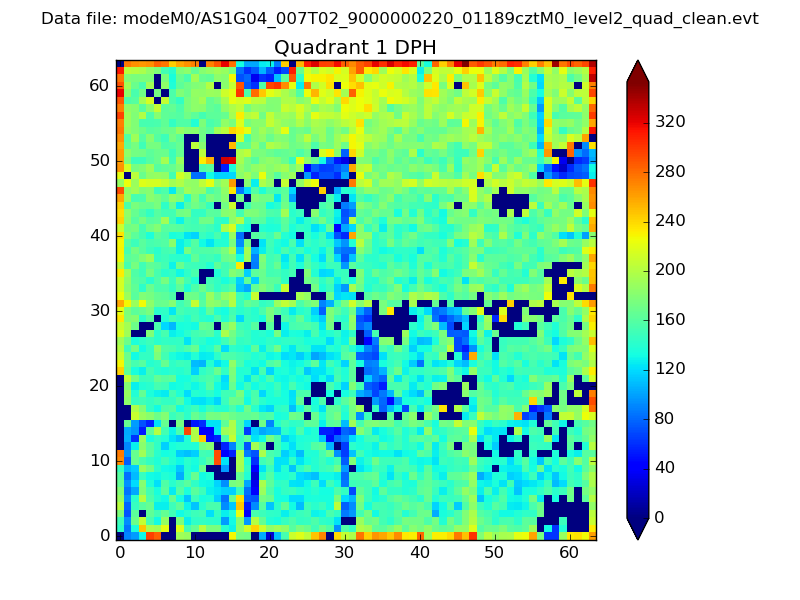
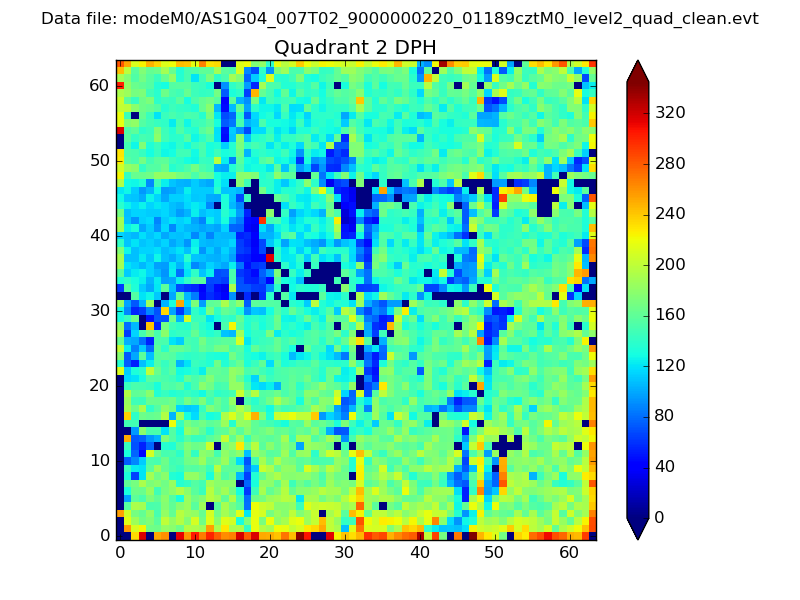
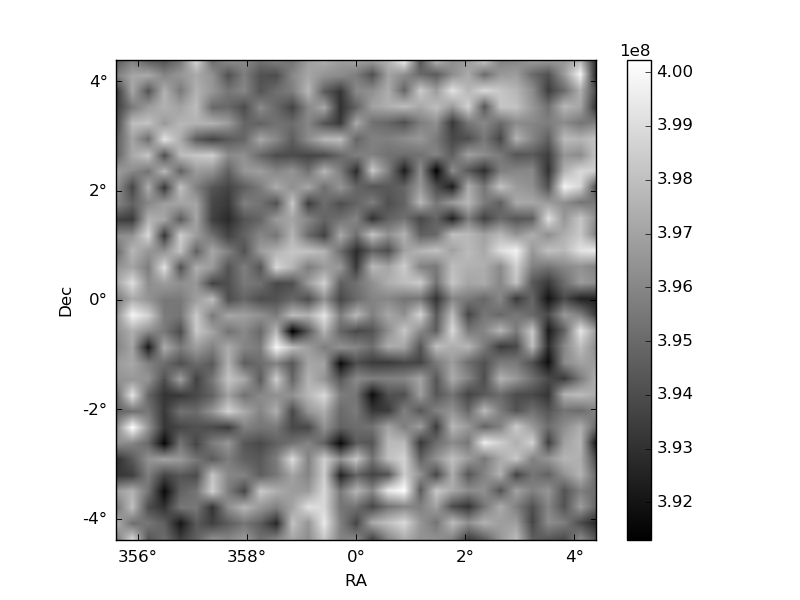
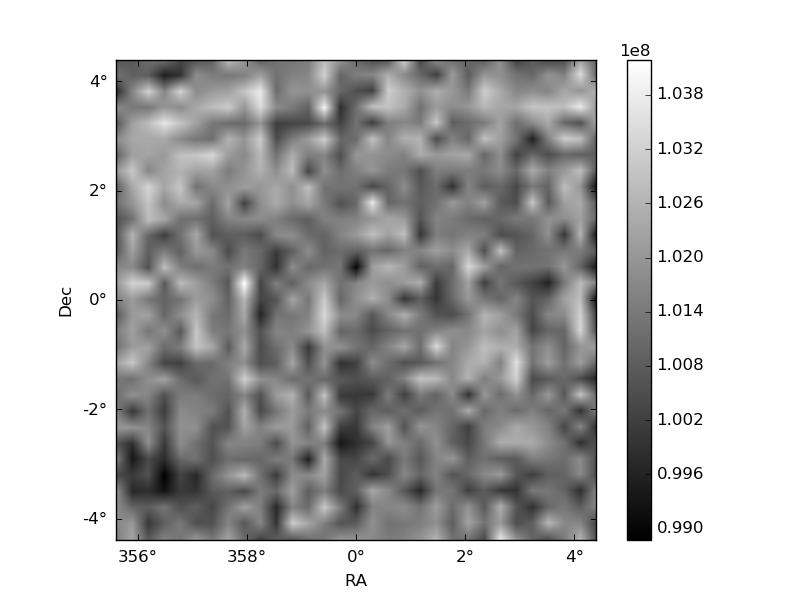
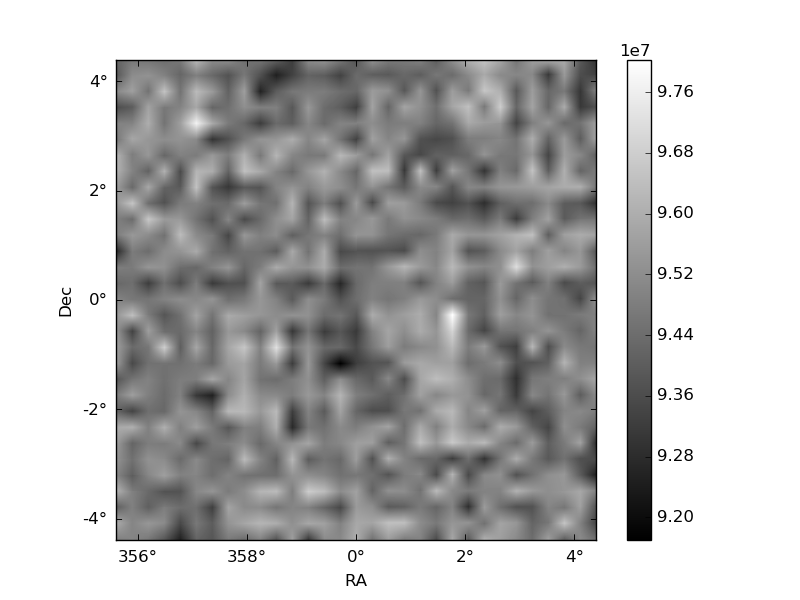
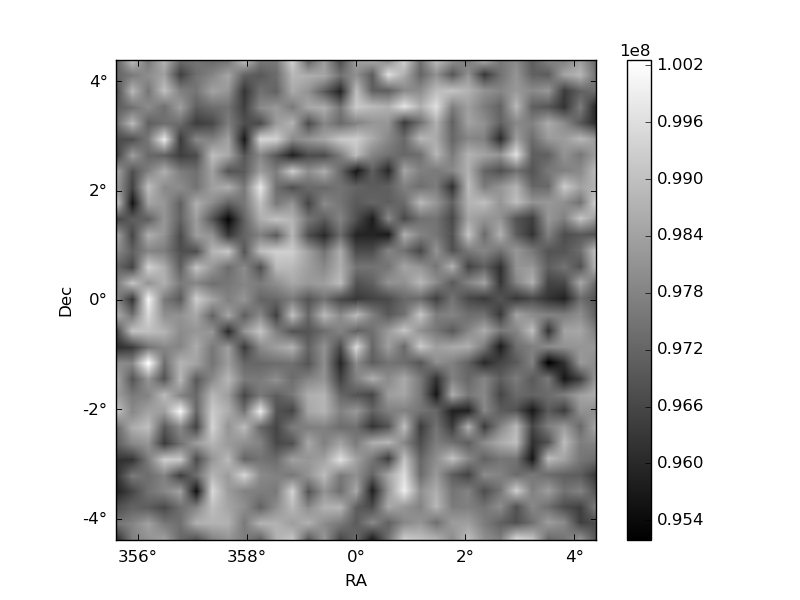
Histogram calculated using DETX and DETY for each event in the final _common_clean file
| Quadrant A | 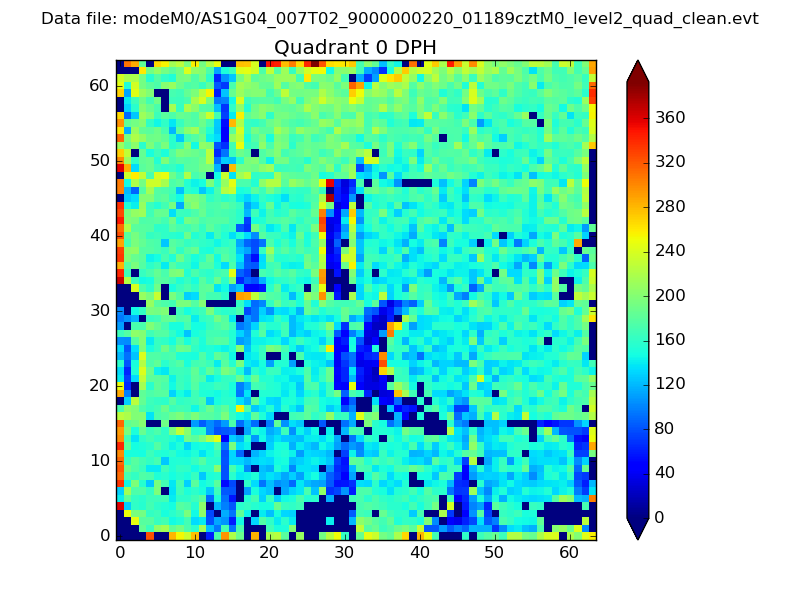 |
 |
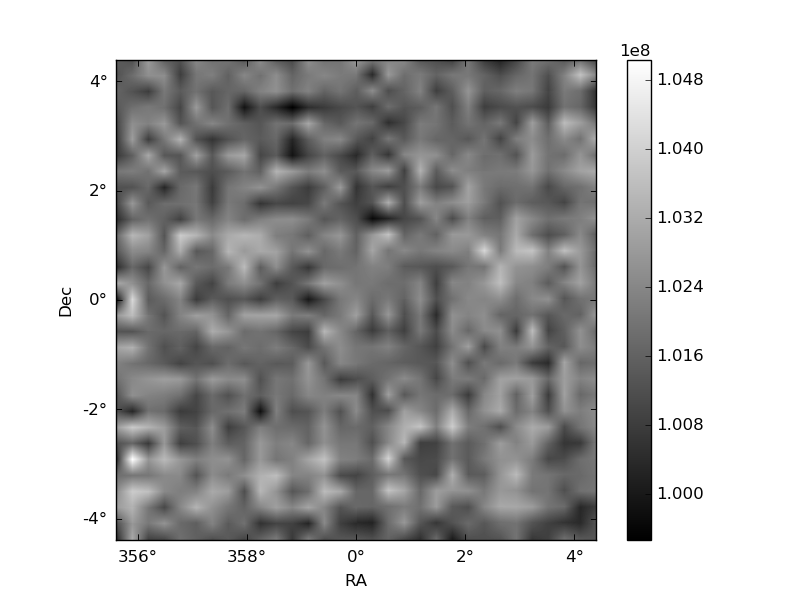
Quadrant B |
|---|---|---|---|
| Quadrant D | 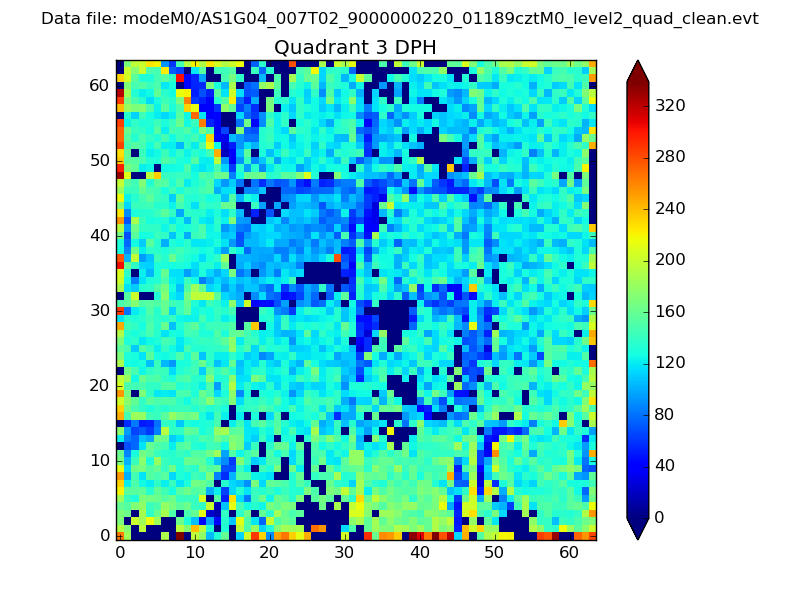 |
 |
Quadrant C |
| Plot type | Count rate plots | Images |
|---|---|---|
| Comparison with Poisson distribution Blue bars denote a histogram of data divided into 1 sec bins. Red curve is a Poisson curve with rate = median count rate of data. |
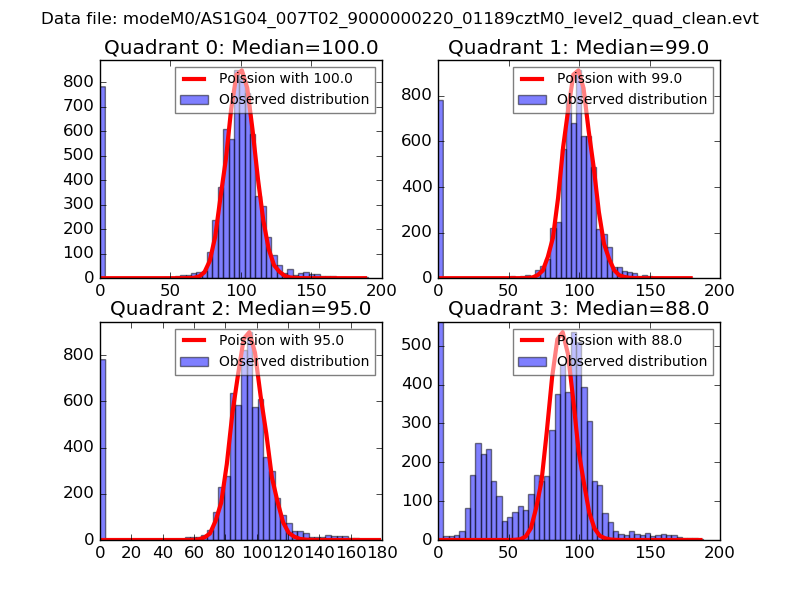 |
 |
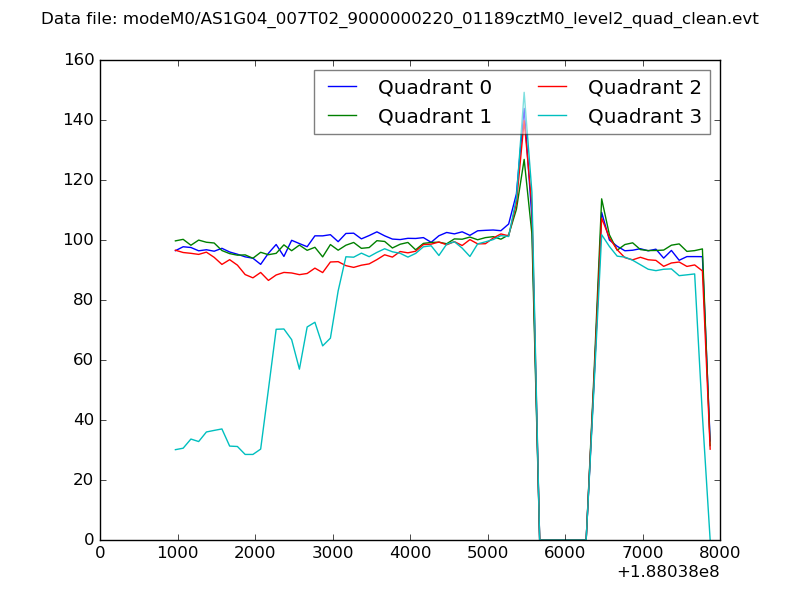
| Quadrant-wise count rates Data is divided into 100 sec bins |
 |
|
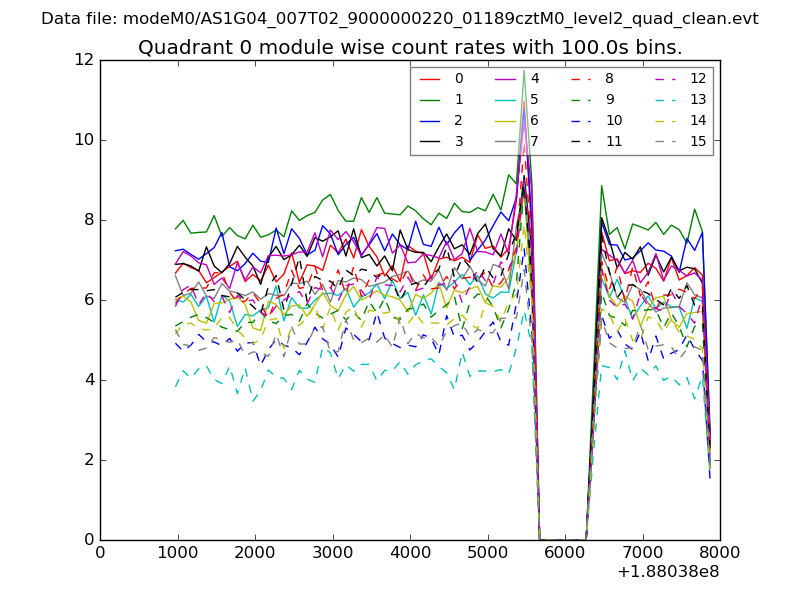
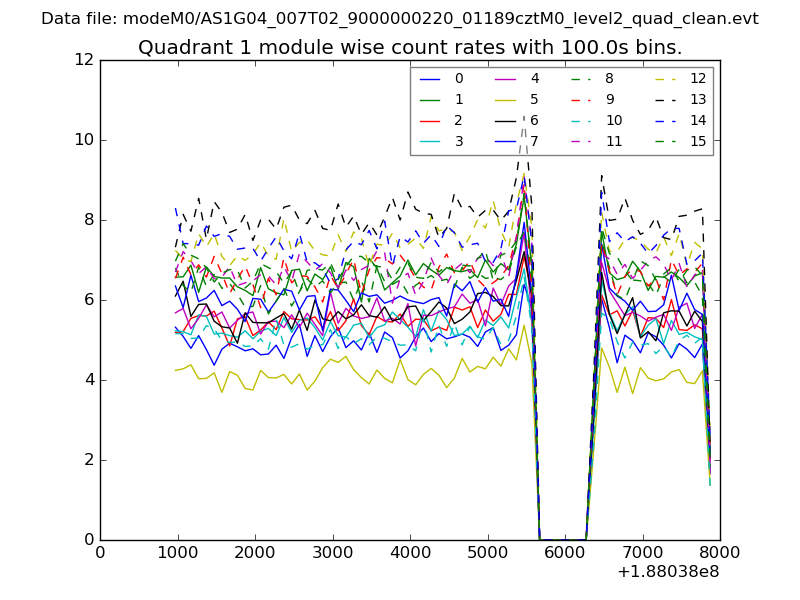
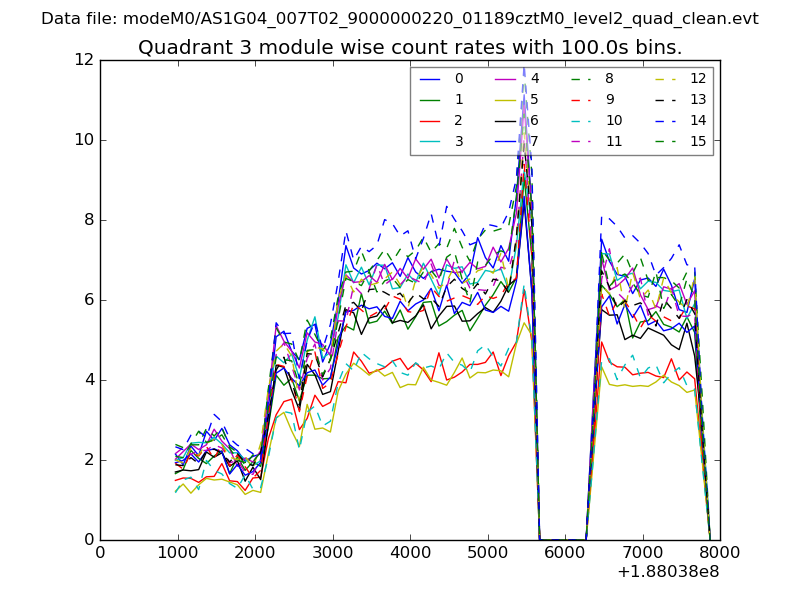
| Module-wise count rates for Quadrant A Data is divided into 100 sec bins |
 |
 |
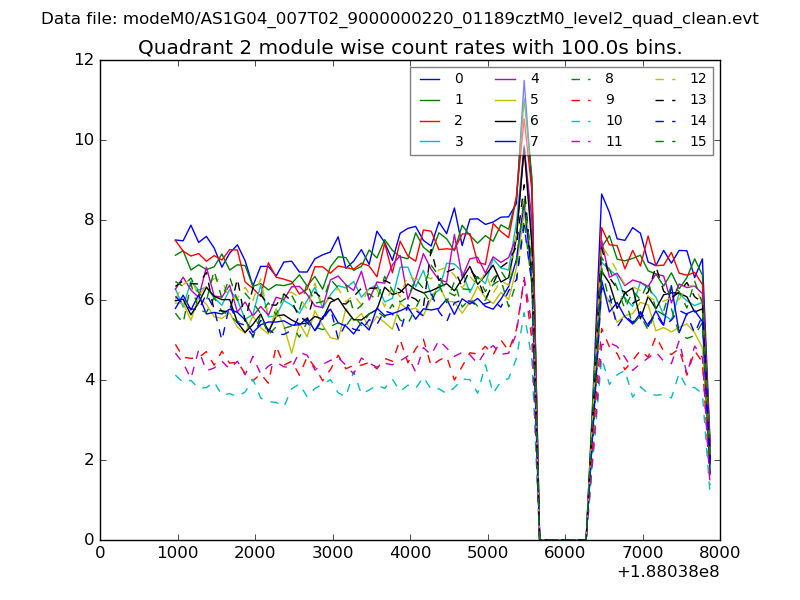
| Module-wise count rates for Quadrant B Data is divided into 100 sec bins |
 |
 |
| Module-wise count rates for Quadrant C Data is divided into 100 sec bins |
 |
 |
| Module-wise count rates for Quadrant D Data is divided into 100 sec bins |
 |
 |
| Parameter | Plot |
|---|---|
| CZT HV Monitor | 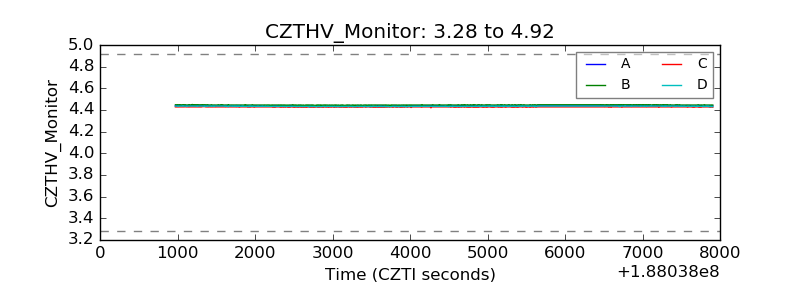 |
| D_VDD | 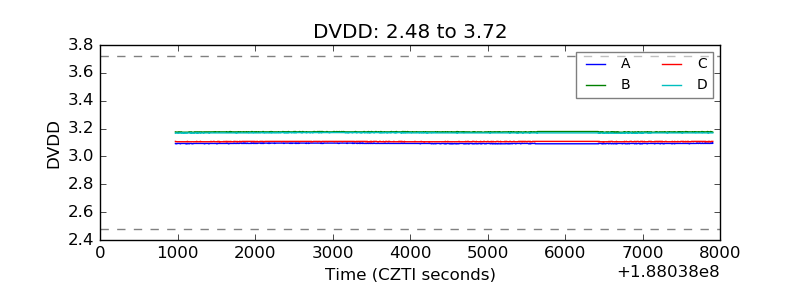 |
| Temperature 1 | 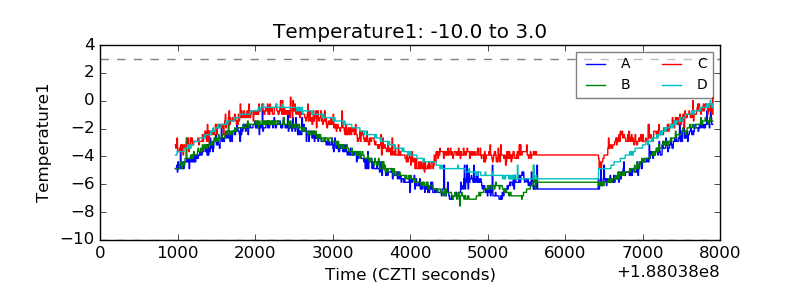 |
| Veto HV Monitor | 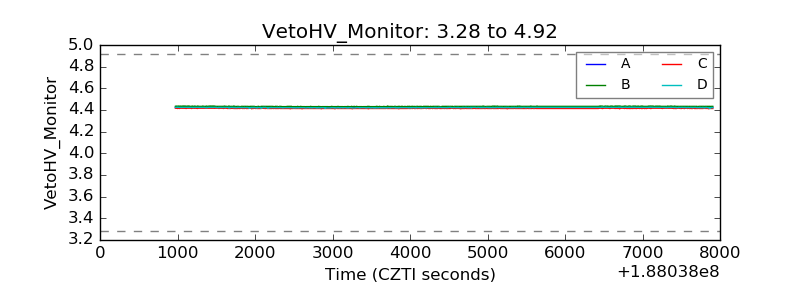 |
| Veto LLD | 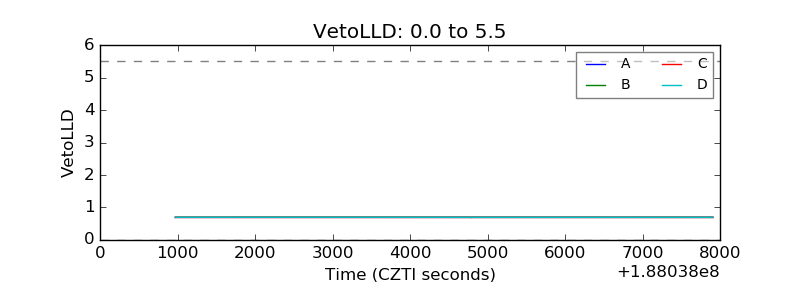 |
| Alpha Counter | 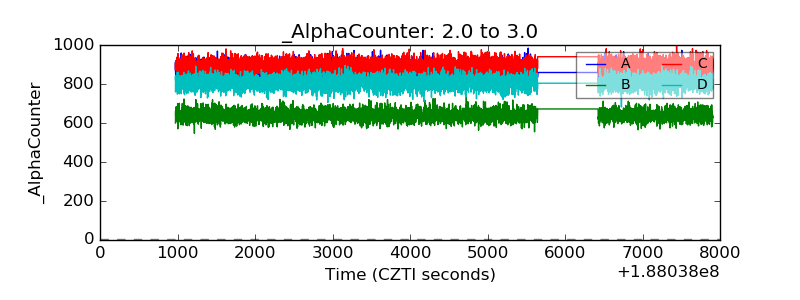 |
| _CPM_Rate | 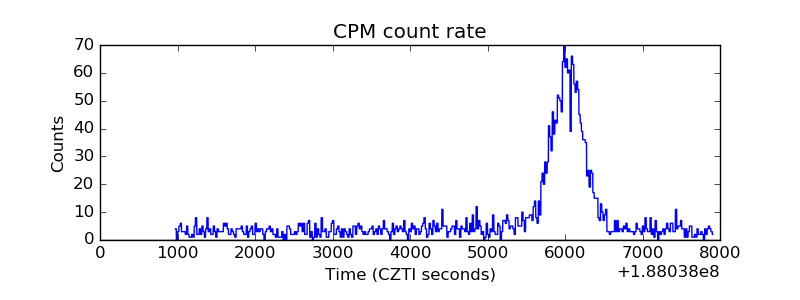 |
| CZT Counter | 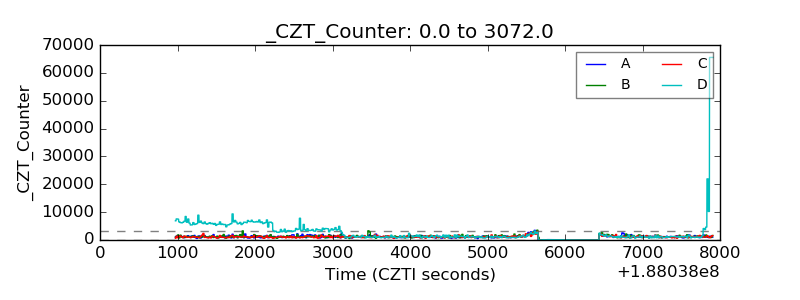 |
| +2.5 Volts monitor |  |
| +5 Volts monitor |  |
| _ROLL_ROT | 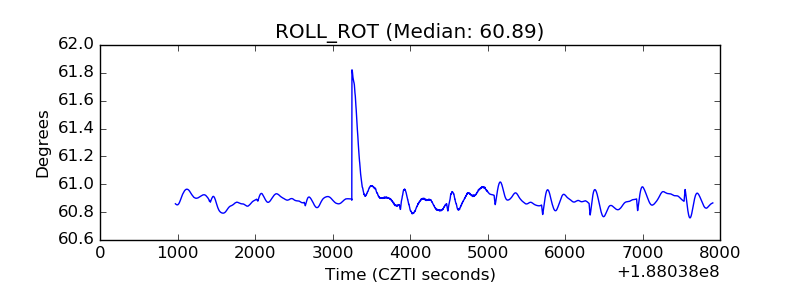 |
| _Roll_DEC | 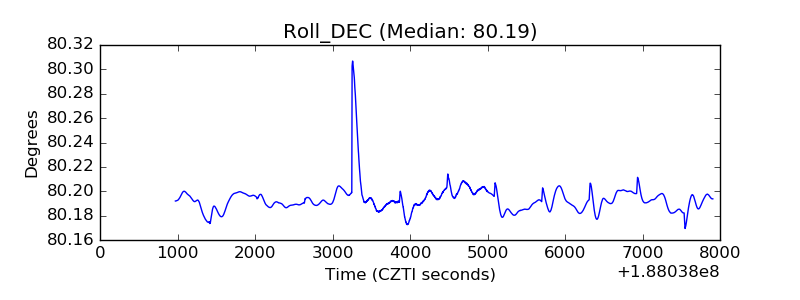 |
| _Roll_RA | 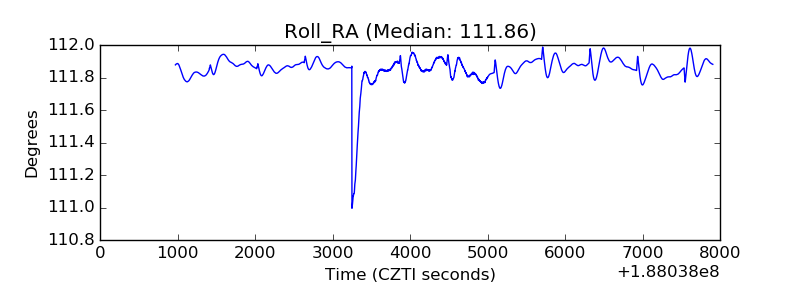 |
| Veto Counter | 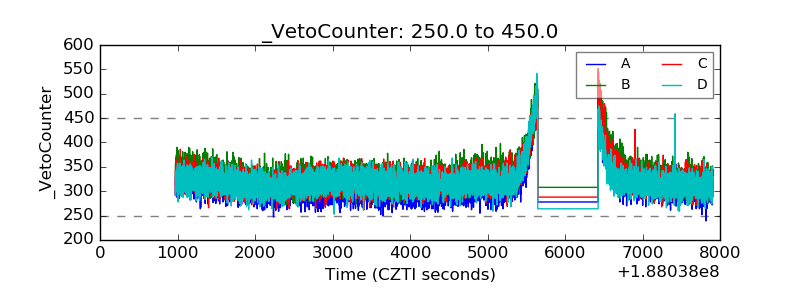 |