| Param | Original file | Final file |
|---|---|---|
| Filename | modeM0/AS1G04_007T02_9000000220_01190cztM0_level2.evt | modeM0/AS1G04_007T02_9000000220_01190cztM0_level2_quad_clean.evt |
| Size (bytes) | 1,463,555,520 | 109,607,040 |
| Size | 1.4 GB | 104.5 MB |
| Events in quadrant A | 9,412,710 | 755,103 |
| Events in quadrant B | 9,903,999 | 749,466 |
| Events in quadrant C | 9,324,332 | 718,601 |
| Events in quadrant D | 15,179,222 | 564,178 |
| Mode M9 | |||
|---|---|---|---|
| Quadrant | BADHDUFLAG | Total packets | Discarded packets |
| A | 0 | 2 | 0 |
| B | 0 | 2 | 0 |
| C | 0 | 2 | 0 |
| D | 0 | 2 | 0 |
| Mode M0 | |||
|---|---|---|---|
| Quadrant | BADHDUFLAG | Total packets | Discarded packets |
| A | 0 | 33381 | 2 |
| B | 0 | 34851 | 1 |
| C | 0 | 33087 | 1 |
| D | 0 | 50954 | 1 |
| Mode SS | |||
|---|---|---|---|
| Quadrant | BADHDUFLAG | Total packets | Discarded packets |
| A | 0 | 156 | 0 |
| B | 0 | 156 | 0 |
| C | 0 | 156 | 0 |
| D | 0 | 156 | 0 |
| Quadrant | Total seconds | Saturated seconds | Saturation percentage |
|---|---|---|---|
| A | 7636 | 77 | 1.008381% |
| B | 7636 | 48 | 0.628601% |
| C | 7636 | 64 | 0.838135% |
| D | 7636 | 2555 | 33.459927% |
Noise dominated data is calculated using 1-second bins in cleaned event files. If a bin has >2000 counts, and if more than 50% of those come from <1% of pixels, then it is considered to be noise-dominated and hence unusable.
| Quadrant | # 1 sec bins | Bins with >0 counts | Bins with >2000 counts | High rate bins dominated by noise | Noise dominated (total time) | Noise dominated (detector-on time) | Marked lightcurve |
|---|---|---|---|---|---|---|---|
| A | 7781 | 7639 | 428 | 428 | 5.50% | 5.60% | 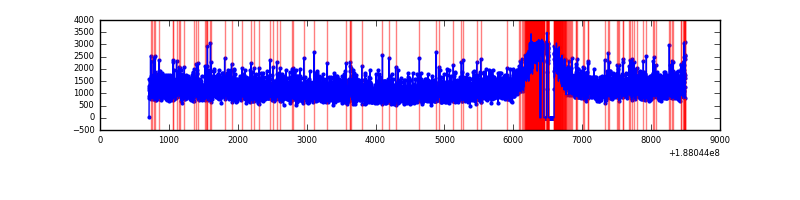 |
| B | 7781 | 7639 | 453 | 453 | 5.82% | 5.93% | 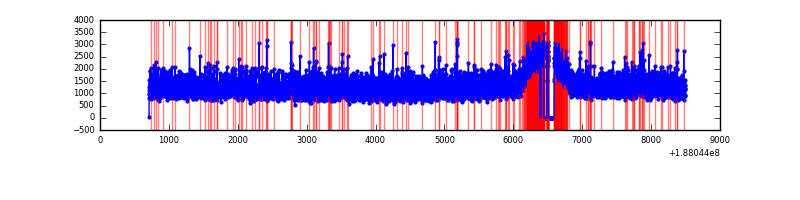 |
| C | 7781 | 7639 | 353 | 353 | 4.54% | 4.62% | 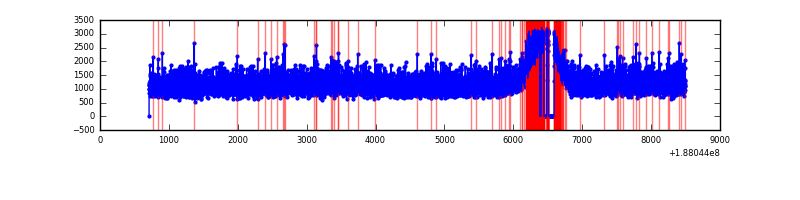 |
| D | 7781 | 7639 | 3549 | 3549 | 45.61% | 46.46% | 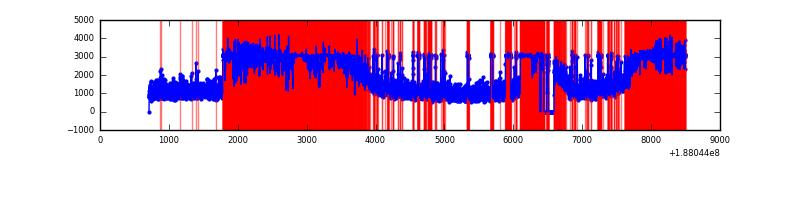 |
Top three noisy pixels from each quadrant. If the there are fewer than three noisy pixels in the level2.evt file, extra rows are filled as -1
| Pixel properties | Quadrant properties | ||||||
|---|---|---|---|---|---|---|---|
| Quadrant | DetID | PixID | Counts | Sigma | Mean | Median | Sigma |
| A | 4 | 32 | 33764 | 53.41 | 2435 | 2446 | 586.3 |
| A | 0 | 51 | 15581 | 22.4 | 2435 | 2446 | 586.3 |
| A | 12 | 243 | 15416 | 22.12 | 2435 | 2446 | 586.3 |
| B | 8 | 4 | 136804 | 226.76 | 2493 | 2504 | 592.3 |
| B | 6 | 53 | 79065 | 129.27 | 2493 | 2504 | 592.3 |
| B | 5 | 249 | 37204 | 58.59 | 2493 | 2504 | 592.3 |
| C | 15 | 241 | 438393 | 688.85 | 2255 | 2329 | 633.0 |
| C | 3 | 79 | 38516 | 57.16 | 2255 | 2329 | 633.0 |
| C | 3 | 111 | 33180 | 48.74 | 2255 | 2329 | 633.0 |
| D | 1 | 239 | 6355713 | 11178.38 | 1828 | 1897 | 568.4 |
| D | 10 | 84 | 1311527 | 2304.05 | 1828 | 1897 | 568.4 |
| D | 1 | 238 | 188628 | 328.52 | 1828 | 1897 | 568.4 |
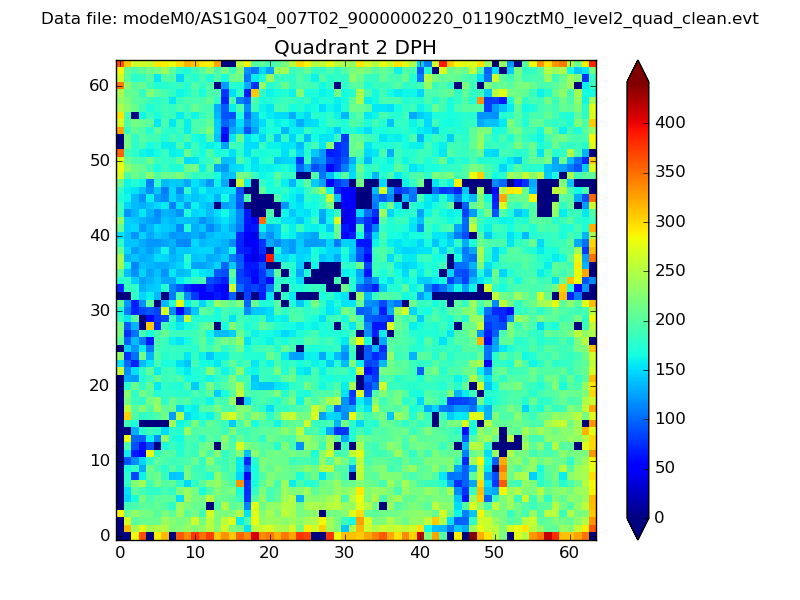
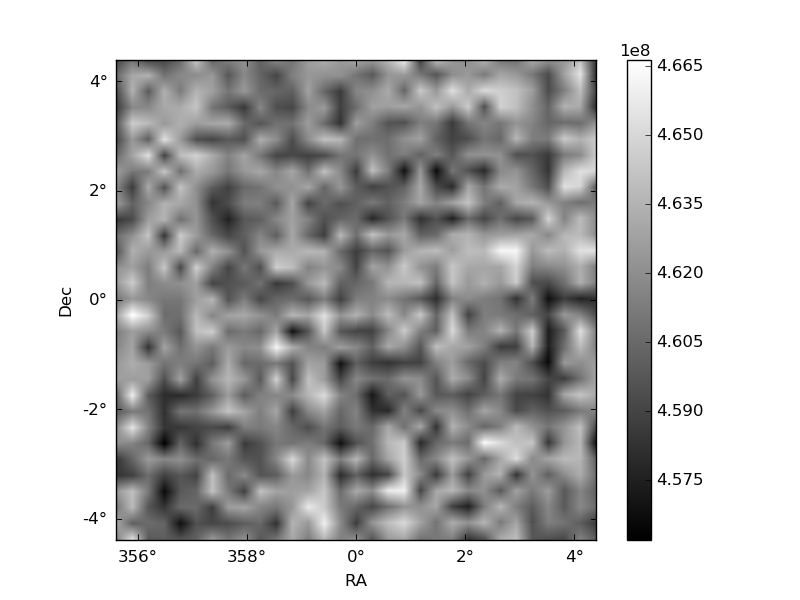
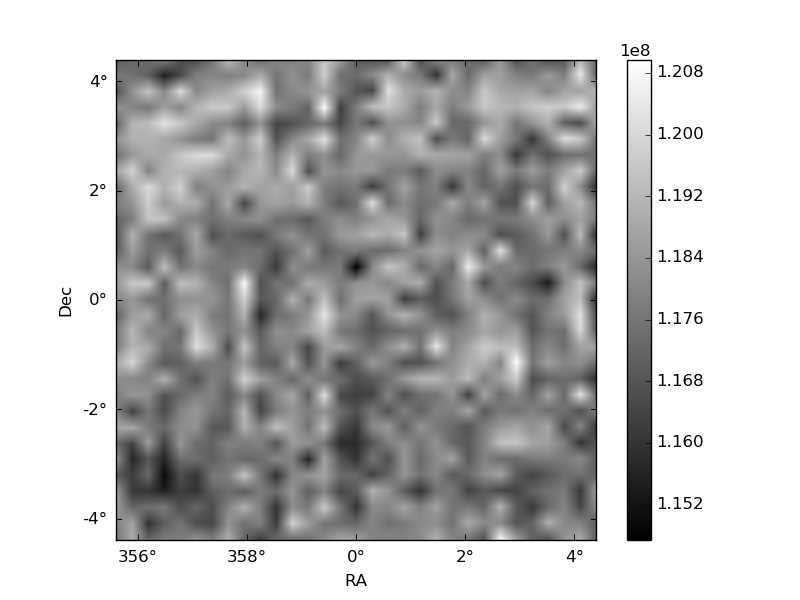
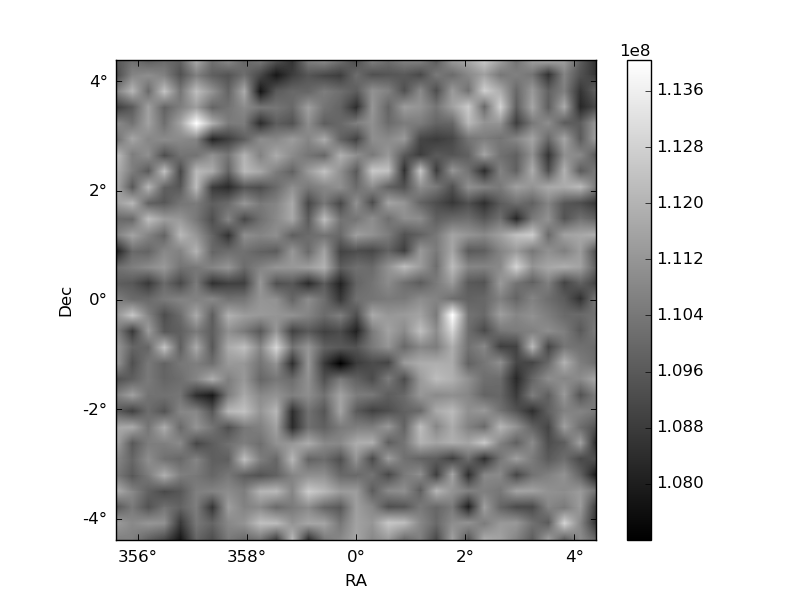
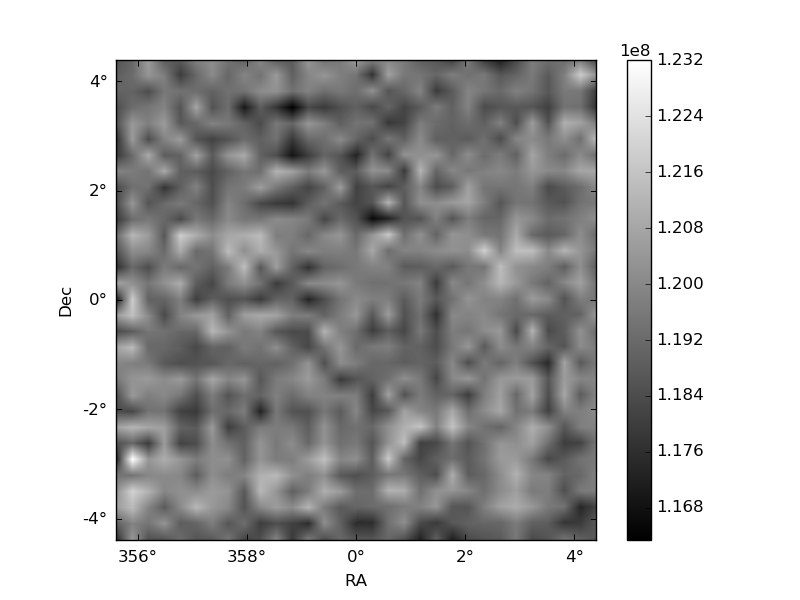
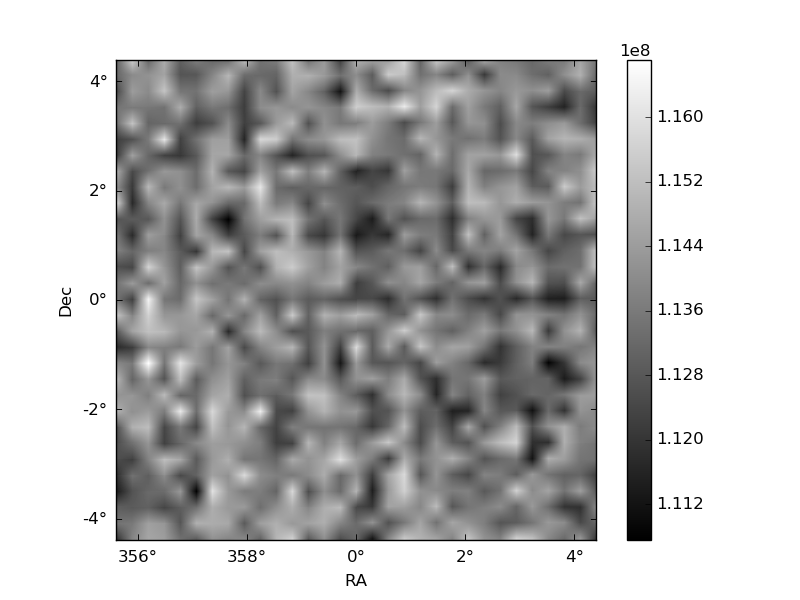
Histogram calculated using DETX and DETY for each event in the final _common_clean file
| Quadrant A | 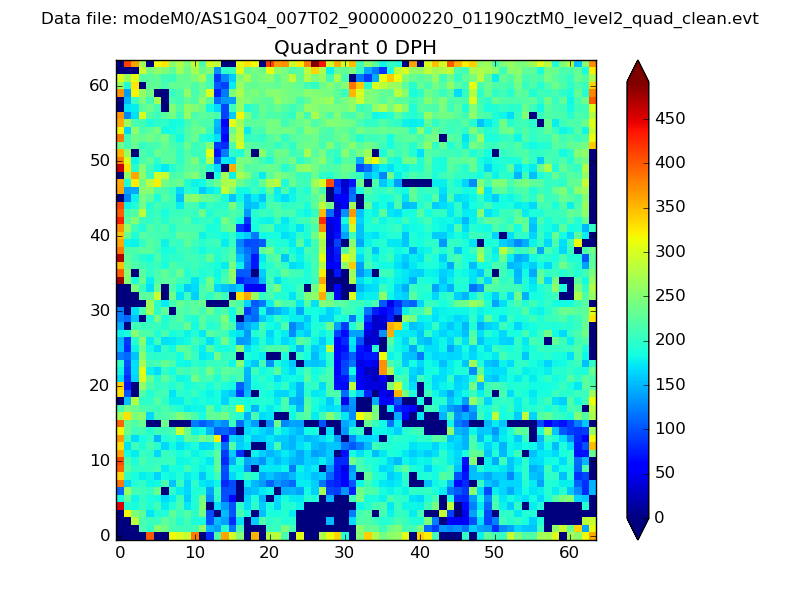 |
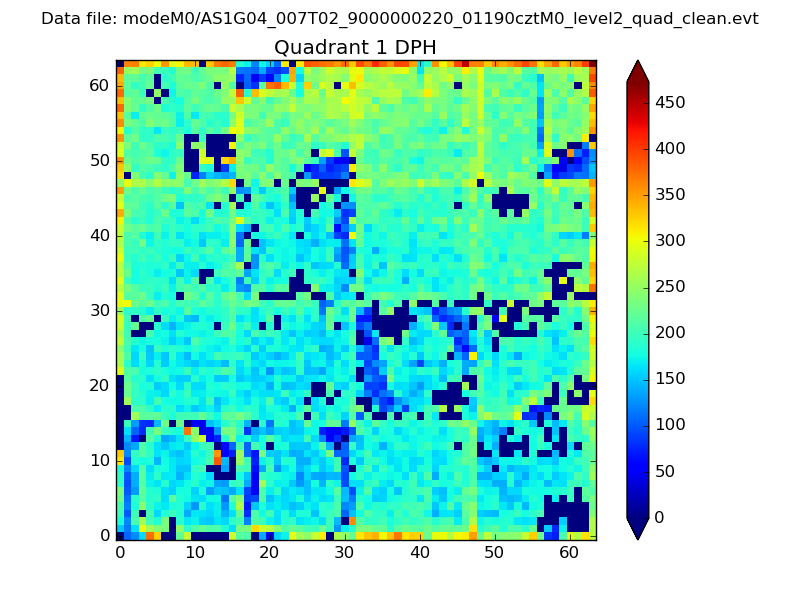 |
Quadrant B |
|---|---|---|---|
| Quadrant D | 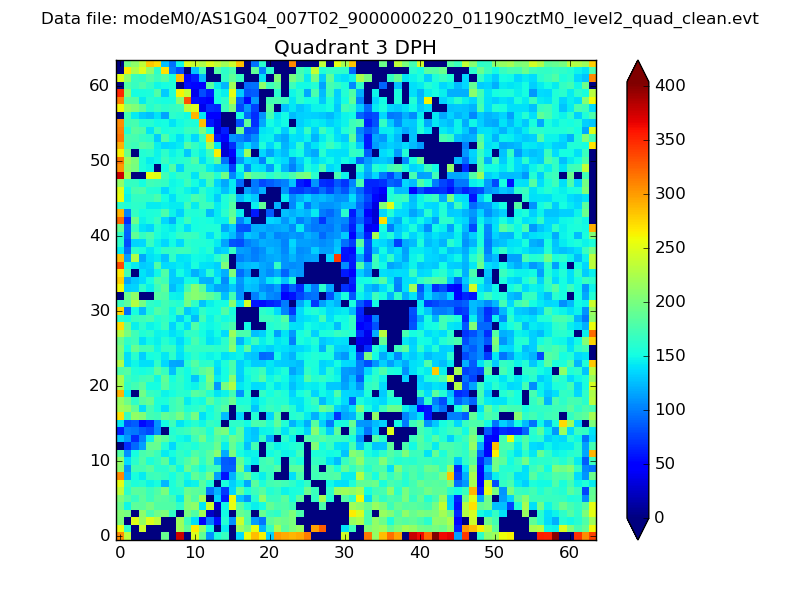 |
 |
Quadrant C |
| Plot type | Count rate plots | Images |
|---|---|---|
| Comparison with Poisson distribution Blue bars denote a histogram of data divided into 1 sec bins. Red curve is a Poisson curve with rate = median count rate of data. |
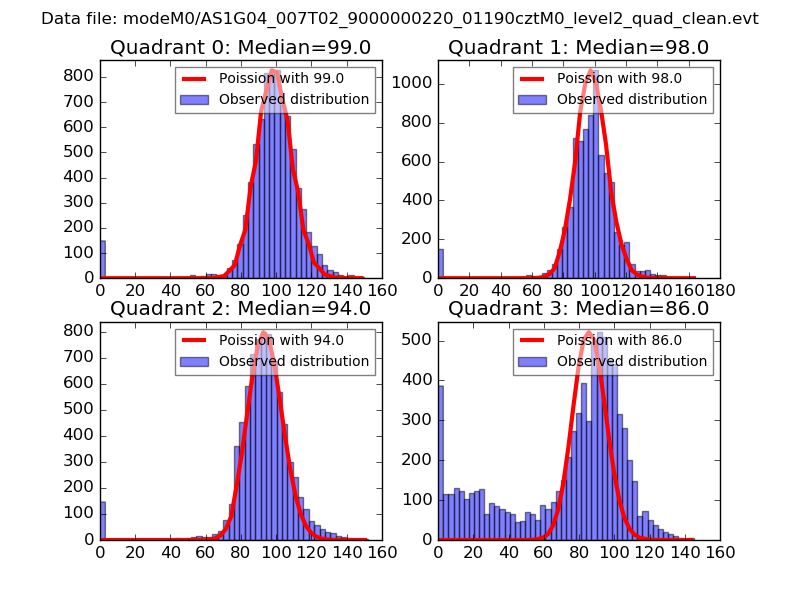 |
 |
| Quadrant-wise count rates Data is divided into 100 sec bins |
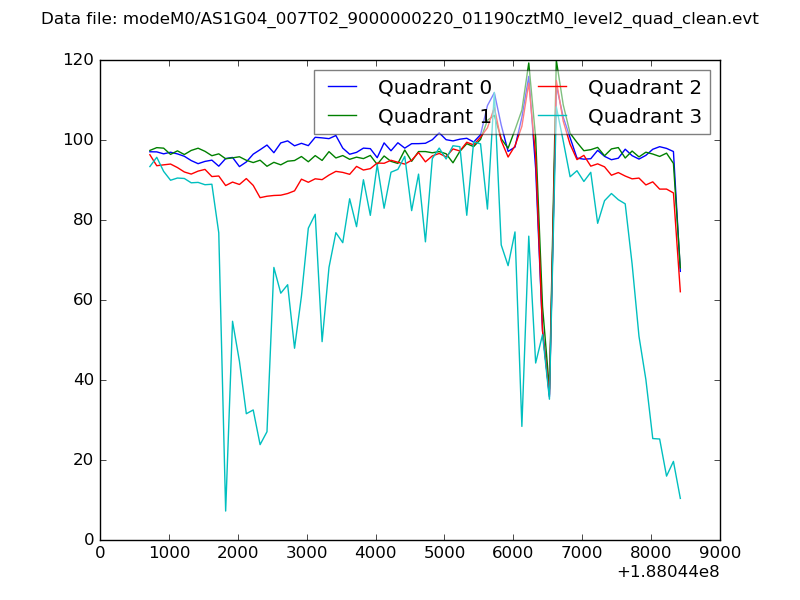 |
|
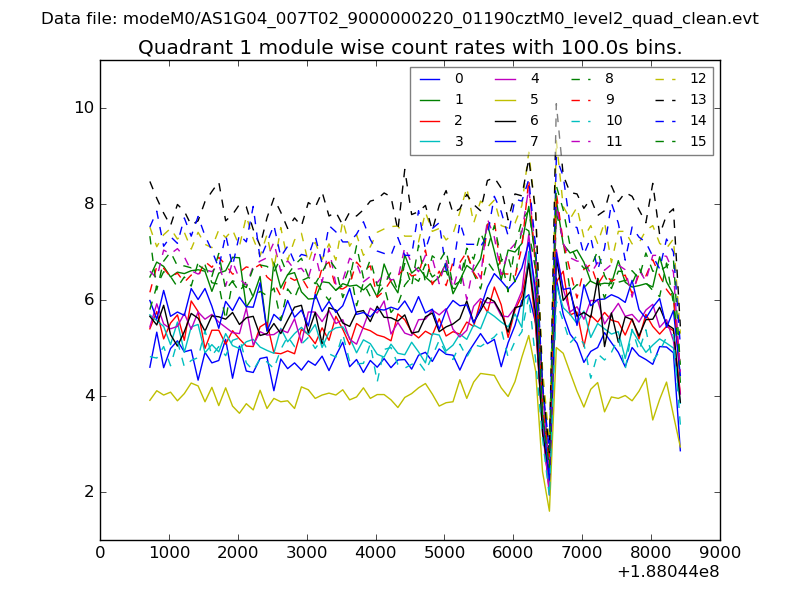
| Module-wise count rates for Quadrant A Data is divided into 100 sec bins |
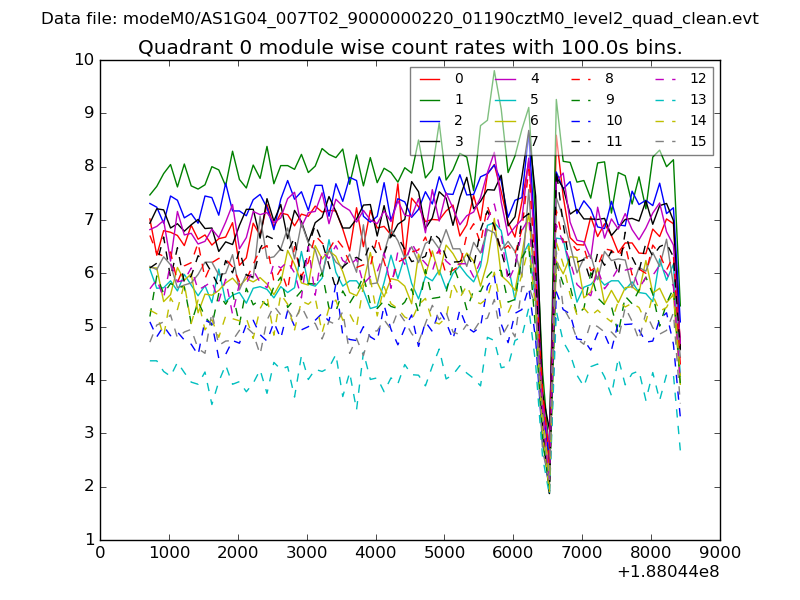 |
 |
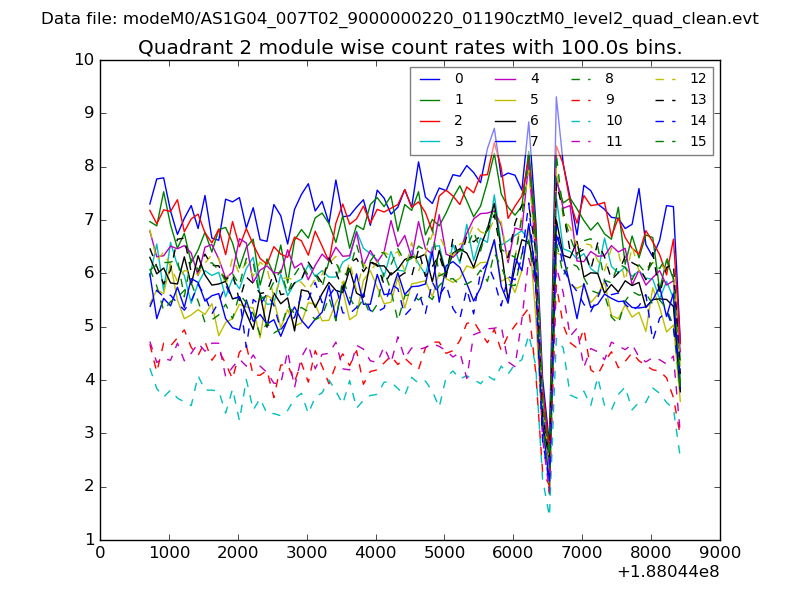
| Module-wise count rates for Quadrant B Data is divided into 100 sec bins |
 |
 |
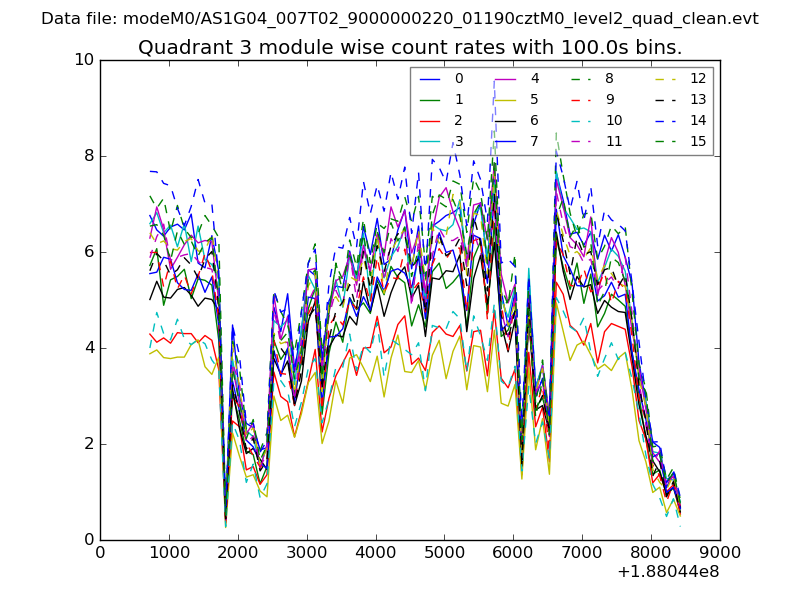
| Module-wise count rates for Quadrant C Data is divided into 100 sec bins |
 |
 |
| Module-wise count rates for Quadrant D Data is divided into 100 sec bins |
 |
 |
| Parameter | Plot |
|---|---|
| CZT HV Monitor | 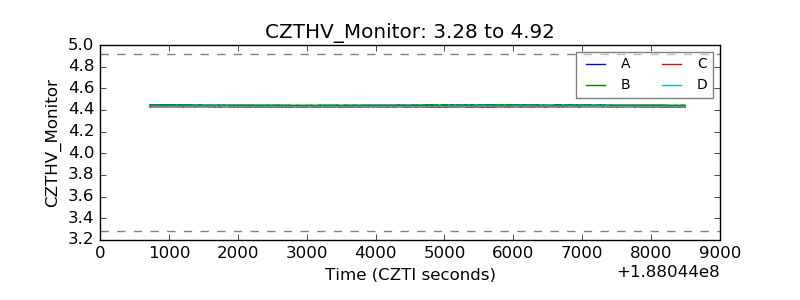 |
| D_VDD | 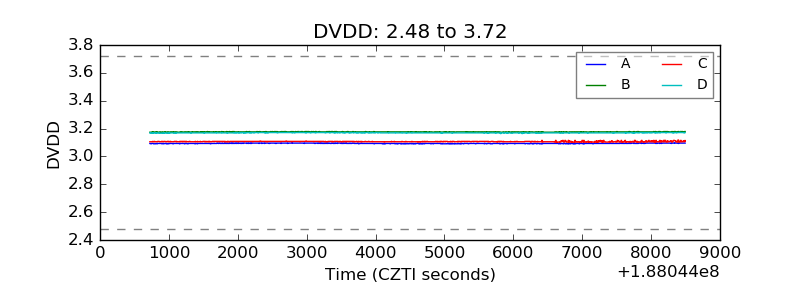 |
| Temperature 1 | 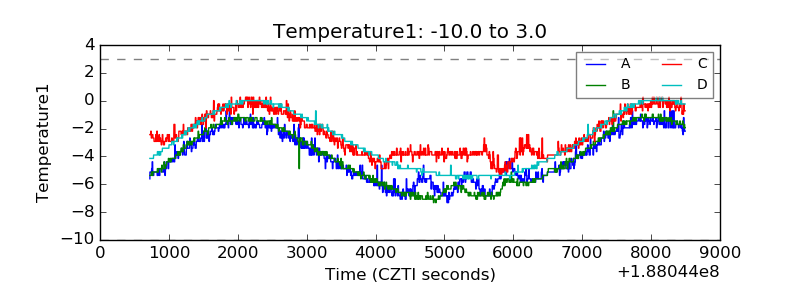 |
| Veto HV Monitor | 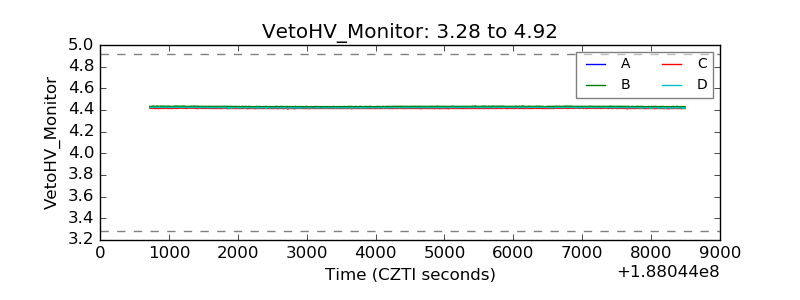 |
| Veto LLD | 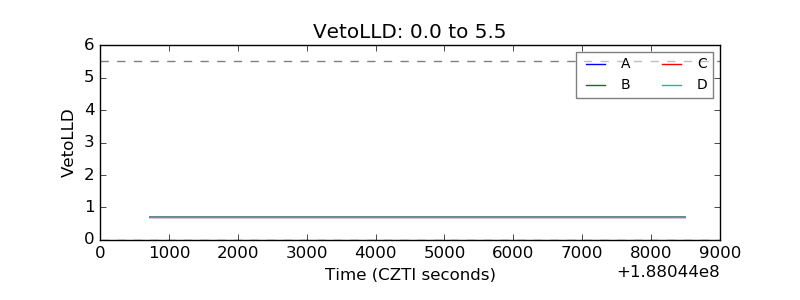 |
| Alpha Counter | 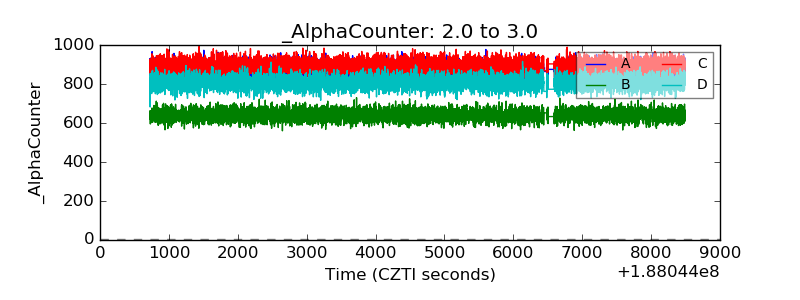 |
| _CPM_Rate | 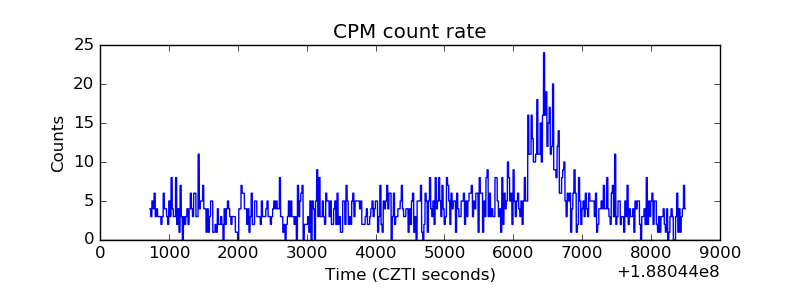 |
| CZT Counter | 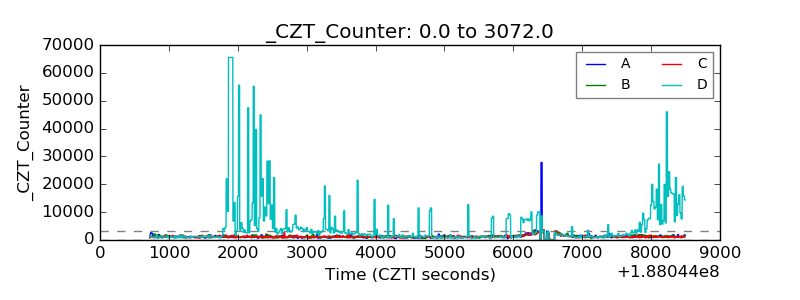 |
| +2.5 Volts monitor |  |
| +5 Volts monitor |  |
| _ROLL_ROT | 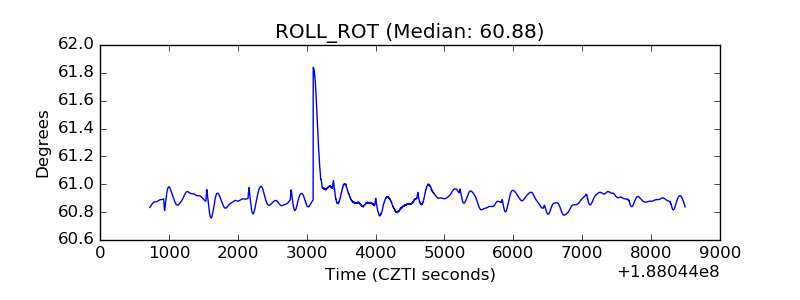 |
| _Roll_DEC | 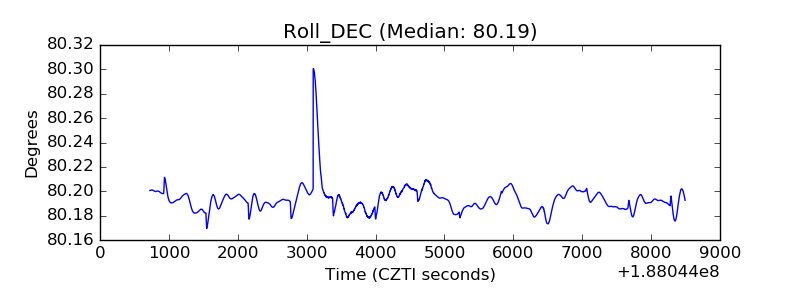 |
| _Roll_RA | 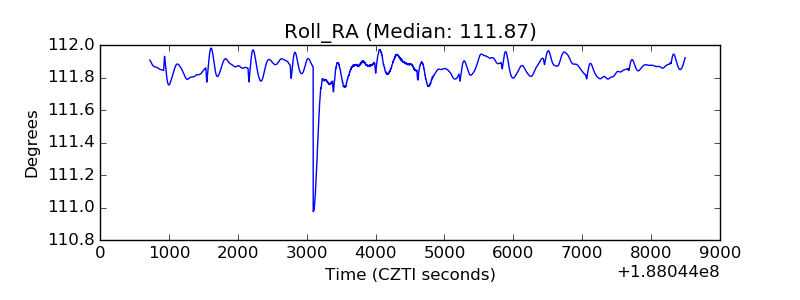 |
| Veto Counter | 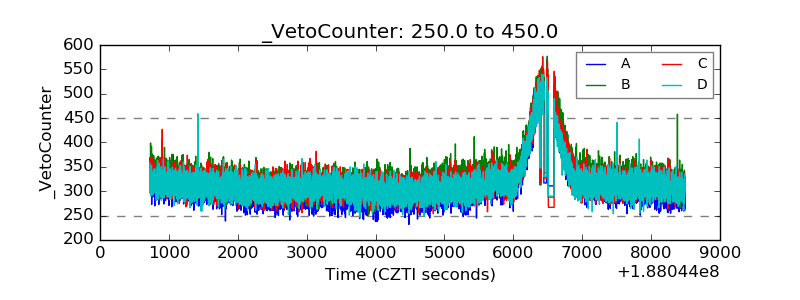 |