| Param | Original file | Final file |
|---|---|---|
| Filename | modeM0/AS1G04_007T02_9000000220_01191cztM0_level2.evt | modeM0/AS1G04_007T02_9000000220_01191cztM0_level2_quad_clean.evt |
| Size (bytes) | 1,314,777,600 | 103,662,720 |
| Size | 1.2 GB | 98.9 MB |
| Events in quadrant A | 8,764,307 | 710,564 |
| Events in quadrant B | 9,755,768 | 678,394 |
| Events in quadrant C | 8,753,286 | 675,637 |
| Events in quadrant D | 12,066,909 | 570,751 |
| Mode M0 | |||
|---|---|---|---|
| Quadrant | BADHDUFLAG | Total packets | Discarded packets |
| A | 0 | 31157 | 1 |
| B | 0 | 34169 | 0 |
| C | 0 | 31094 | 0 |
| D | 0 | 41243 | 0 |
| Mode SS | |||
|---|---|---|---|
| Quadrant | BADHDUFLAG | Total packets | Discarded packets |
| A | 0 | 144 | 0 |
| B | 0 | 144 | 0 |
| C | 0 | 144 | 0 |
| D | 0 | 144 | 0 |
| Quadrant | Total seconds | Saturated seconds | Saturation percentage |
|---|---|---|---|
| A | 7231 | 7 | 0.096805% |
| B | 7231 | 402 | 5.559397% |
| C | 7231 | 5 | 0.069147% |
| D | 7231 | 1488 | 20.578067% |
Noise dominated data is calculated using 1-second bins in cleaned event files. If a bin has >2000 counts, and if more than 50% of those come from <1% of pixels, then it is considered to be noise-dominated and hence unusable.
| Quadrant | # 1 sec bins | Bins with >0 counts | Bins with >2000 counts | High rate bins dominated by noise | Noise dominated (total time) | Noise dominated (detector-on time) | Marked lightcurve |
|---|---|---|---|---|---|---|---|
| A | 7231 | 7231 | 296 | 296 | 4.09% | 4.09% | 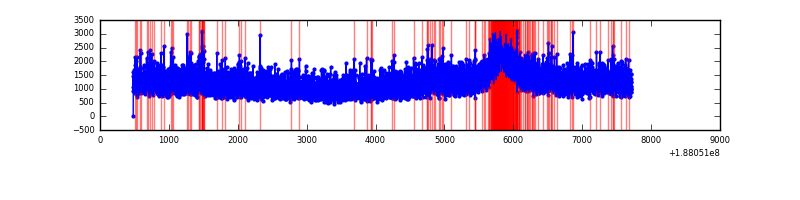 |
| B | 7231 | 7231 | 649 | 649 | 8.98% | 8.98% | 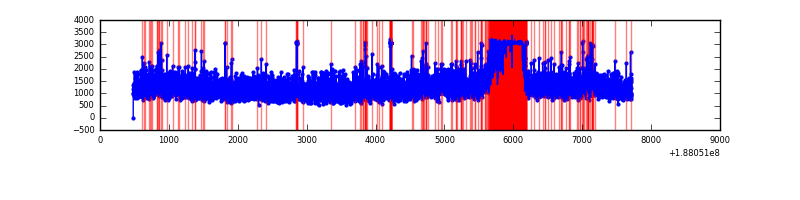 |
| C | 7231 | 7231 | 236 | 236 | 3.26% | 3.26% | 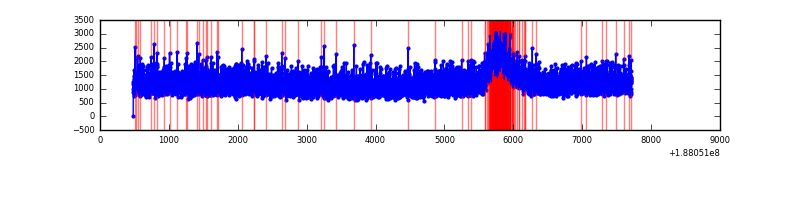 |
| D | 7231 | 7231 | 2048 | 2048 | 28.32% | 28.32% | 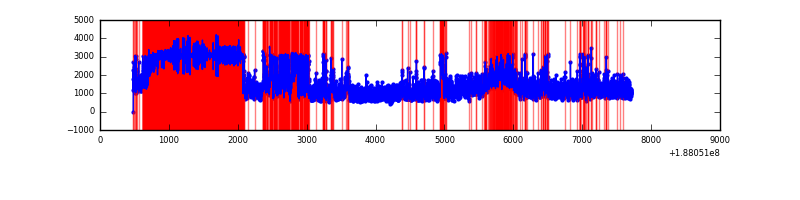 |
Top three noisy pixels from each quadrant. If the there are fewer than three noisy pixels in the level2.evt file, extra rows are filled as -1
| Pixel properties | Quadrant properties | ||||||
|---|---|---|---|---|---|---|---|
| Quadrant | DetID | PixID | Counts | Sigma | Mean | Median | Sigma |
| A | 4 | 32 | 82480 | 148.44 | 2255 | 2266 | 540.4 |
| A | 8 | 14 | 11792 | 17.63 | 2255 | 2266 | 540.4 |
| A | 12 | 243 | 11085 | 16.32 | 2255 | 2266 | 540.4 |
| B | 5 | 191 | 909172 | 1714.02 | 2241 | 2254 | 529.1 |
| B | 6 | 53 | 126437 | 234.7 | 2241 | 2254 | 529.1 |
| B | 12 | 52 | 36385 | 64.5 | 2241 | 2254 | 529.1 |
| C | 15 | 241 | 421369 | 709.01 | 2109 | 2182 | 591.2 |
| C | 3 | 79 | 54555 | 88.58 | 2109 | 2182 | 591.2 |
| C | 3 | 111 | 41460 | 66.43 | 2109 | 2182 | 591.2 |
| D | 1 | 239 | 3169264 | 5624.25 | 1805 | 1869 | 563.2 |
| D | 10 | 84 | 1839840 | 3263.63 | 1805 | 1869 | 563.2 |
| D | 2 | 16 | 87988 | 152.92 | 1805 | 1869 | 563.2 |
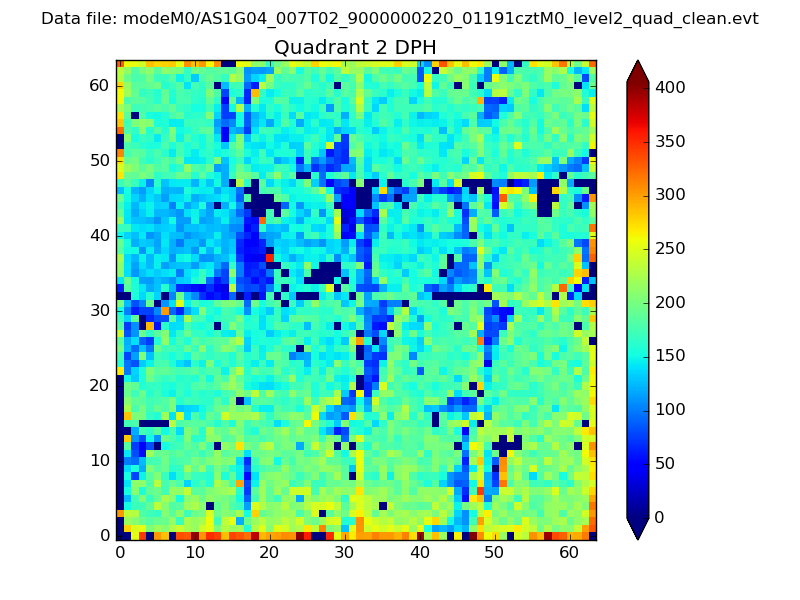
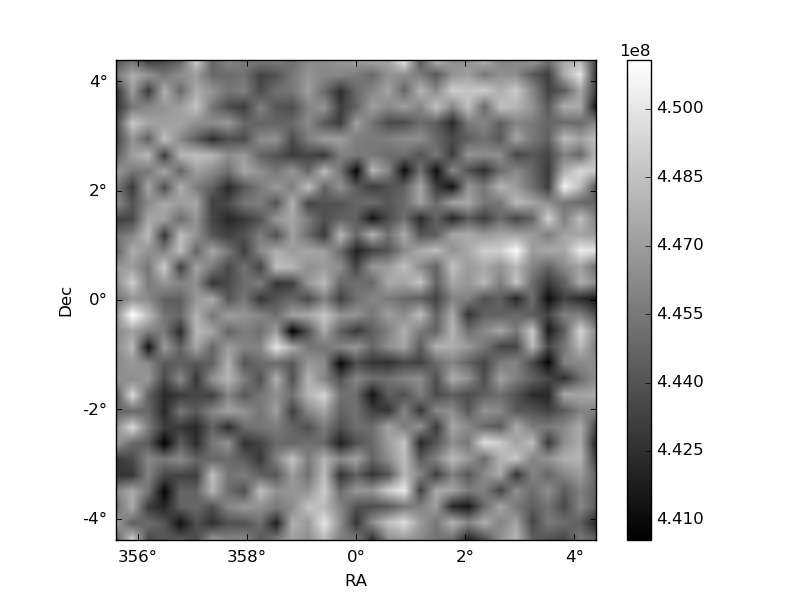
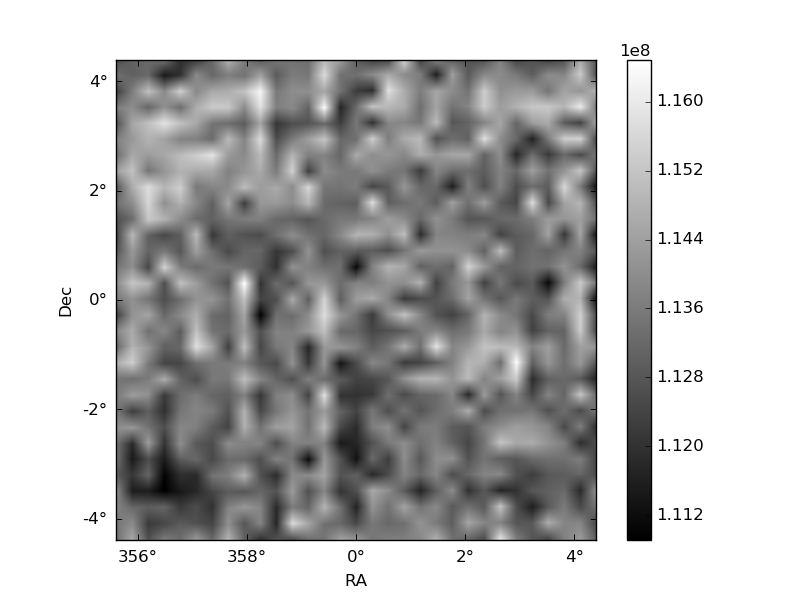
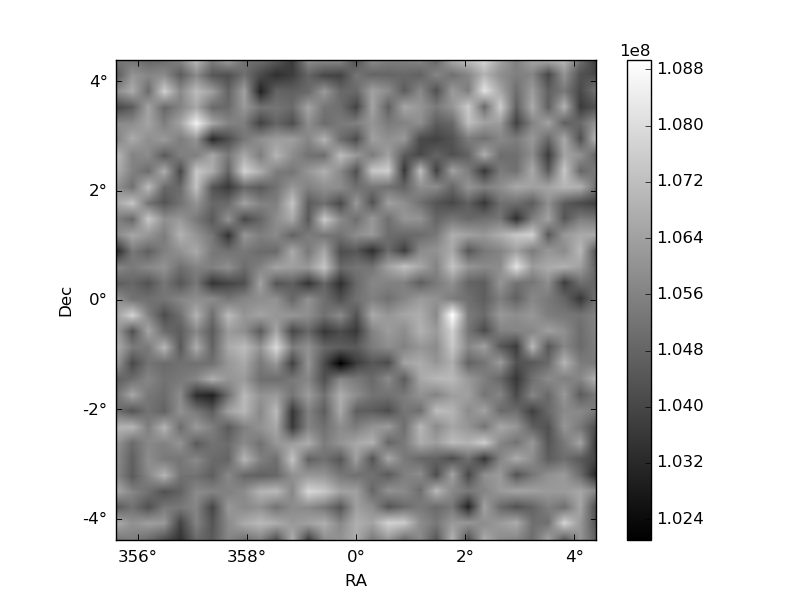
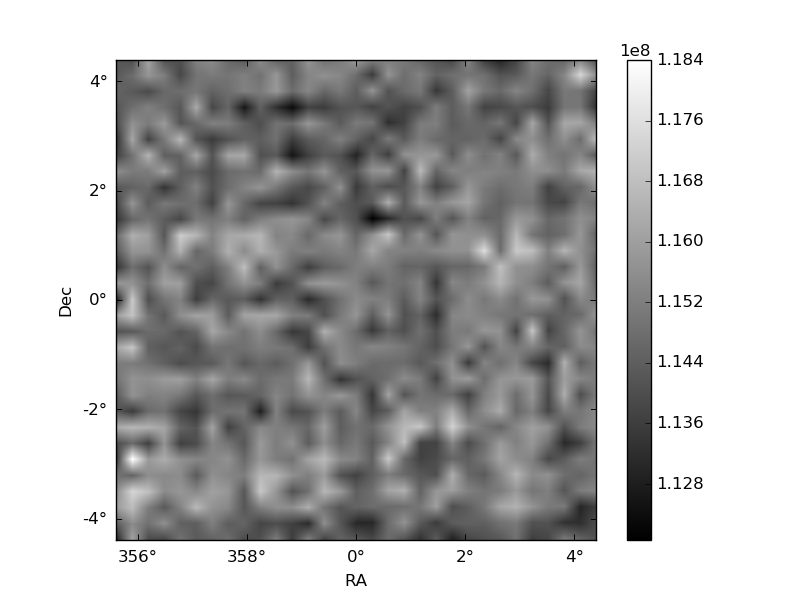
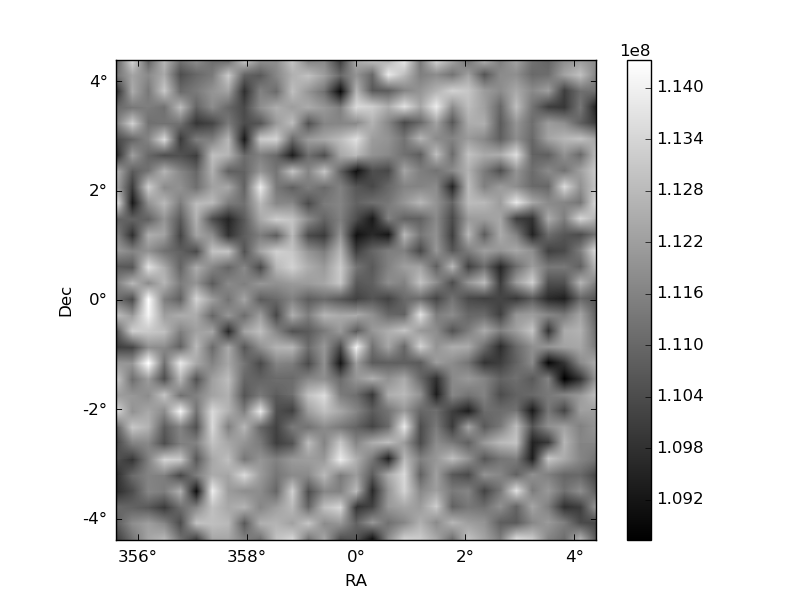
Histogram calculated using DETX and DETY for each event in the final _common_clean file
| Quadrant A | 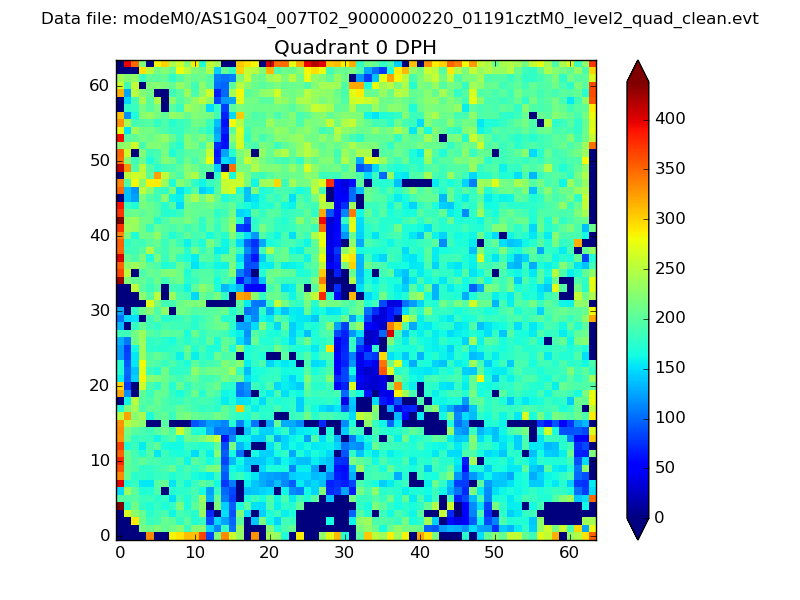 |
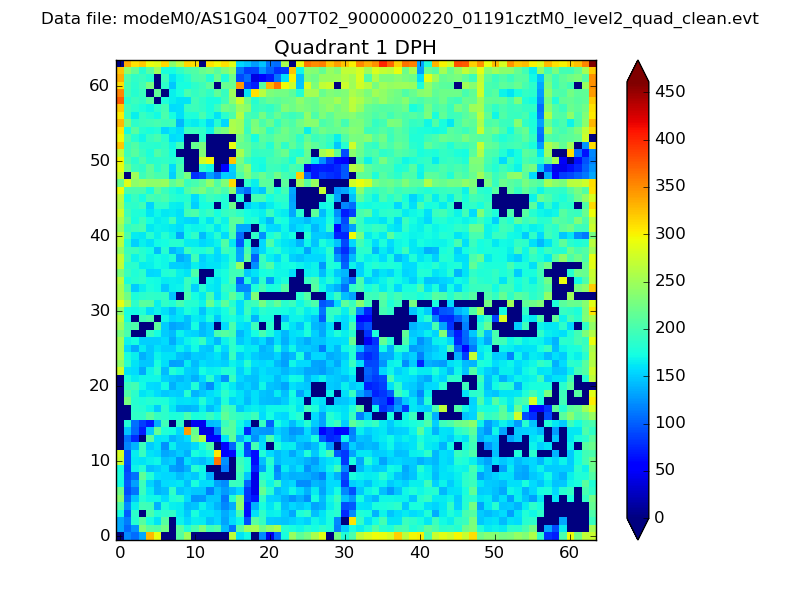 |
Quadrant B |
|---|---|---|---|
| Quadrant D | 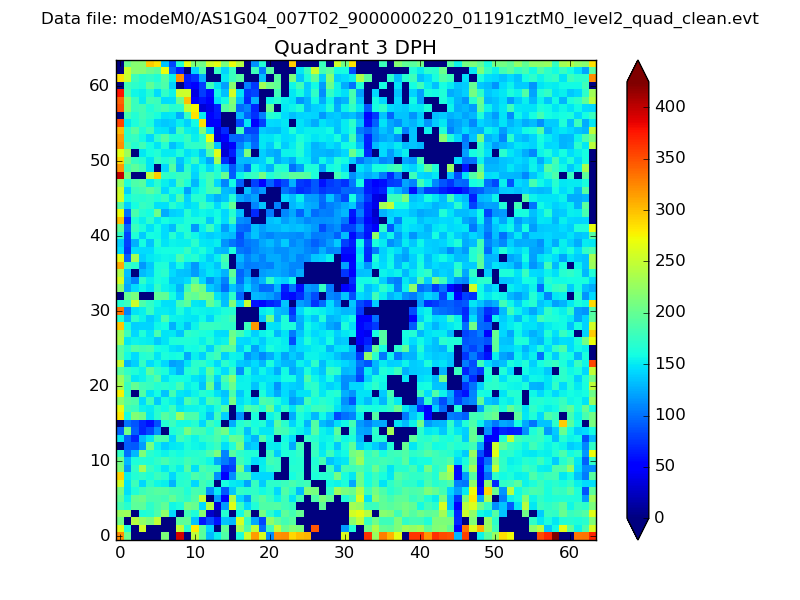 |
 |
Quadrant C |
| Plot type | Count rate plots | Images |
|---|---|---|
| Comparison with Poisson distribution Blue bars denote a histogram of data divided into 1 sec bins. Red curve is a Poisson curve with rate = median count rate of data. |
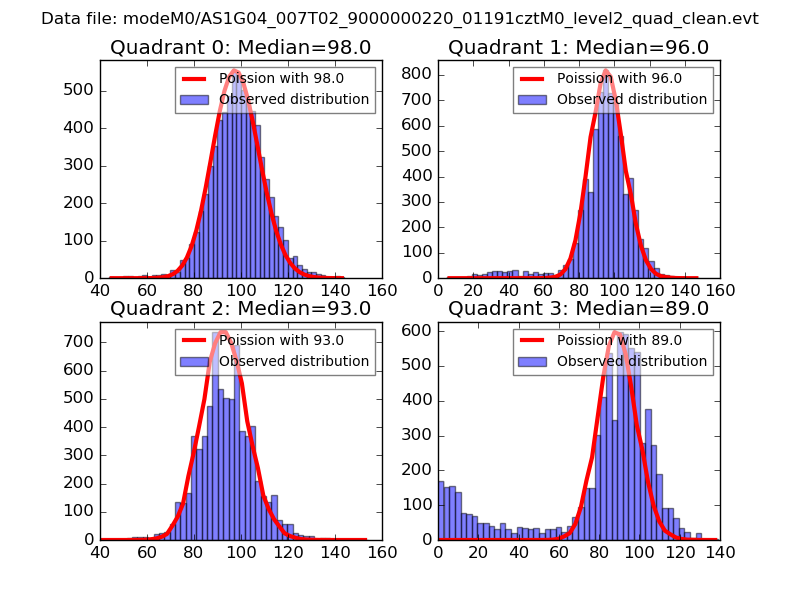 |
 |
| Quadrant-wise count rates Data is divided into 100 sec bins |
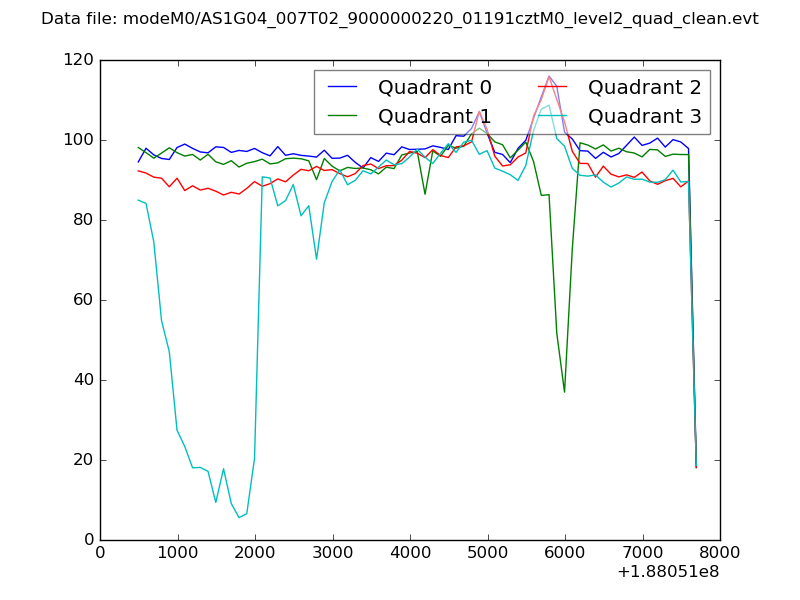 |
|
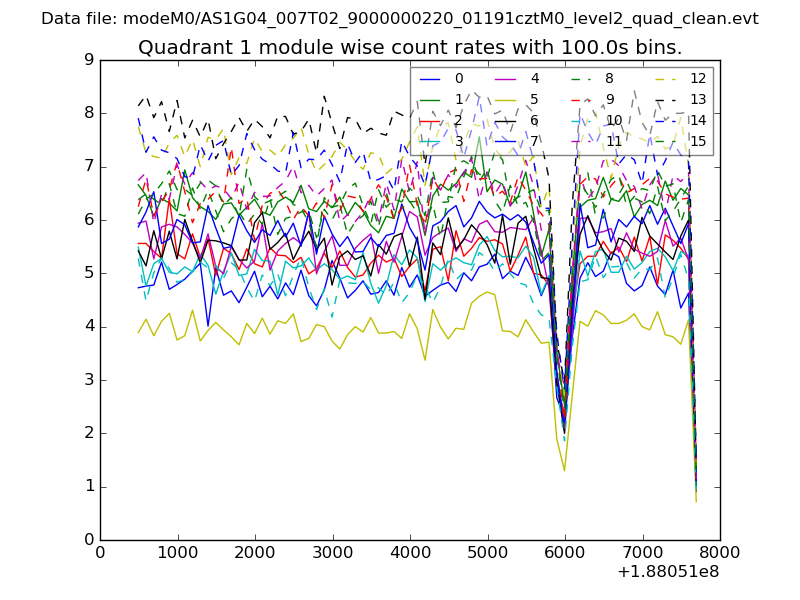
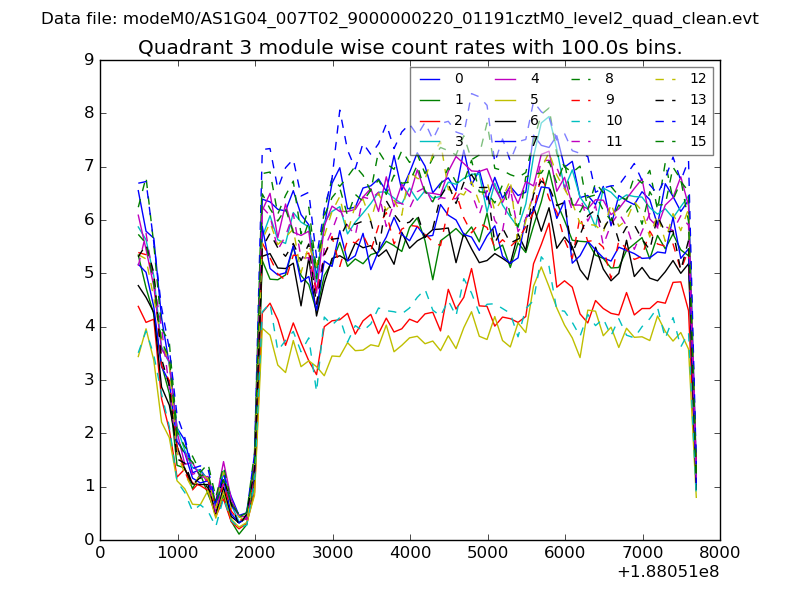
| Module-wise count rates for Quadrant A Data is divided into 100 sec bins |
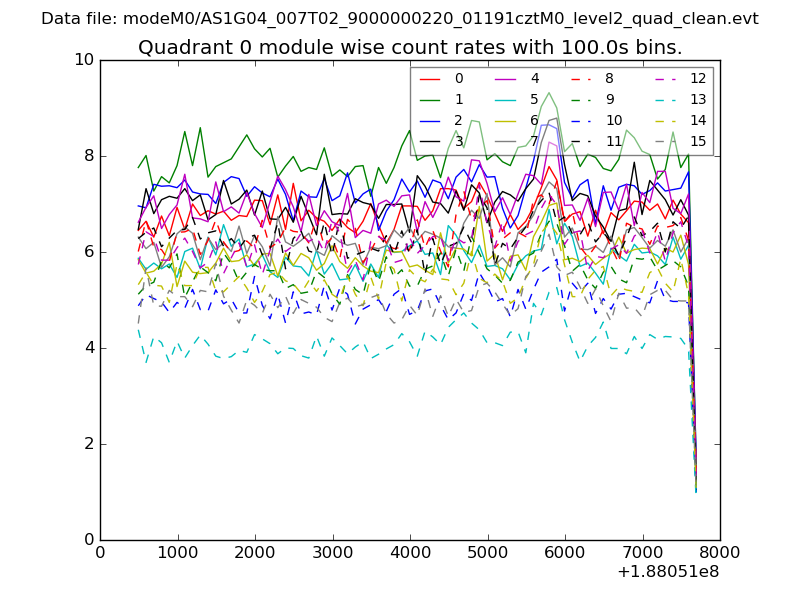 |
 |
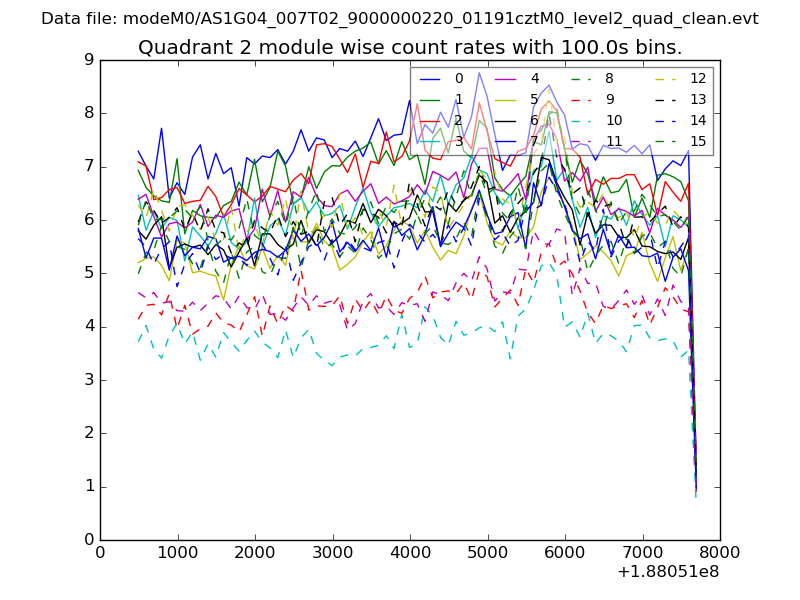
| Module-wise count rates for Quadrant B Data is divided into 100 sec bins |
 |
 |
| Module-wise count rates for Quadrant C Data is divided into 100 sec bins |
 |
 |
| Module-wise count rates for Quadrant D Data is divided into 100 sec bins |
 |
 |
| Parameter | Plot |
|---|---|
| CZT HV Monitor | 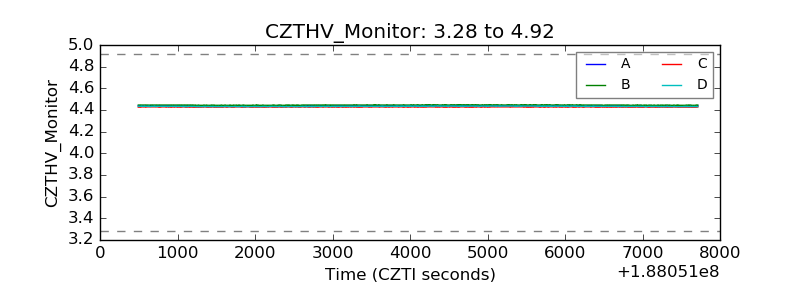 |
| D_VDD | 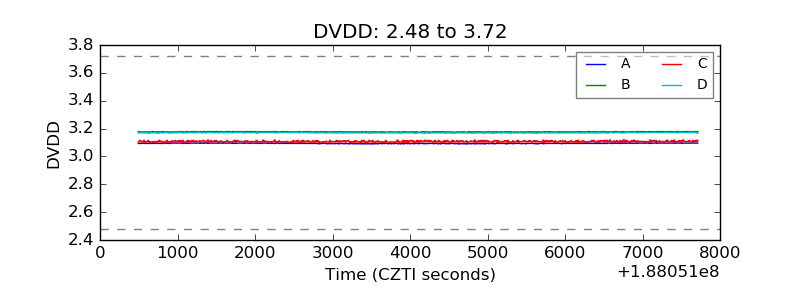 |
| Temperature 1 | 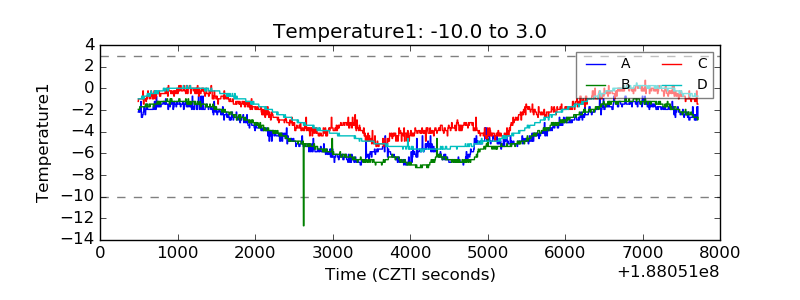 |
| Veto HV Monitor | 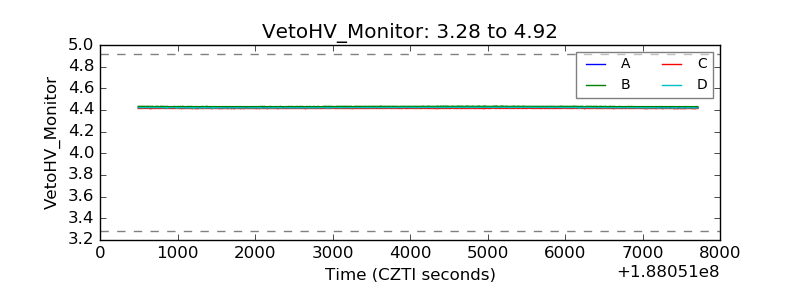 |
| Veto LLD | 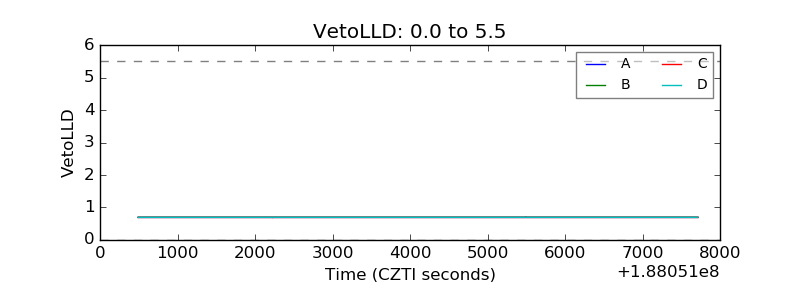 |
| Alpha Counter | 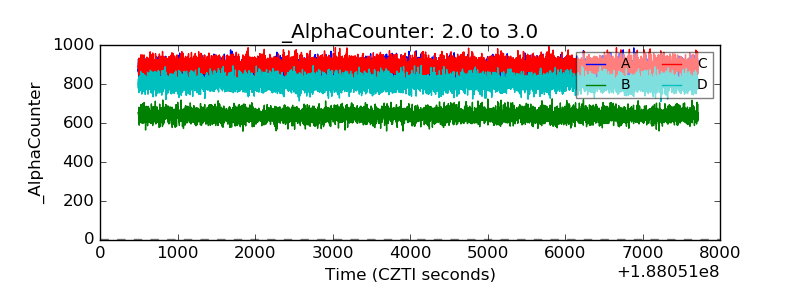 |
| _CPM_Rate | 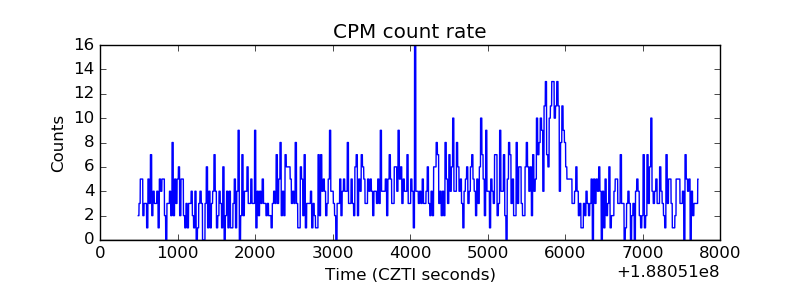 |
| CZT Counter | 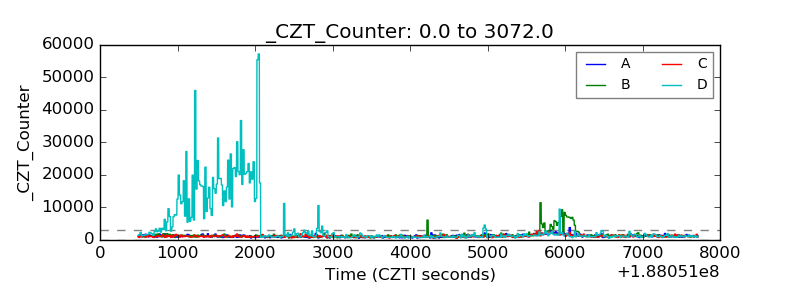 |
| +2.5 Volts monitor | 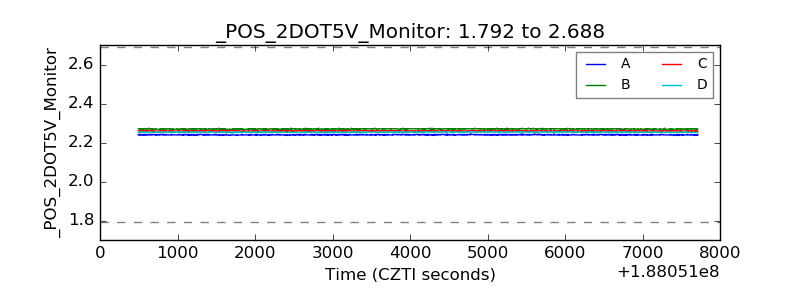 |
| +5 Volts monitor | 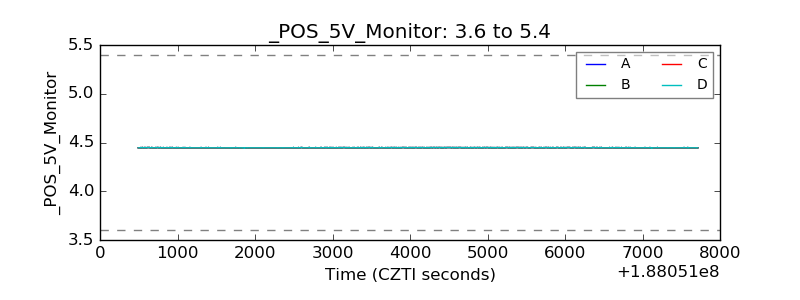 |
| _ROLL_ROT | 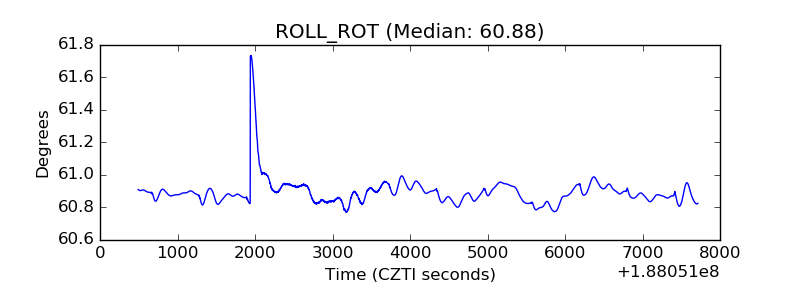 |
| _Roll_DEC | 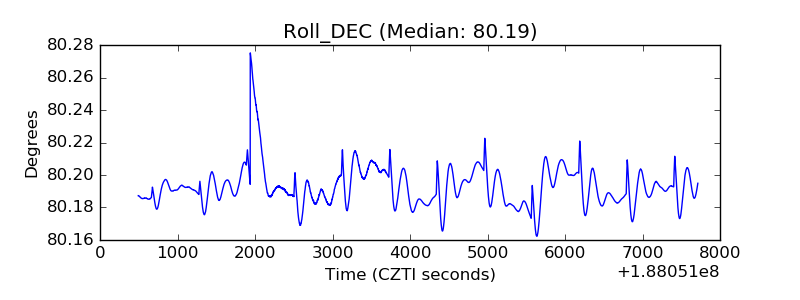 |
| _Roll_RA |  |
| Veto Counter | 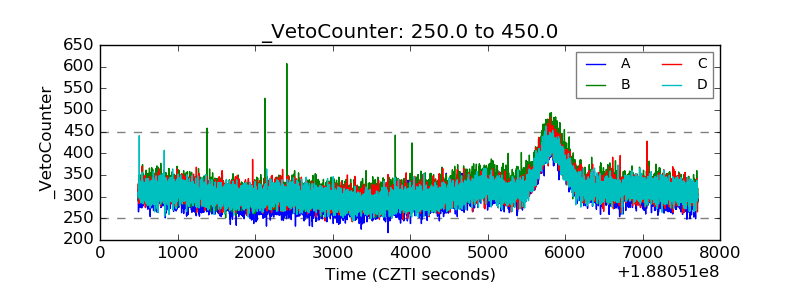 |