| Param | Original file | Final file |
|---|---|---|
| Filename | modeM0/AS1G04_007T02_9000000220_01192cztM0_level2.evt | modeM0/AS1G04_007T02_9000000220_01192cztM0_level2_quad_clean.evt |
| Size (bytes) | 1,189,238,400 | 104,152,320 |
| Size | 1.1 GB | 99.3 MB |
| Events in quadrant A | 8,832,744 | 688,217 |
| Events in quadrant B | 8,993,456 | 680,114 |
| Events in quadrant C | 8,556,889 | 655,965 |
| Events in quadrant D | 9,169,443 | 641,654 |
| Mode M9 | |||
|---|---|---|---|
| Quadrant | BADHDUFLAG | Total packets | Discarded packets |
| A | 0 | 1 | 0 |
| B | 0 | 1 | 0 |
| C | 0 | 1 | 0 |
| D | 0 | 1 | 0 |
| Mode M0 | |||
|---|---|---|---|
| Quadrant | BADHDUFLAG | Total packets | Discarded packets |
| A | 0 | 31190 | 3 |
| B | 0 | 31716 | 2 |
| C | 0 | 30443 | 2 |
| D | 0 | 32279 | 2 |
| Mode SS | |||
|---|---|---|---|
| Quadrant | BADHDUFLAG | Total packets | Discarded packets |
| A | 0 | 144 | 0 |
| B | 0 | 144 | 0 |
| C | 0 | 144 | 0 |
| D | 0 | 144 | 0 |
| Quadrant | Total seconds | Saturated seconds | Saturation percentage |
|---|---|---|---|
| A | 7005 | 32 | 0.456817% |
| B | 7005 | 21 | 0.299786% |
| C | 7005 | 8 | 0.114204% |
| D | 7005 | 256 | 3.654532% |
Noise dominated data is calculated using 1-second bins in cleaned event files. If a bin has >2000 counts, and if more than 50% of those come from <1% of pixels, then it is considered to be noise-dominated and hence unusable.
| Quadrant | # 1 sec bins | Bins with >0 counts | Bins with >2000 counts | High rate bins dominated by noise | Noise dominated (total time) | Noise dominated (detector-on time) | Marked lightcurve |
|---|---|---|---|---|---|---|---|
| A | 7130 | 7005 | 449 | 449 | 6.30% | 6.41% | 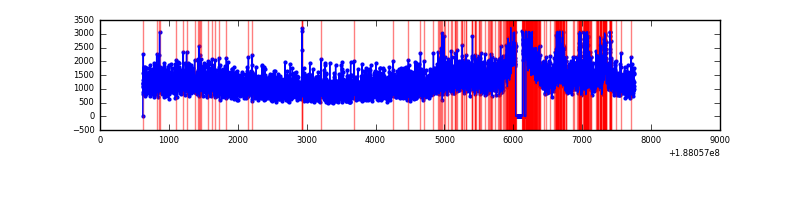 |
| B | 7130 | 7005 | 416 | 416 | 5.83% | 5.94% | 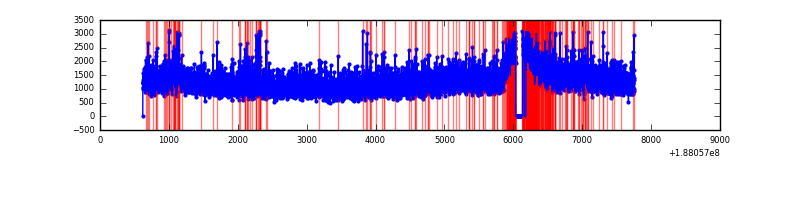 |
| C | 7130 | 7007 | 242 | 242 | 3.39% | 3.45% | 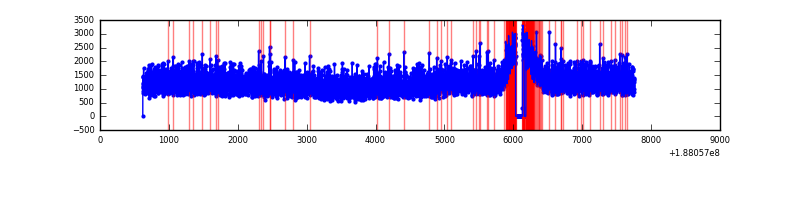 |
| D | 7130 | 7007 | 726 | 726 | 10.18% | 10.36% | 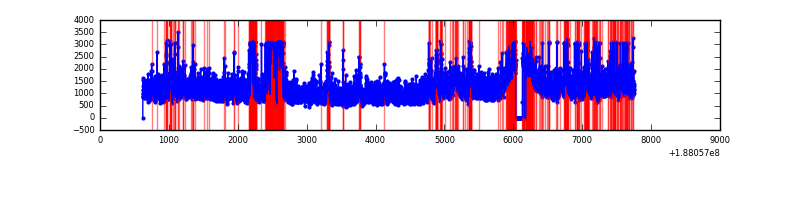 |
Top three noisy pixels from each quadrant. If the there are fewer than three noisy pixels in the level2.evt file, extra rows are filled as -1
| Pixel properties | Quadrant properties | ||||||
|---|---|---|---|---|---|---|---|
| Quadrant | DetID | PixID | Counts | Sigma | Mean | Median | Sigma |
| A | 4 | 32 | 382377 | 723.17 | 2180 | 2193 | 525.7 |
| A | 8 | 14 | 58142 | 106.42 | 2180 | 2193 | 525.7 |
| A | 15 | 223 | 7823 | 10.71 | 2180 | 2193 | 525.7 |
| B | 6 | 53 | 157543 | 288.56 | 2259 | 2268 | 538.1 |
| B | 5 | 191 | 41756 | 73.38 | 2259 | 2268 | 538.1 |
| B | 8 | 219 | 37976 | 66.36 | 2259 | 2268 | 538.1 |
| C | 15 | 241 | 406834 | 699.59 | 2062 | 2131 | 578.5 |
| C | 3 | 79 | 55305 | 91.92 | 2062 | 2131 | 578.5 |
| C | 3 | 111 | 39707 | 64.96 | 2062 | 2131 | 578.5 |
| D | 10 | 84 | 1131382 | 1809.4 | 2004 | 2069 | 624.1 |
| D | 12 | 22 | 267757 | 425.69 | 2004 | 2069 | 624.1 |
| D | 1 | 239 | 91766 | 143.71 | 2004 | 2069 | 624.1 |
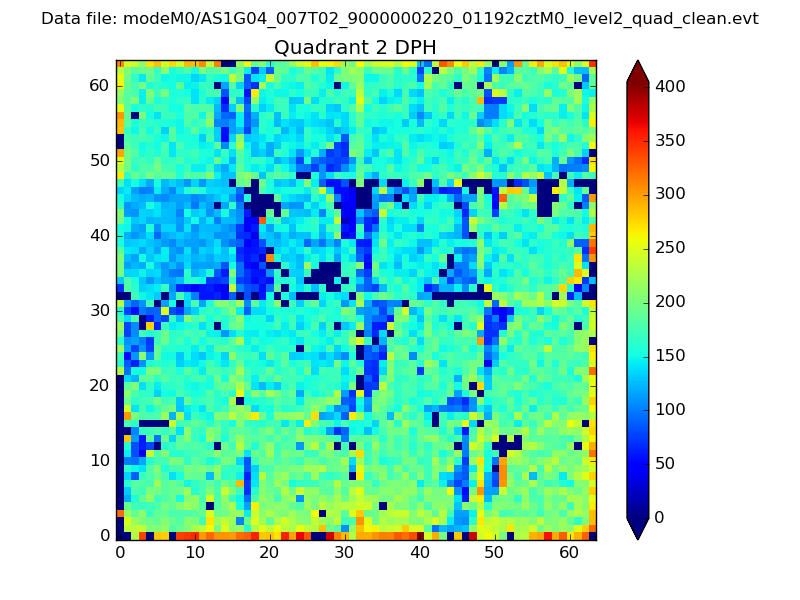
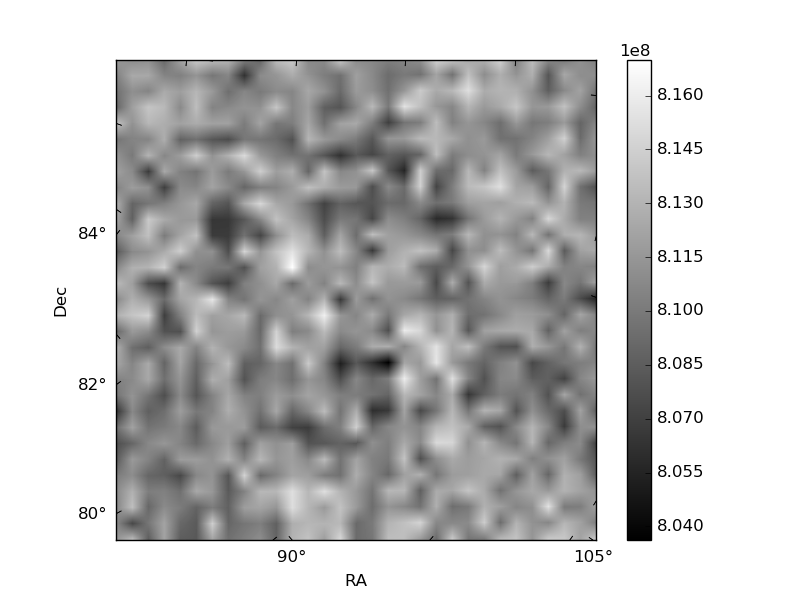
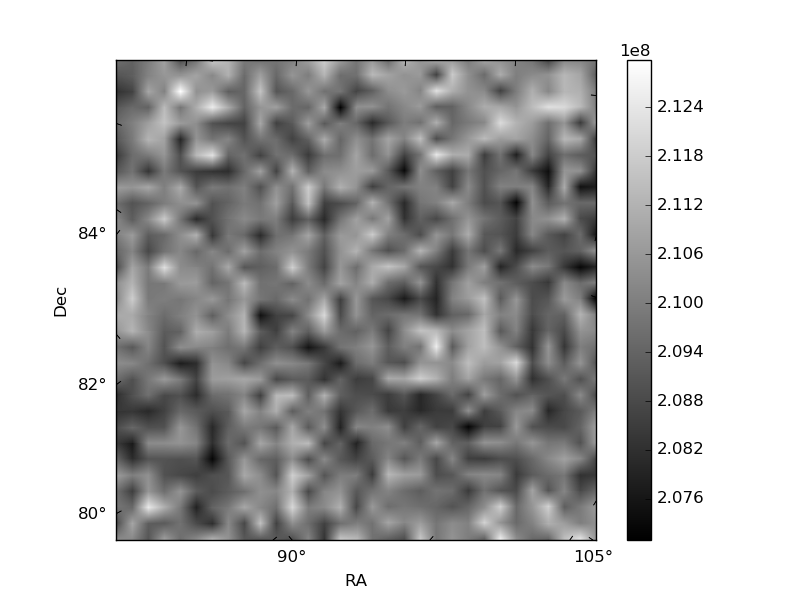
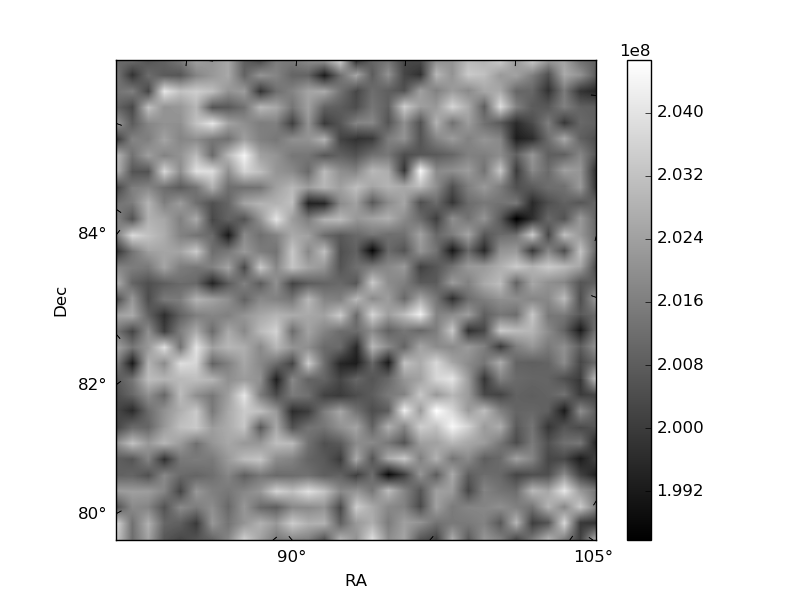
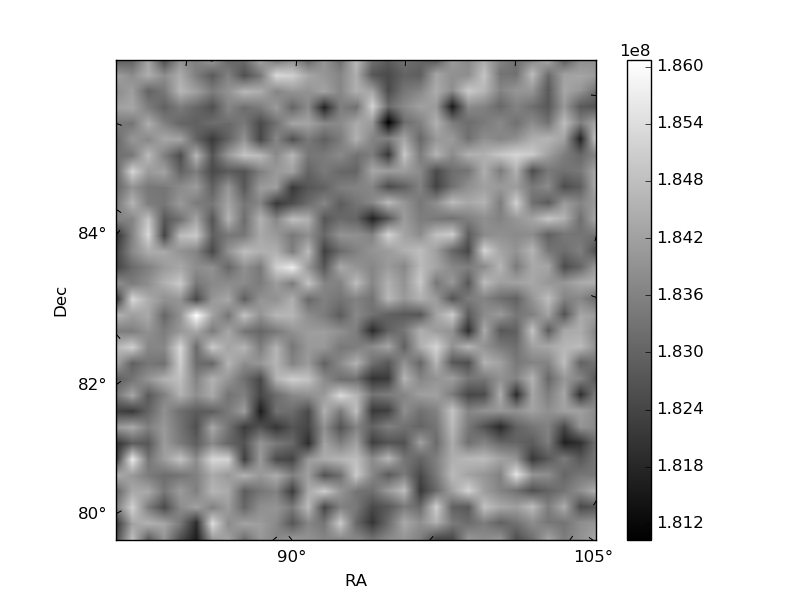
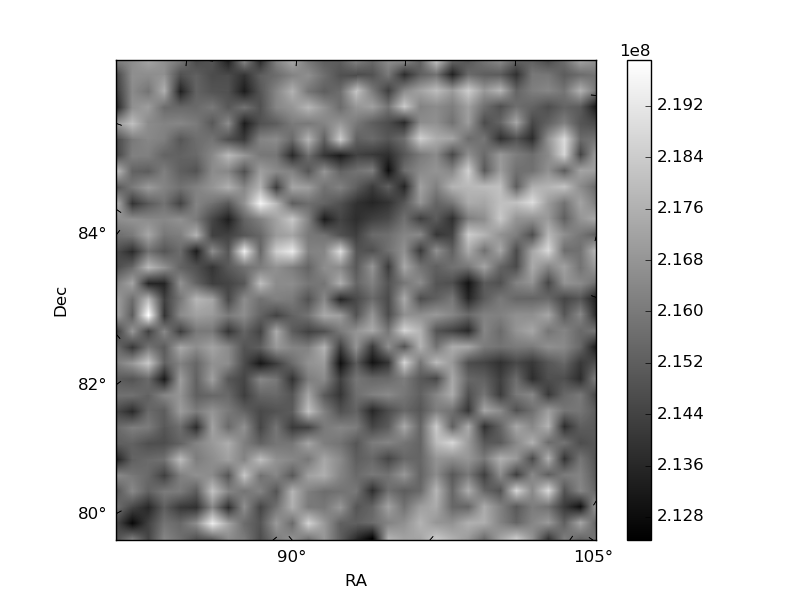
Histogram calculated using DETX and DETY for each event in the final _common_clean file
| Quadrant A | 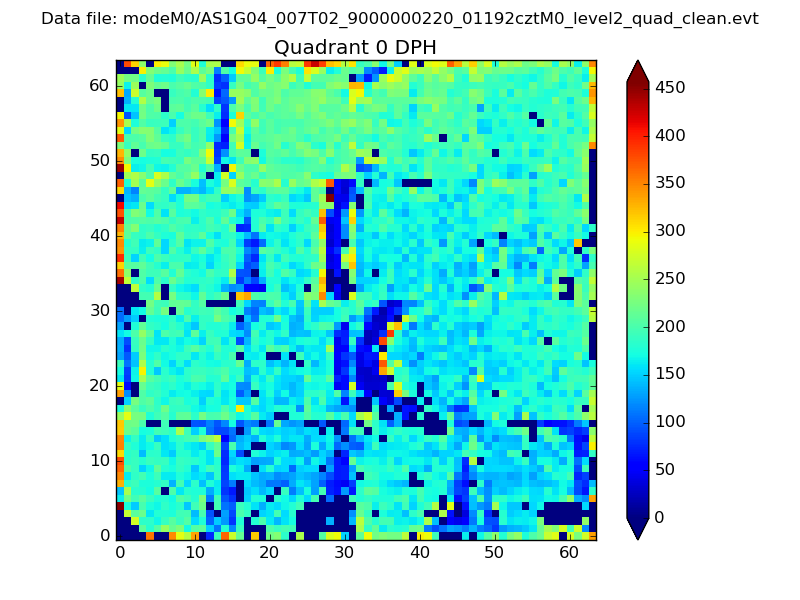 |
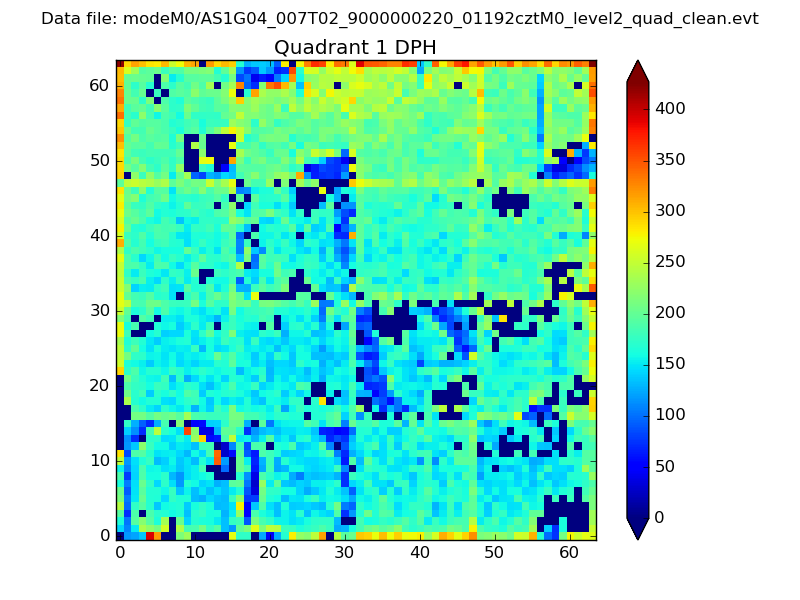 |
Quadrant B |
|---|---|---|---|
| Quadrant D | 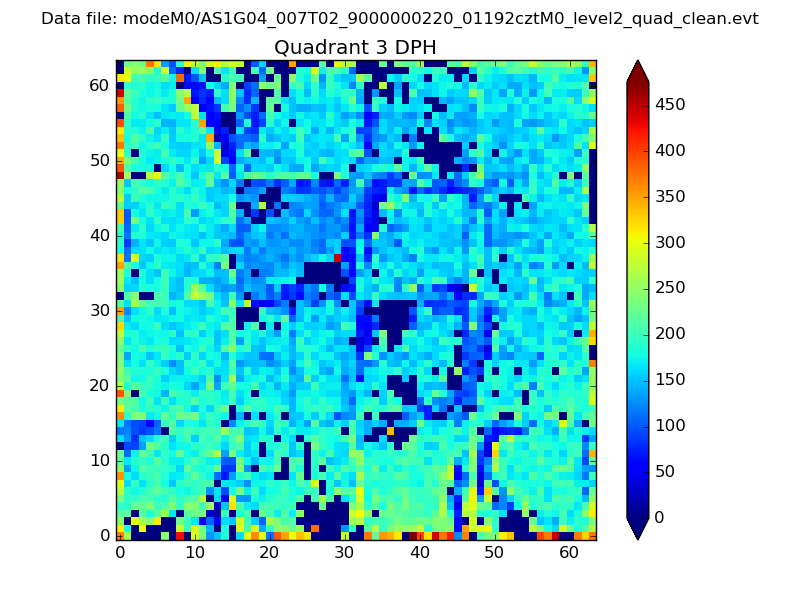 |
 |
Quadrant C |
| Plot type | Count rate plots | Images |
|---|---|---|
| Comparison with Poisson distribution Blue bars denote a histogram of data divided into 1 sec bins. Red curve is a Poisson curve with rate = median count rate of data. |
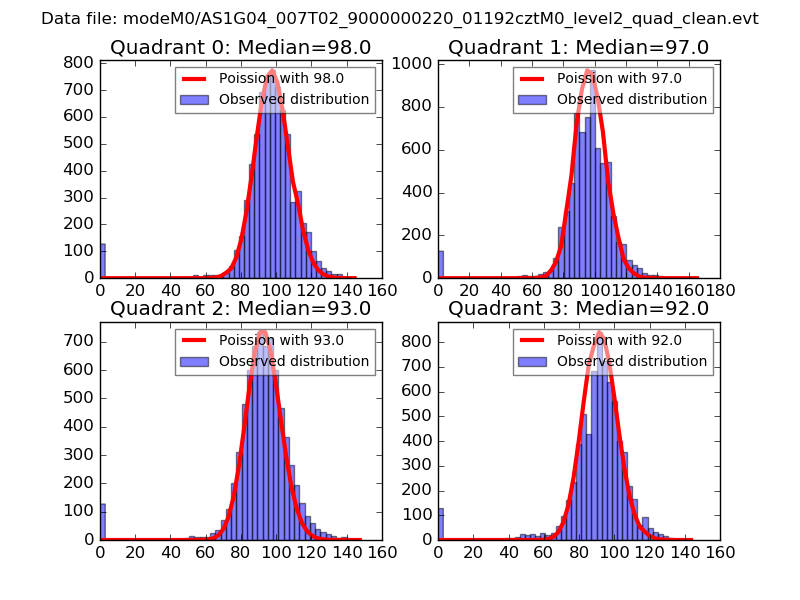 |
 |
| Quadrant-wise count rates Data is divided into 100 sec bins |
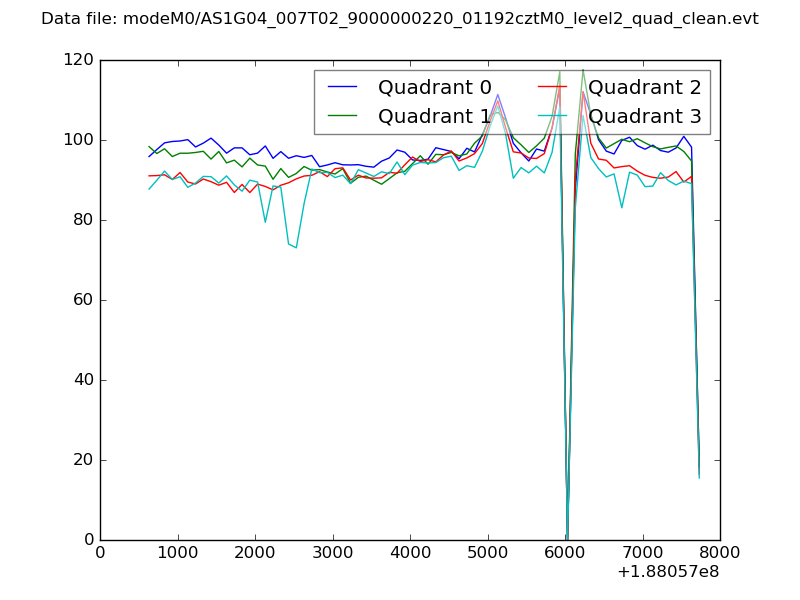 |
|
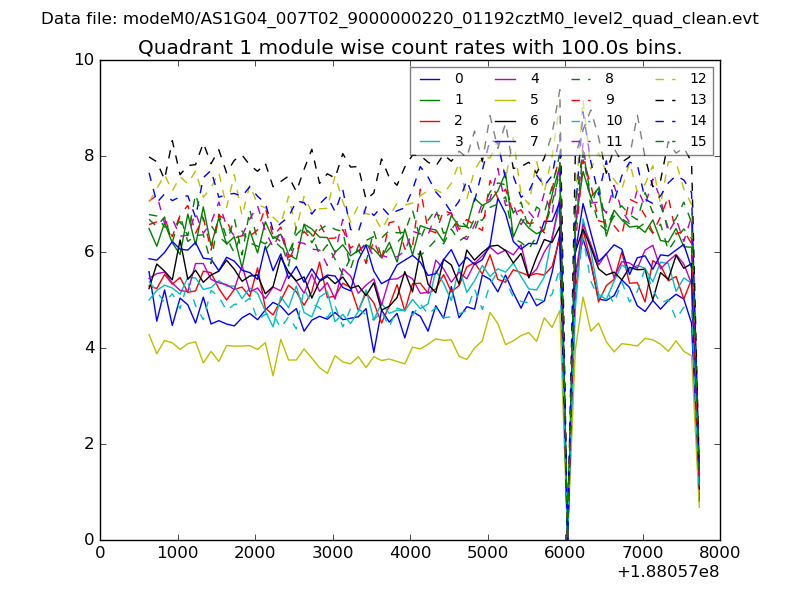
| Module-wise count rates for Quadrant A Data is divided into 100 sec bins |
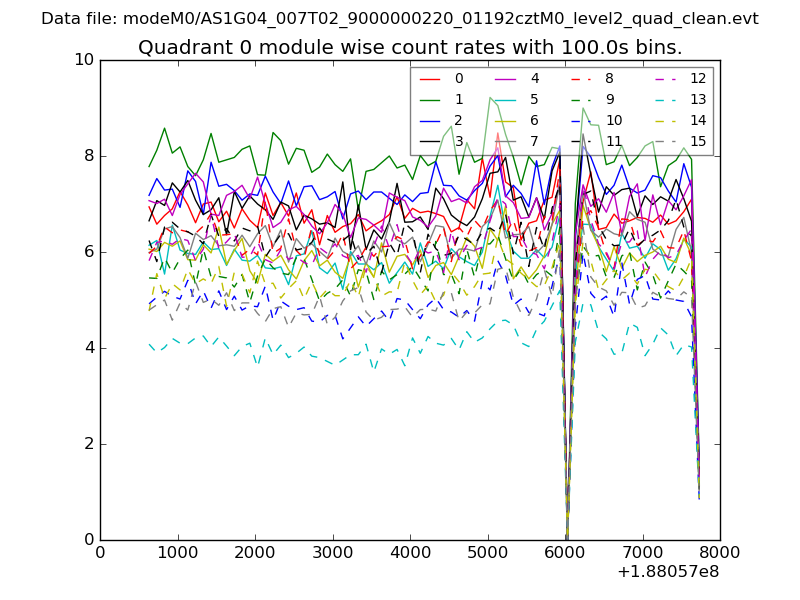 |
 |
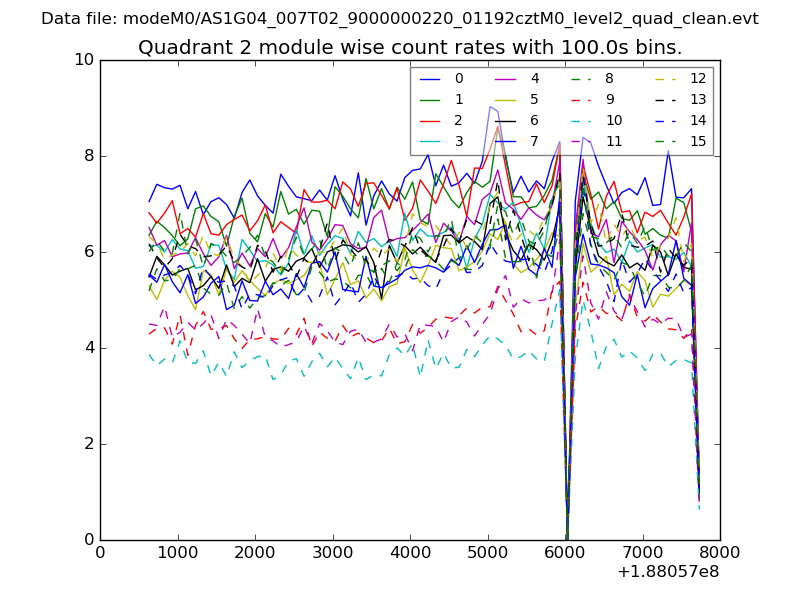
| Module-wise count rates for Quadrant B Data is divided into 100 sec bins |
 |
 |
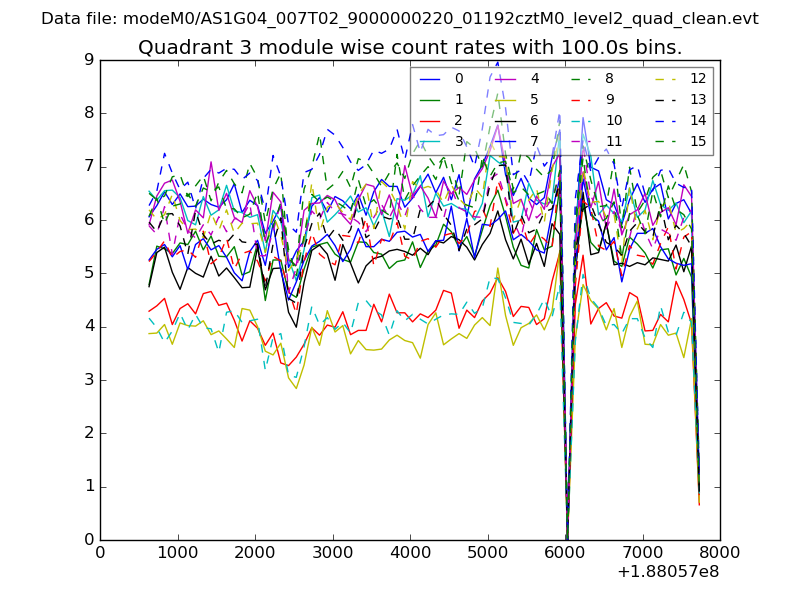
| Module-wise count rates for Quadrant C Data is divided into 100 sec bins |
 |
 |
| Module-wise count rates for Quadrant D Data is divided into 100 sec bins |
 |
 |
| Parameter | Plot |
|---|---|
| CZT HV Monitor | 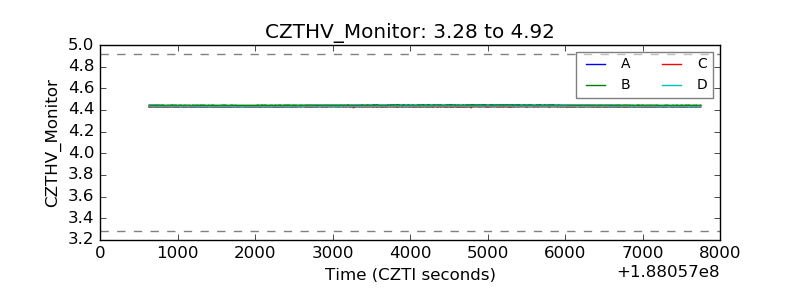 |
| D_VDD | 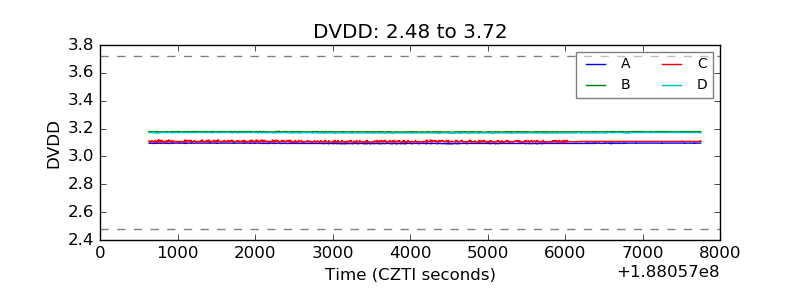 |
| Temperature 1 | 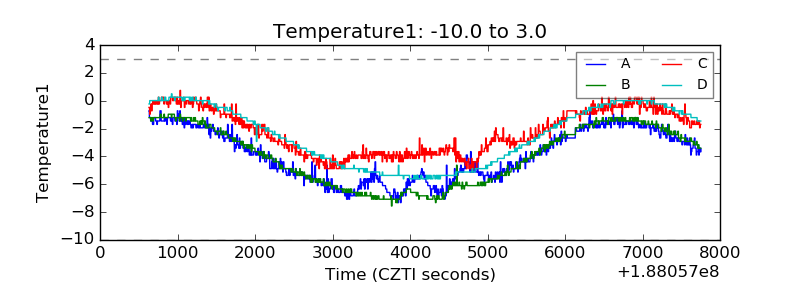 |
| Veto HV Monitor | 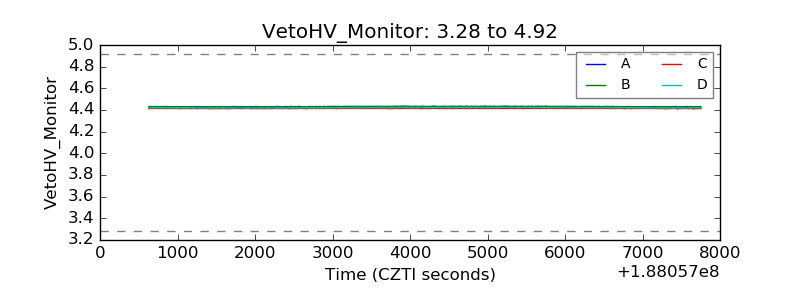 |
| Veto LLD |  |
| Alpha Counter | 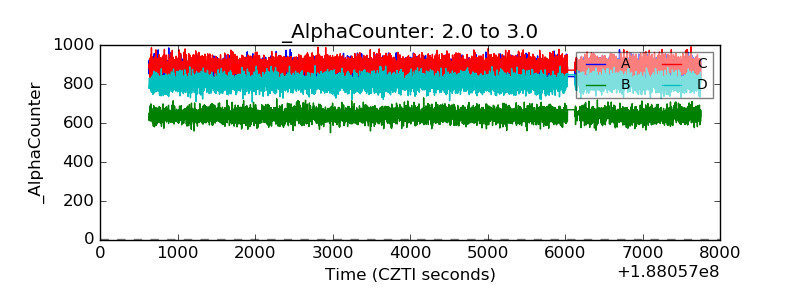 |
| _CPM_Rate | 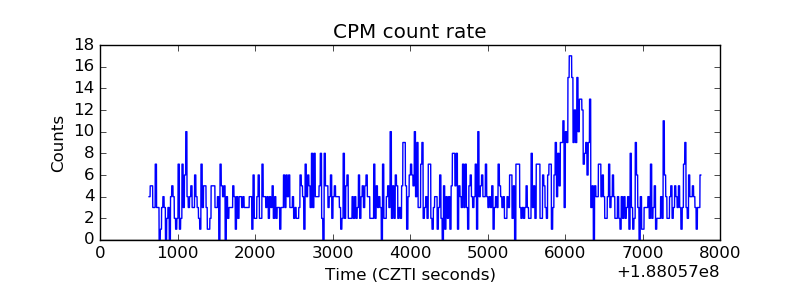 |
| CZT Counter |  |
| +2.5 Volts monitor |  |
| +5 Volts monitor |  |
| _ROLL_ROT | 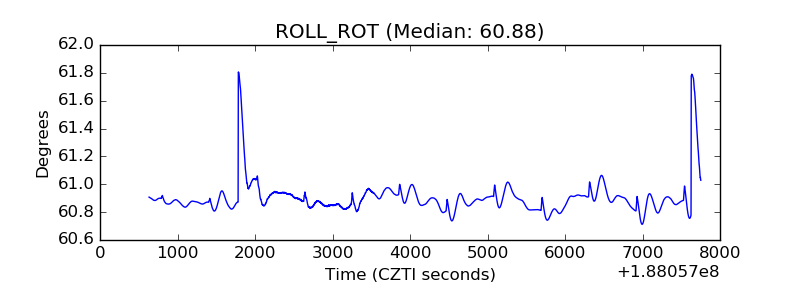 |
| _Roll_DEC | 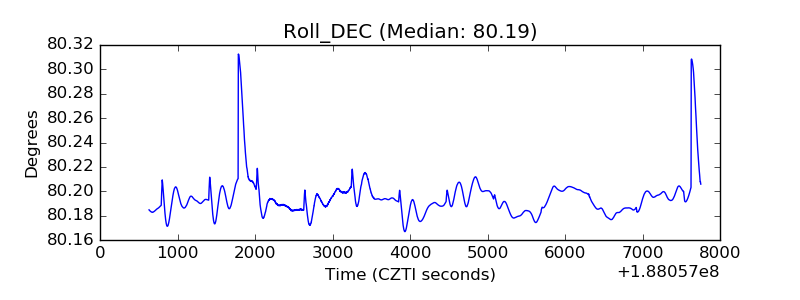 |
| _Roll_RA | 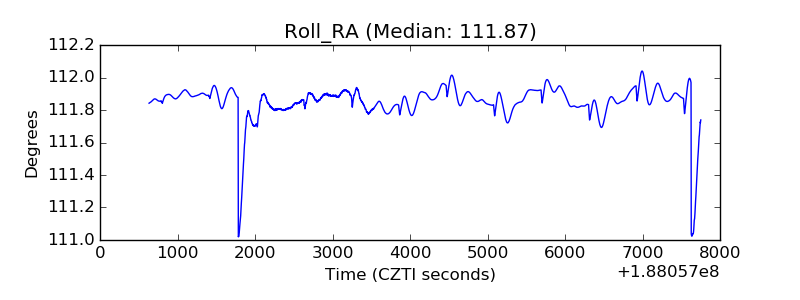 |
| Veto Counter | 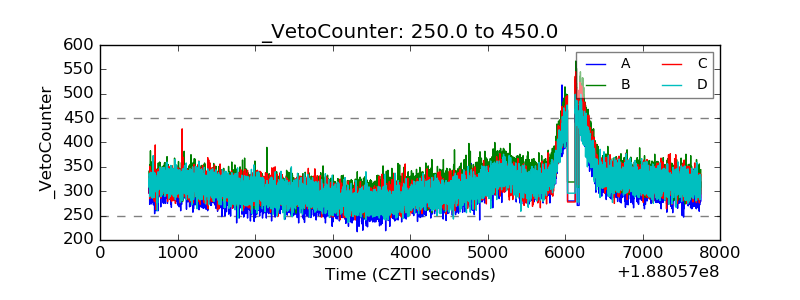 |