| Param | Original file | Final file |
|---|---|---|
| Filename | modeM0/AS1G04_007T02_9000000220_01194cztM0_level2.evt | modeM0/AS1G04_007T02_9000000220_01194cztM0_level2_quad_clean.evt |
| Size (bytes) | 1,199,779,200 | 103,898,880 |
| Size | 1.1 GB | 99.1 MB |
| Events in quadrant A | 8,237,856 | 688,969 |
| Events in quadrant B | 8,732,091 | 678,732 |
| Events in quadrant C | 8,514,137 | 660,018 |
| Events in quadrant D | 10,386,439 | 629,250 |
| Mode M9 | |||
|---|---|---|---|
| Quadrant | BADHDUFLAG | Total packets | Discarded packets |
| A | 0 | 6 | 0 |
| B | 0 | 6 | 0 |
| C | 0 | 6 | 0 |
| D | 0 | 6 | 0 |
| Mode M0 | |||
|---|---|---|---|
| Quadrant | BADHDUFLAG | Total packets | Discarded packets |
| A | 0 | 29437 | 2 |
| B | 0 | 30908 | 1 |
| C | 0 | 30270 | 1 |
| D | 0 | 35972 | 1 |
| Mode SS | |||
|---|---|---|---|
| Quadrant | BADHDUFLAG | Total packets | Discarded packets |
| A | 0 | 142 | 0 |
| B | 0 | 142 | 0 |
| C | 0 | 142 | 0 |
| D | 0 | 142 | 0 |
| Quadrant | Total seconds | Saturated seconds | Saturation percentage |
|---|---|---|---|
| A | 7026 | 4 | 0.056931% |
| B | 7026 | 18 | 0.256191% |
| C | 7026 | 6 | 0.085397% |
| D | 7026 | 778 | 11.073157% |
Noise dominated data is calculated using 1-second bins in cleaned event files. If a bin has >2000 counts, and if more than 50% of those come from <1% of pixels, then it is considered to be noise-dominated and hence unusable.
| Quadrant | # 1 sec bins | Bins with >0 counts | Bins with >2000 counts | High rate bins dominated by noise | Noise dominated (total time) | Noise dominated (detector-on time) | Marked lightcurve |
|---|---|---|---|---|---|---|---|
| A | 7646 | 7026 | 161 | 161 | 2.11% | 2.29% | 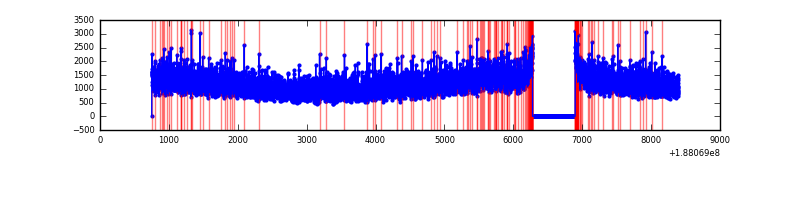 |
| B | 7646 | 7026 | 254 | 254 | 3.32% | 3.62% | 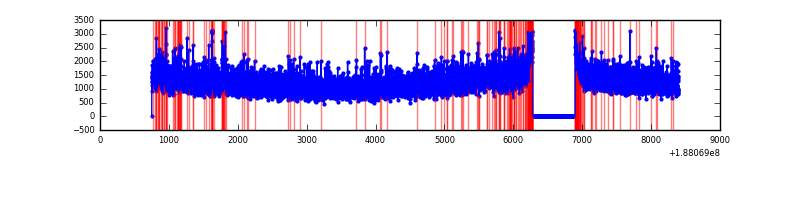 |
| C | 7645 | 7026 | 178 | 178 | 2.33% | 2.53% | 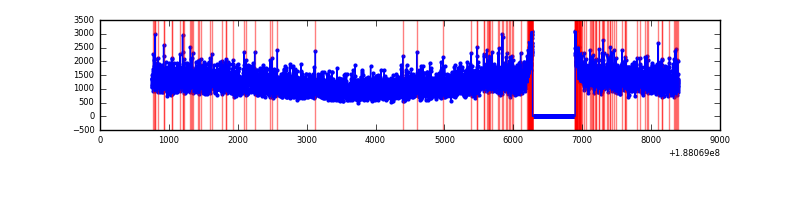 |
| D | 7646 | 7027 | 1600 | 1600 | 20.93% | 22.77% | 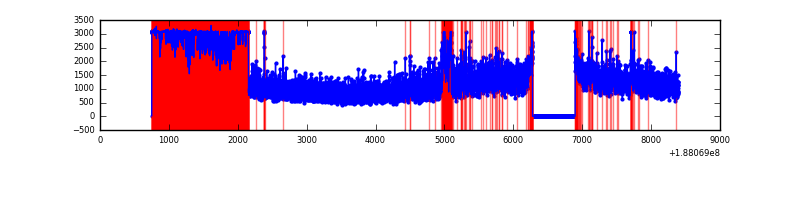 |
Top three noisy pixels from each quadrant. If the there are fewer than three noisy pixels in the level2.evt file, extra rows are filled as -1
| Pixel properties | Quadrant properties | ||||||
|---|---|---|---|---|---|---|---|
| Quadrant | DetID | PixID | Counts | Sigma | Mean | Median | Sigma |
| A | 4 | 32 | 19956 | 34.71 | 2133 | 2150 | 513.0 |
| A | 11 | 79 | 10320 | 15.92 | 2133 | 2150 | 513.0 |
| A | 13 | 9 | 8598 | 12.57 | 2133 | 2150 | 513.0 |
| B | 6 | 53 | 160823 | 302.26 | 2231 | 2242 | 524.6 |
| B | 10 | 244 | 20009 | 33.86 | 2231 | 2242 | 524.6 |
| B | 15 | 22 | 18490 | 30.97 | 2231 | 2242 | 524.6 |
| C | 15 | 241 | 389797 | 672.62 | 2061 | 2137 | 576.3 |
| C | 3 | 111 | 27931 | 44.75 | 2061 | 2137 | 576.3 |
| C | 3 | 79 | 25354 | 40.28 | 2061 | 2137 | 576.3 |
| D | 1 | 239 | 2600532 | 4296.85 | 1955 | 2028 | 604.7 |
| D | 10 | 85 | 224791 | 368.36 | 1955 | 2028 | 604.7 |
| D | 2 | 16 | 67441 | 108.17 | 1955 | 2028 | 604.7 |
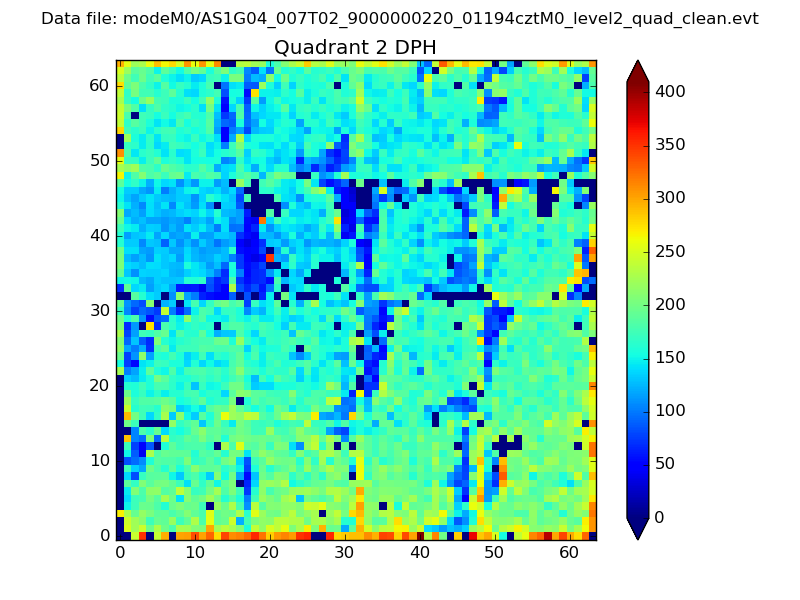
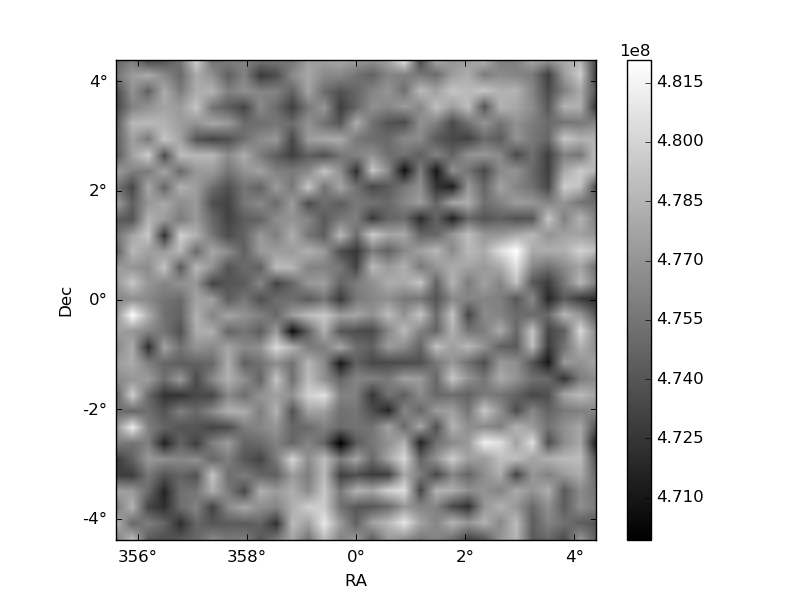
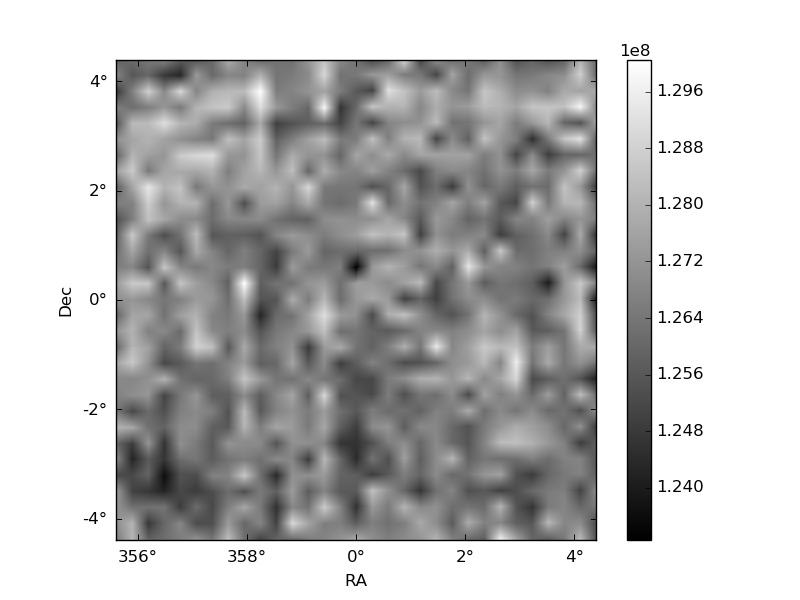
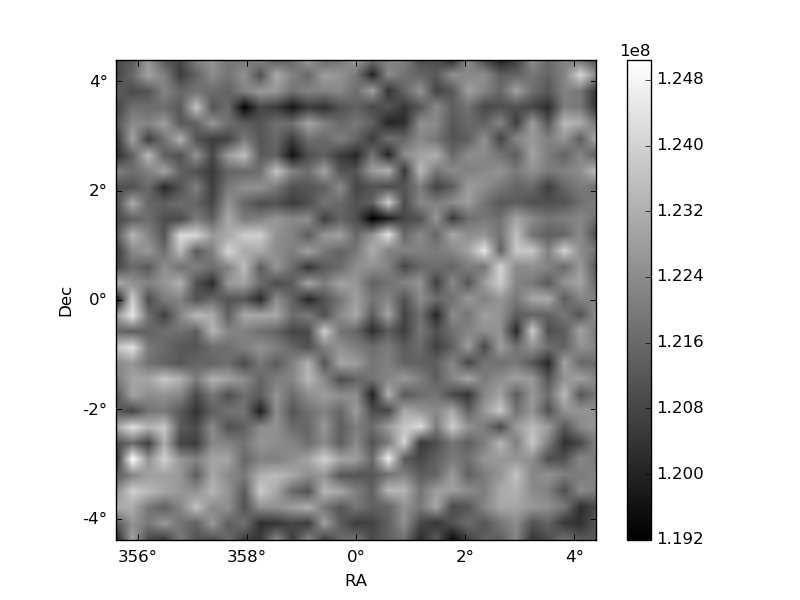
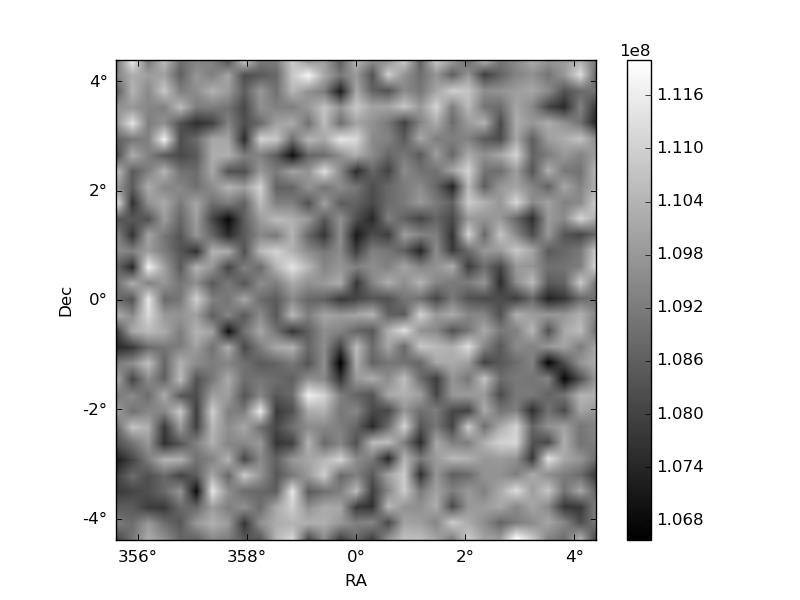
Histogram calculated using DETX and DETY for each event in the final _common_clean file
| Quadrant A | 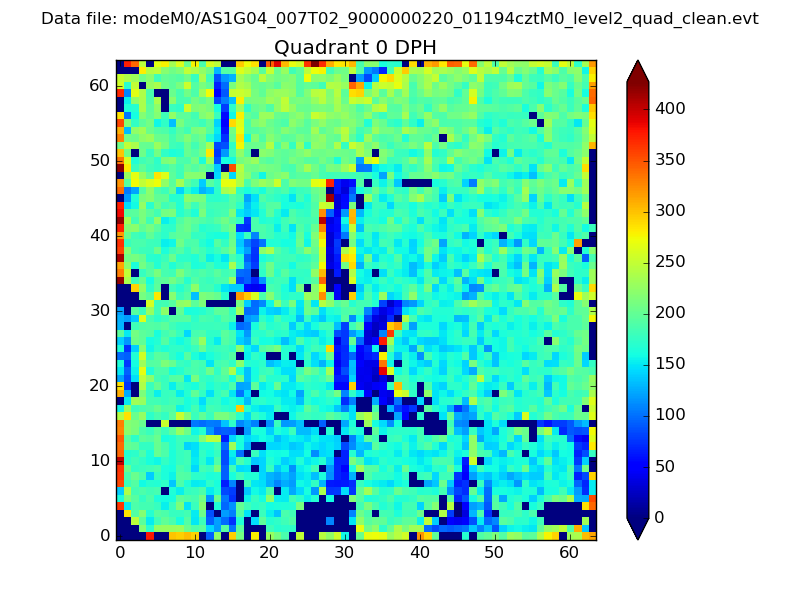 |
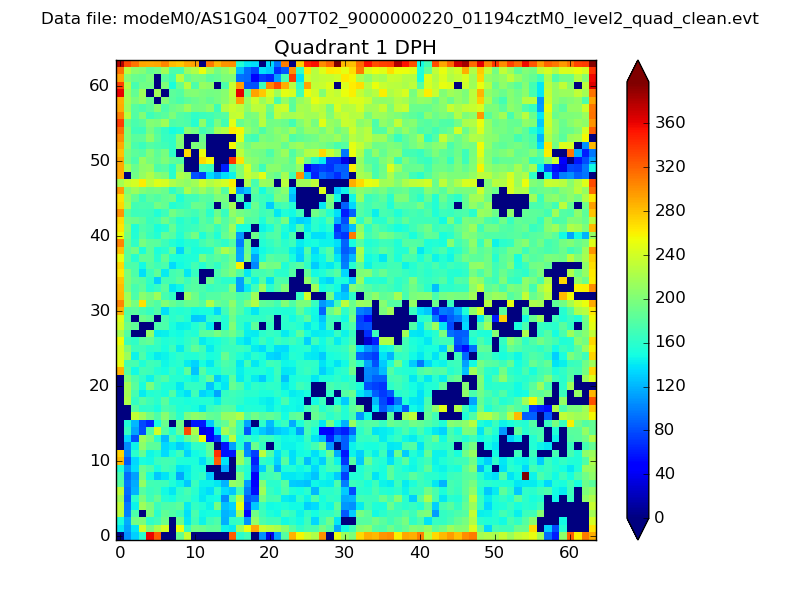 |
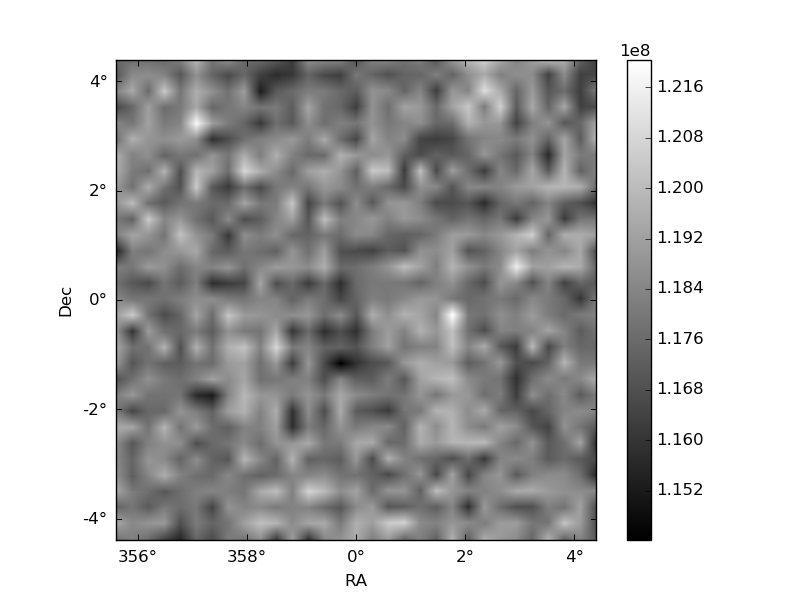
Quadrant B |
|---|---|---|---|
| Quadrant D | 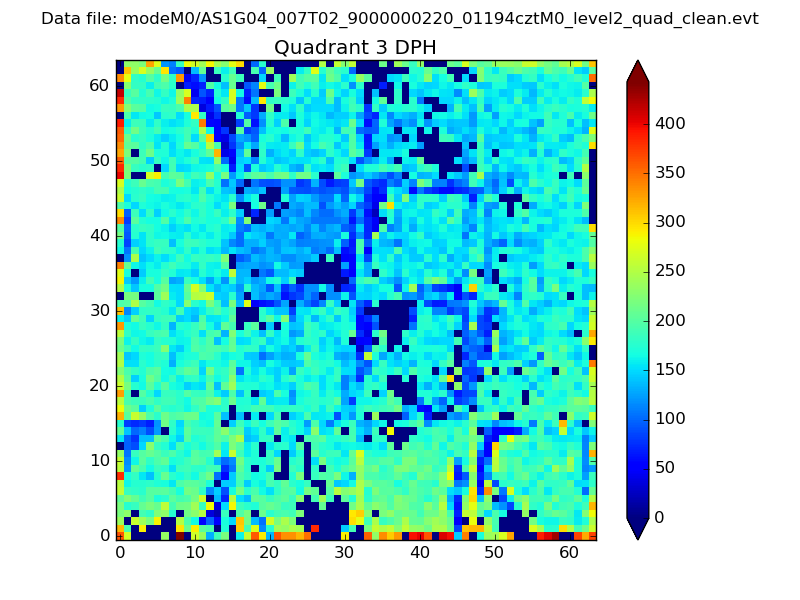 |
 |
Quadrant C |
| Plot type | Count rate plots | Images |
|---|---|---|
| Comparison with Poisson distribution Blue bars denote a histogram of data divided into 1 sec bins. Red curve is a Poisson curve with rate = median count rate of data. |
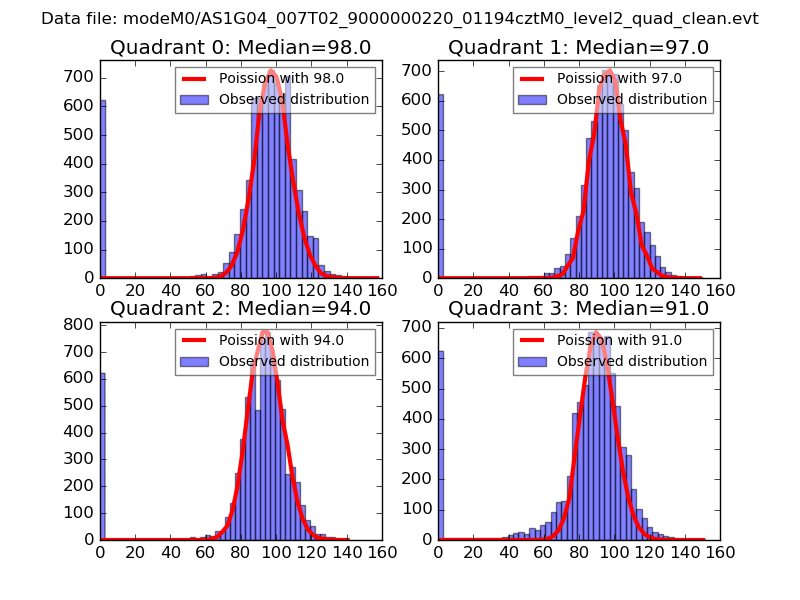 |
 |
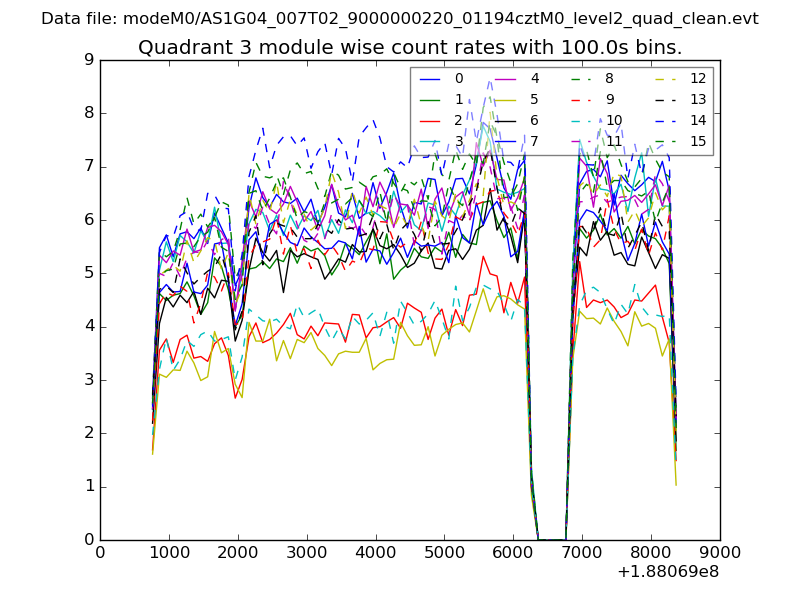
| Quadrant-wise count rates Data is divided into 100 sec bins |
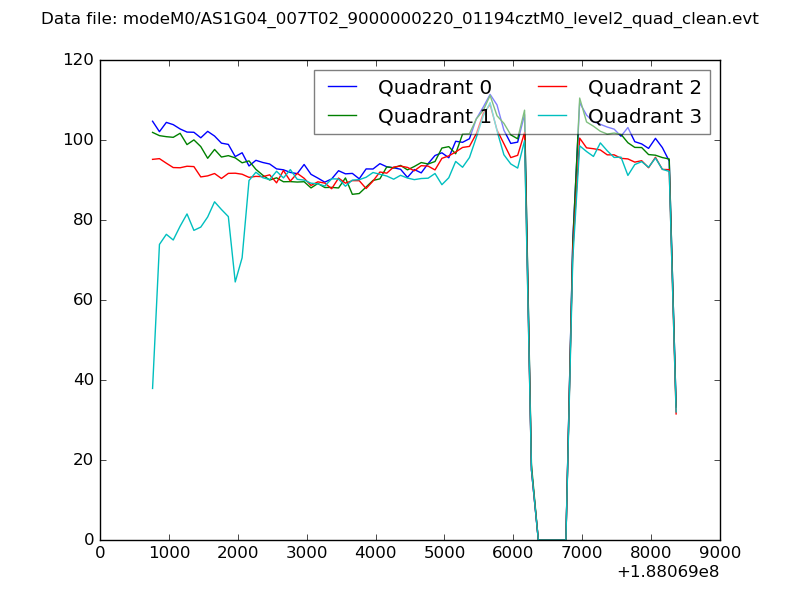 |
|
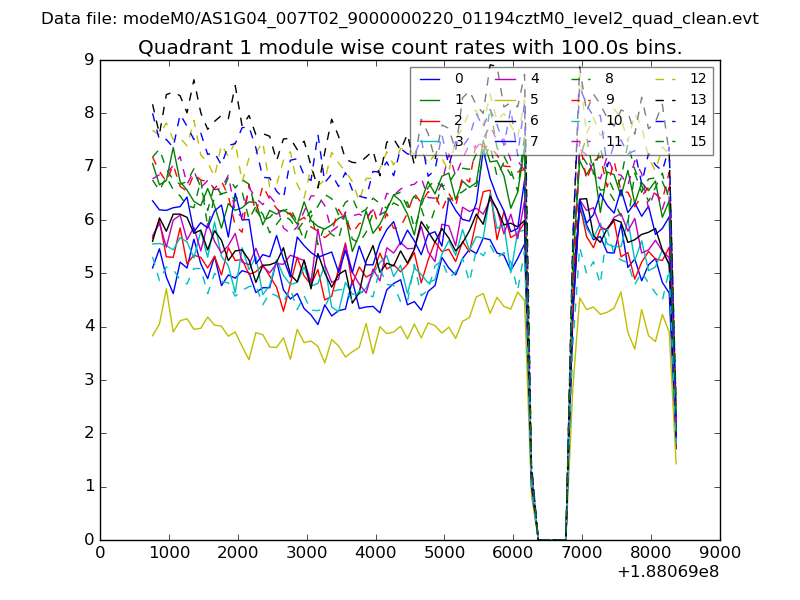
| Module-wise count rates for Quadrant A Data is divided into 100 sec bins |
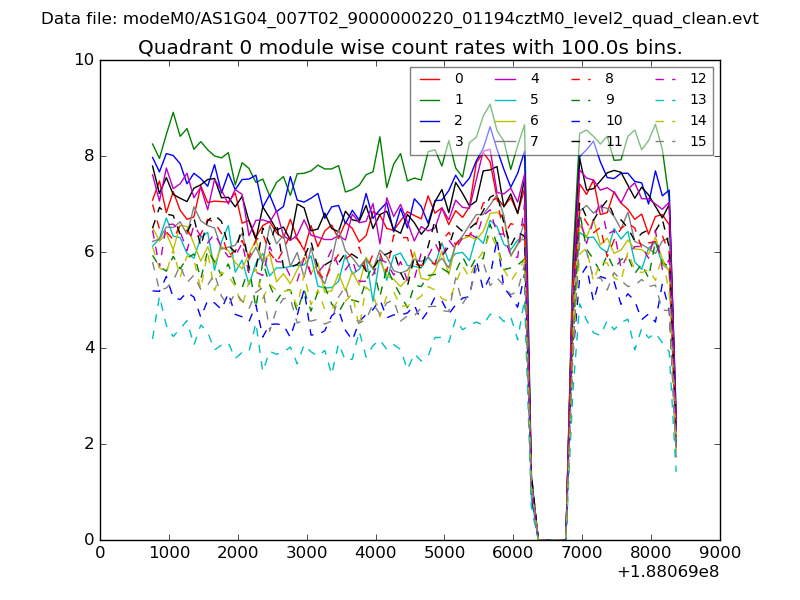 |
 |
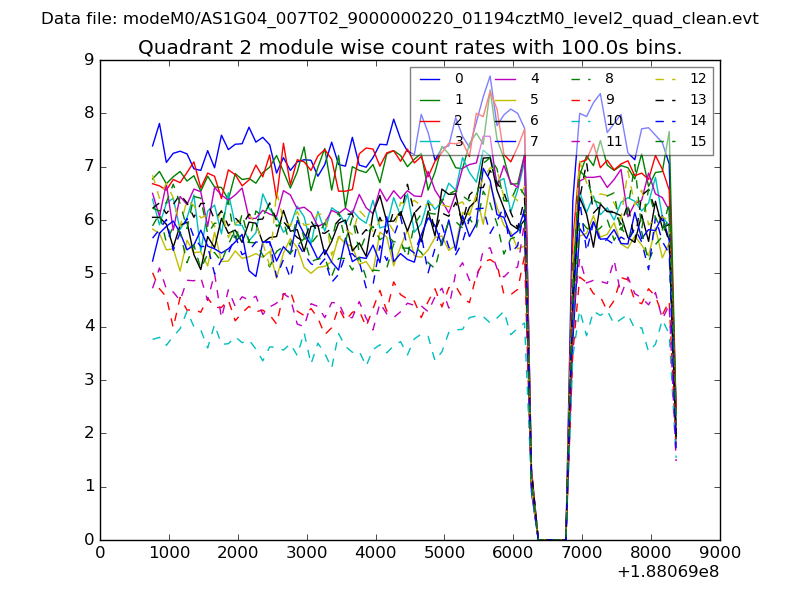
| Module-wise count rates for Quadrant B Data is divided into 100 sec bins |
 |
 |
| Module-wise count rates for Quadrant C Data is divided into 100 sec bins |
 |
 |
| Module-wise count rates for Quadrant D Data is divided into 100 sec bins |
 |
 |
| Parameter | Plot |
|---|---|
| CZT HV Monitor | 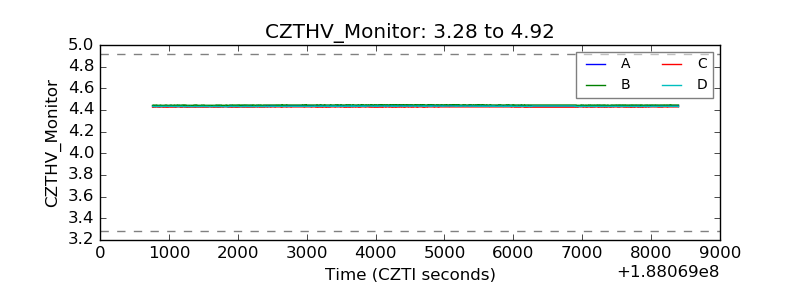 |
| D_VDD | 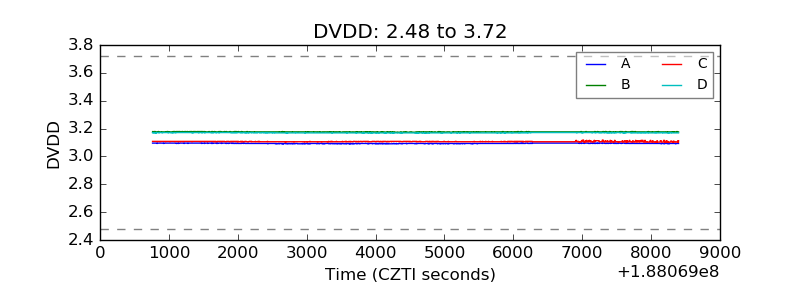 |
| Temperature 1 | 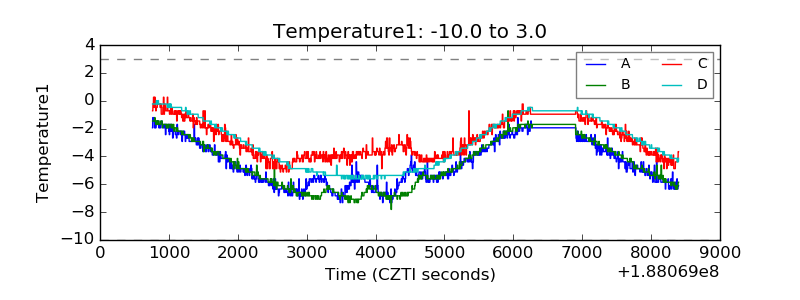 |
| Veto HV Monitor | 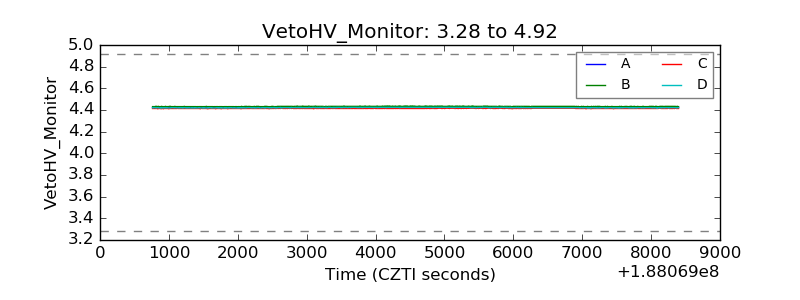 |
| Veto LLD | 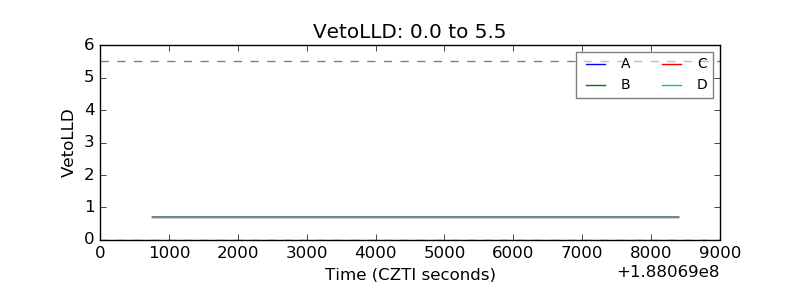 |
| Alpha Counter | 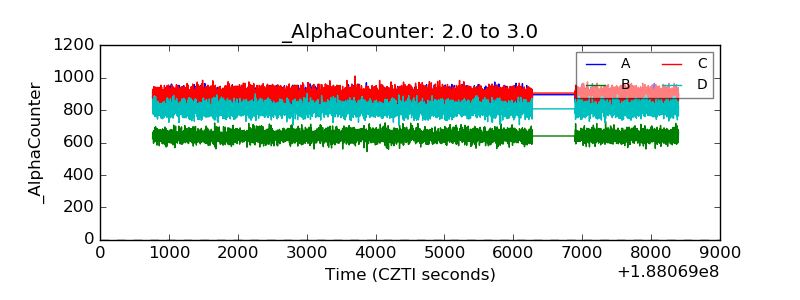 |
| _CPM_Rate | 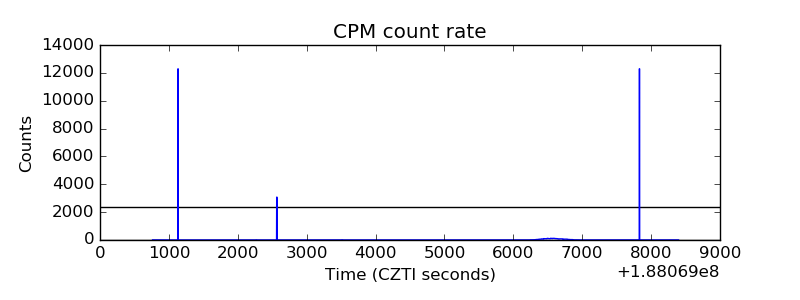 |
| CZT Counter | 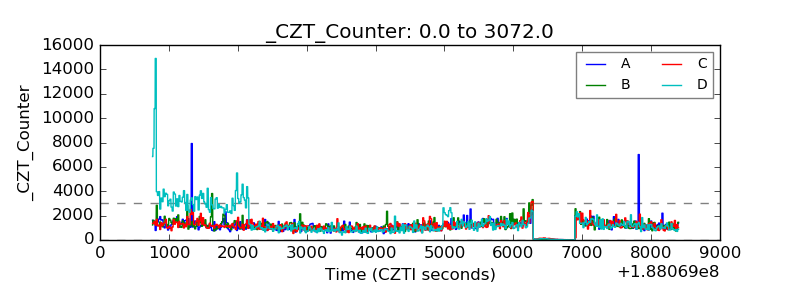 |
| +2.5 Volts monitor |  |
| +5 Volts monitor |  |
| _ROLL_ROT | 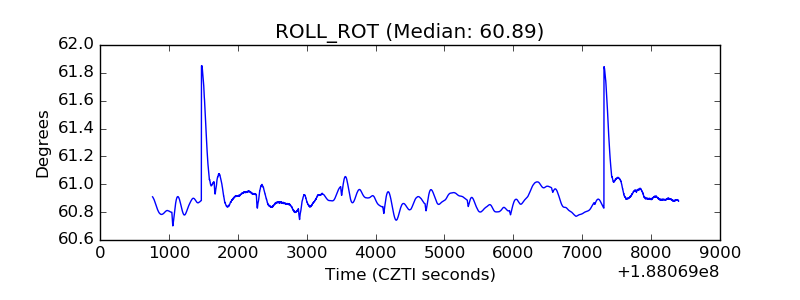 |
| _Roll_DEC | 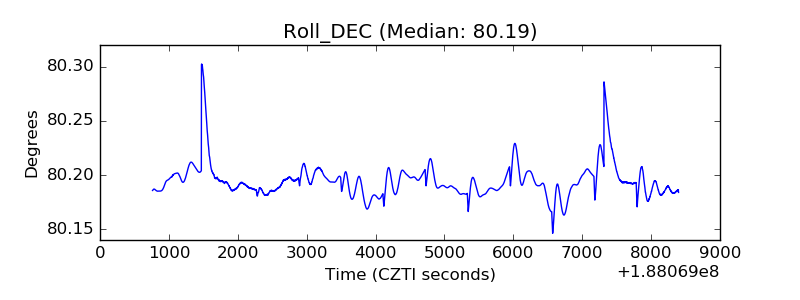 |
| _Roll_RA | 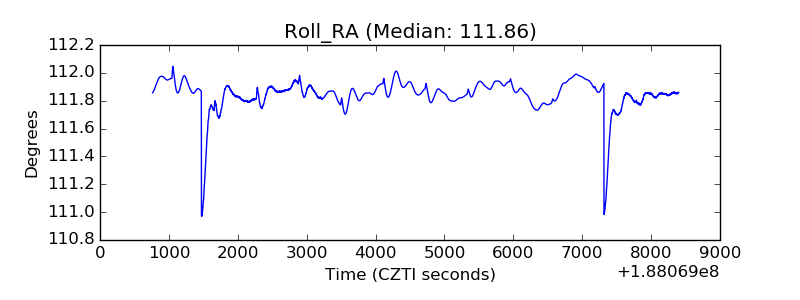 |
| Veto Counter | 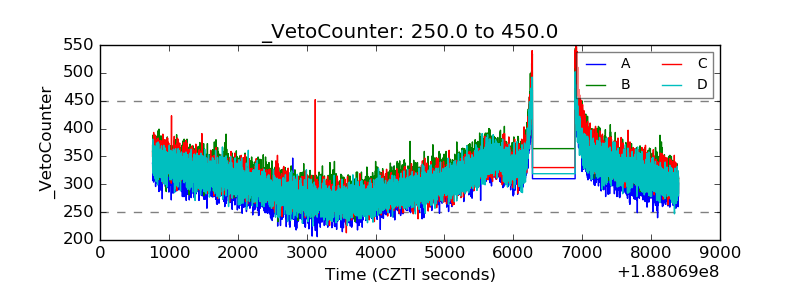 |