| Param | Original file | Final file |
|---|---|---|
| Filename | modeM0/AS1G04_007T02_9000000220_01196cztM0_level2.evt | modeM0/AS1G04_007T02_9000000220_01196cztM0_level2_quad_clean.evt |
| Size (bytes) | 1,069,577,280 | 101,707,200 |
| Size | 1020.0 MB | 97.0 MB |
| Events in quadrant A | 7,685,665 | 669,533 |
| Events in quadrant B | 8,307,622 | 658,360 |
| Events in quadrant C | 7,908,072 | 649,195 |
| Events in quadrant D | 8,050,025 | 639,537 |
| Mode M9 | |||
|---|---|---|---|
| Quadrant | BADHDUFLAG | Total packets | Discarded packets |
| A | 0 | 17 | 0 |
| B | 0 | 17 | 0 |
| C | 0 | 17 | 0 |
| D | 0 | 17 | 0 |
| Mode M0 | |||
|---|---|---|---|
| Quadrant | BADHDUFLAG | Total packets | Discarded packets |
| A | 0 | 27607 | 3 |
| B | 0 | 29429 | 2 |
| C | 0 | 28192 | 2 |
| D | 0 | 28676 | 2 |
| Mode SS | |||
|---|---|---|---|
| Quadrant | BADHDUFLAG | Total packets | Discarded packets |
| A | 0 | 136 | 0 |
| B | 0 | 136 | 0 |
| C | 0 | 136 | 0 |
| D | 0 | 136 | 0 |
| Quadrant | Total seconds | Saturated seconds | Saturation percentage |
|---|---|---|---|
| A | 6646 | 5 | 0.075233% |
| B | 6646 | 15 | 0.225700% |
| C | 6646 | 11 | 0.165513% |
| D | 6646 | 139 | 2.091484% |
Noise dominated data is calculated using 1-second bins in cleaned event files. If a bin has >2000 counts, and if more than 50% of those come from <1% of pixels, then it is considered to be noise-dominated and hence unusable.
| Quadrant | # 1 sec bins | Bins with >0 counts | Bins with >2000 counts | High rate bins dominated by noise | Noise dominated (total time) | Noise dominated (detector-on time) | Marked lightcurve |
|---|---|---|---|---|---|---|---|
| A | 7600 | 6645 | 147 | 147 | 1.93% | 2.21% | 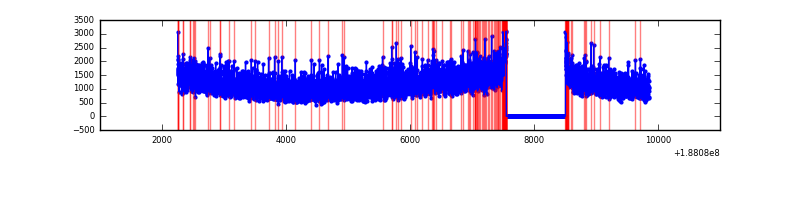 |
| B | 7600 | 6645 | 234 | 234 | 3.08% | 3.52% | 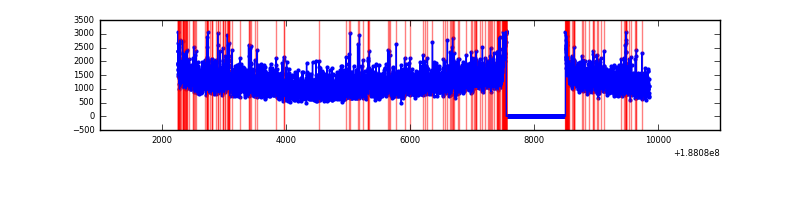 |
| C | 7600 | 6645 | 163 | 163 | 2.14% | 2.45% | 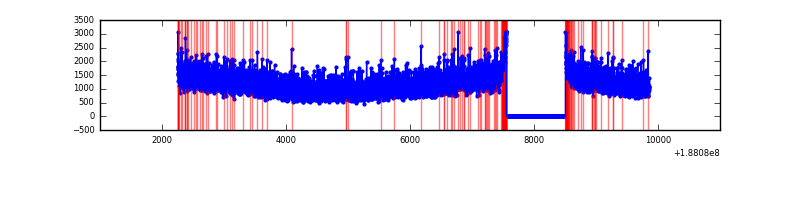 |
| D | 7600 | 6645 | 654 | 654 | 8.61% | 9.84% | 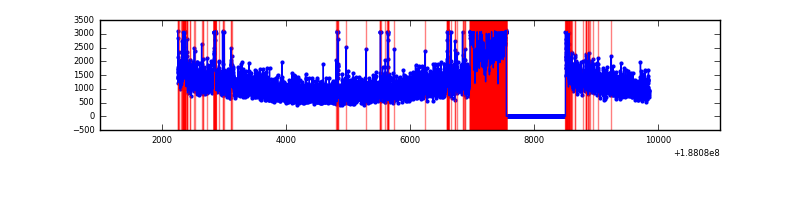 |
Top three noisy pixels from each quadrant. If the there are fewer than three noisy pixels in the level2.evt file, extra rows are filled as -1
| Pixel properties | Quadrant properties | ||||||
|---|---|---|---|---|---|---|---|
| Quadrant | DetID | PixID | Counts | Sigma | Mean | Median | Sigma |
| A | 15 | 127 | 29033 | 56.83 | 1991 | 2001 | 475.6 |
| A | 12 | 243 | 14149 | 25.54 | 1991 | 2001 | 475.6 |
| A | 11 | 79 | 9503 | 15.77 | 1991 | 2001 | 475.6 |
| B | 6 | 53 | 239871 | 478.8 | 2096 | 2100 | 496.6 |
| B | 5 | 191 | 21472 | 39.01 | 2096 | 2100 | 496.6 |
| B | 7 | 221 | 19945 | 35.93 | 2096 | 2100 | 496.6 |
| C | 15 | 241 | 365393 | 683.27 | 1912 | 1985 | 531.9 |
| C | 3 | 111 | 25406 | 44.04 | 1912 | 1985 | 531.9 |
| C | 3 | 79 | 19855 | 33.6 | 1912 | 1985 | 531.9 |
| D | 1 | 239 | 646273 | 1138.14 | 1832 | 1899 | 566.2 |
| D | 13 | 169 | 177865 | 310.8 | 1832 | 1899 | 566.2 |
| D | 12 | 22 | 162907 | 284.38 | 1832 | 1899 | 566.2 |
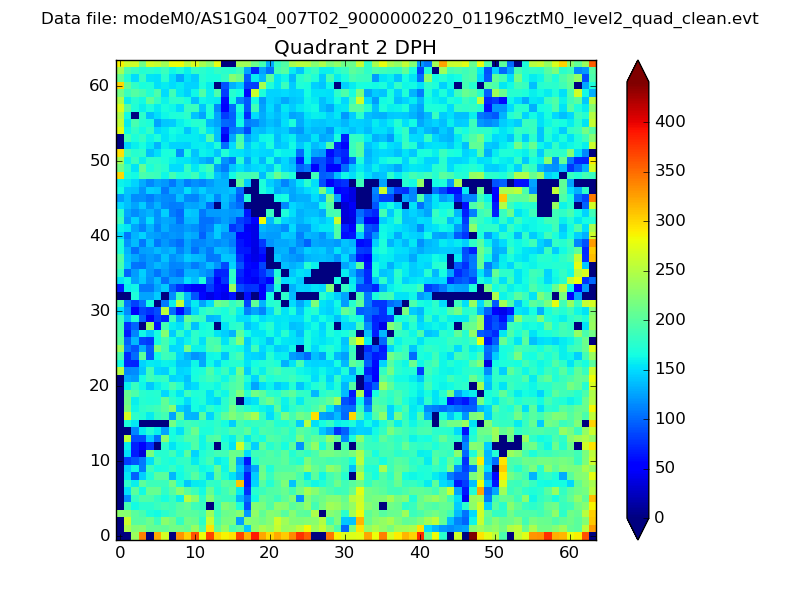
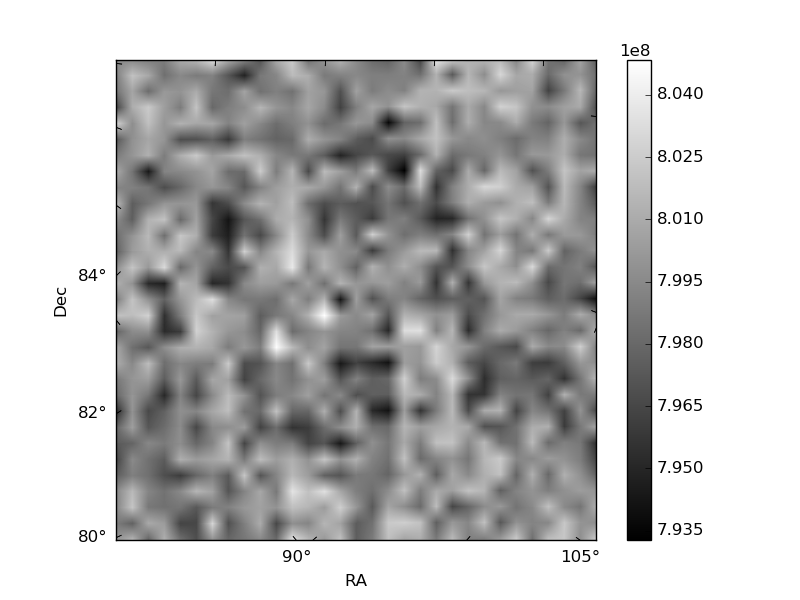
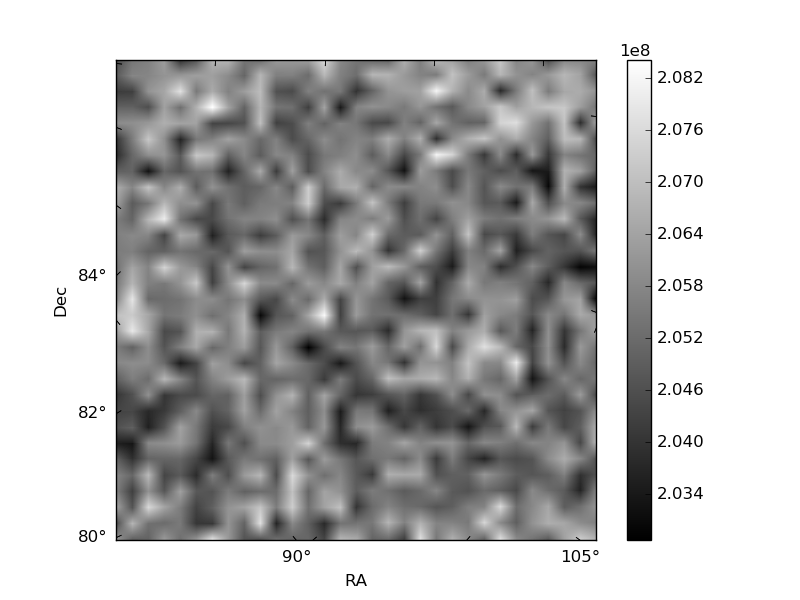
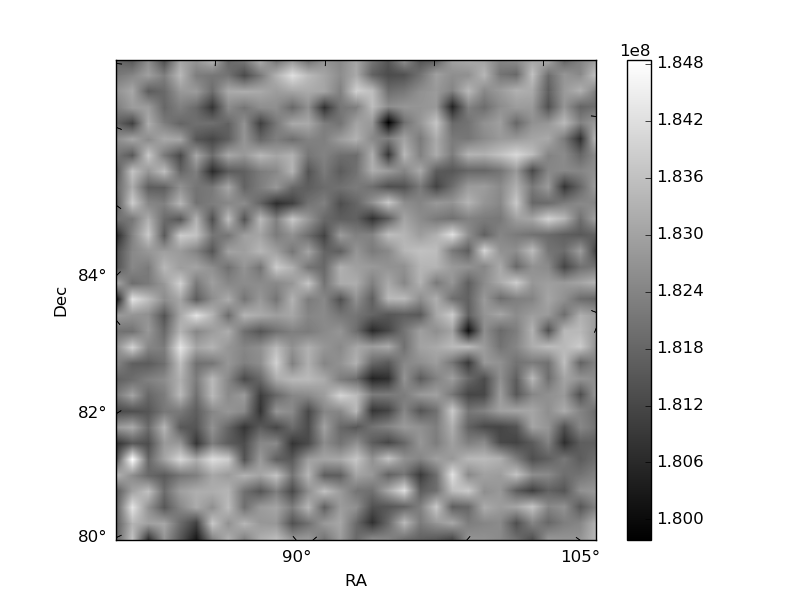
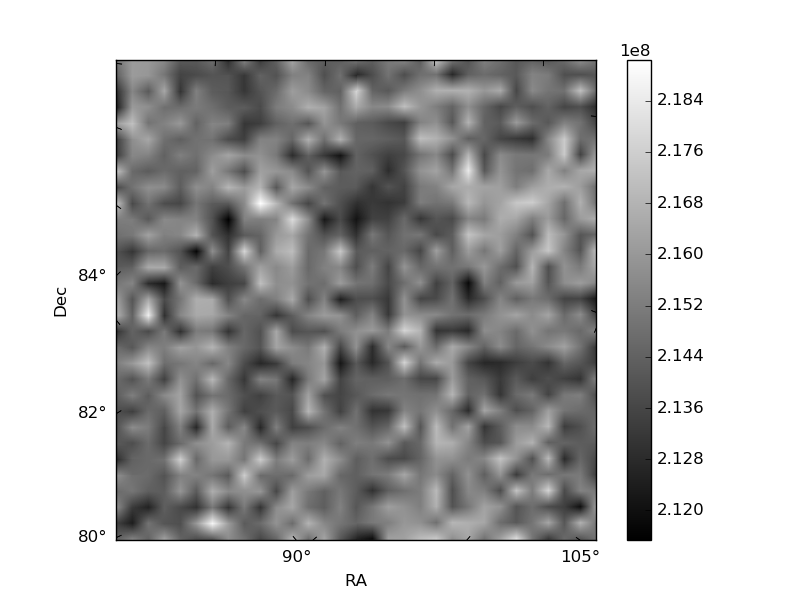
Histogram calculated using DETX and DETY for each event in the final _common_clean file
| Quadrant A | 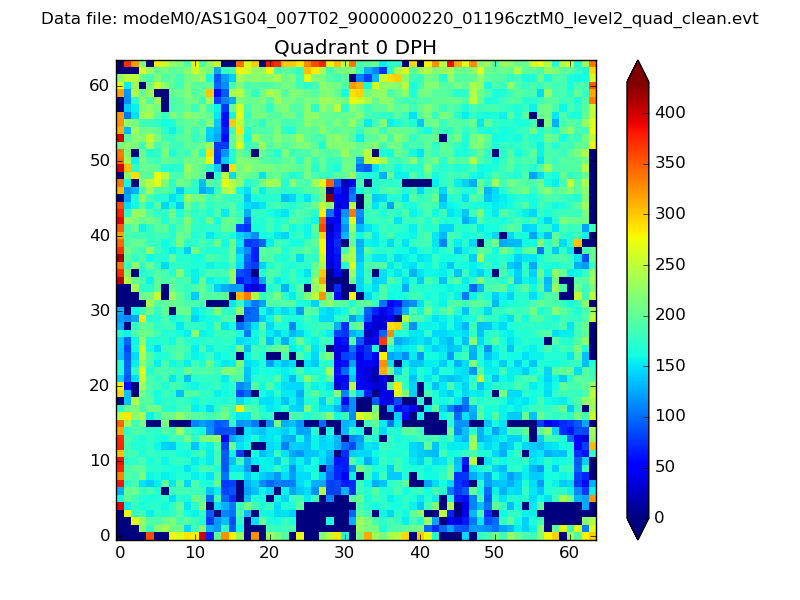 |
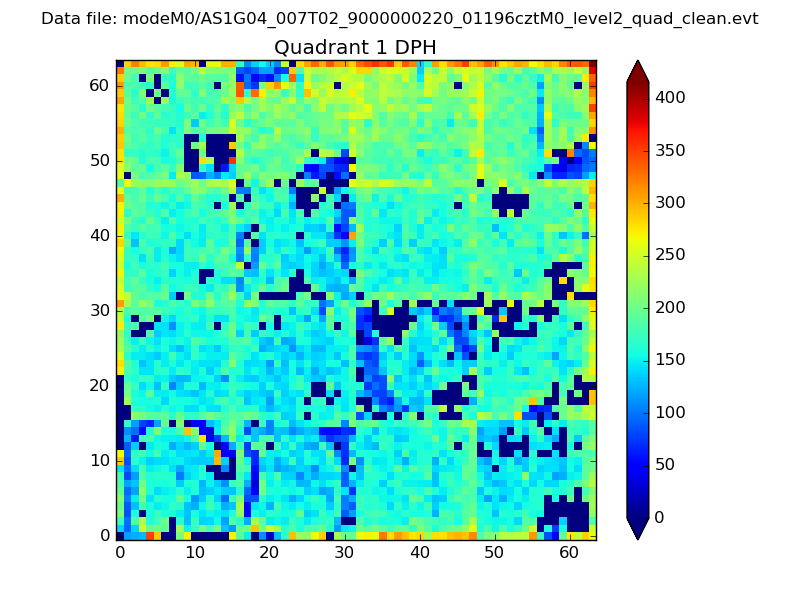 |
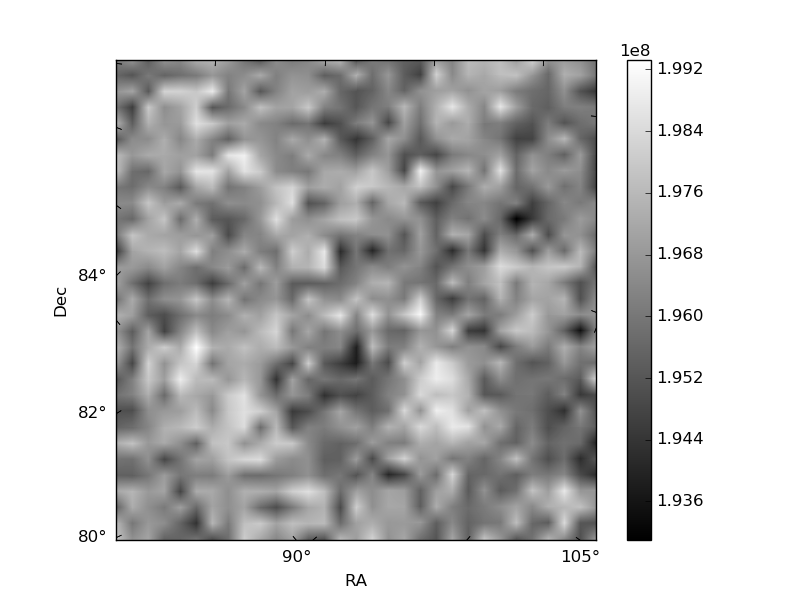
Quadrant B |
|---|---|---|---|
| Quadrant D | 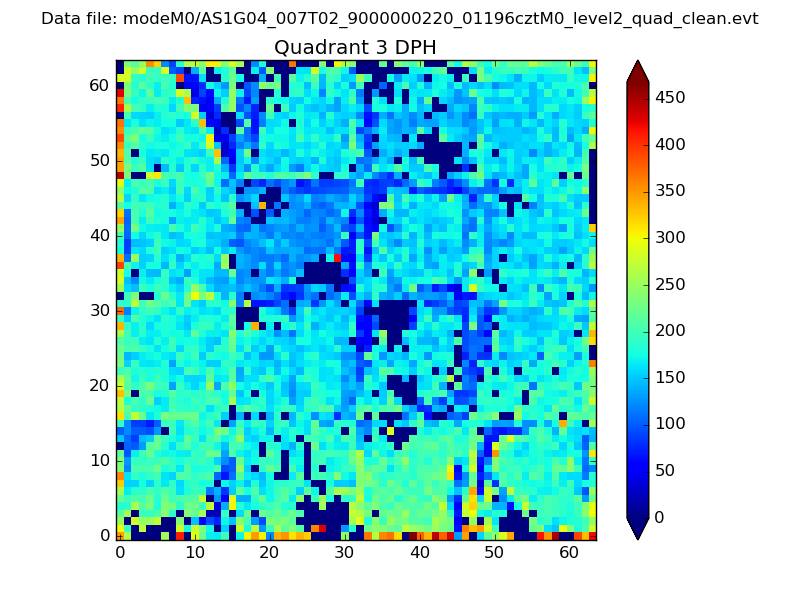 |
 |
Quadrant C |
| Plot type | Count rate plots | Images |
|---|---|---|
| Comparison with Poisson distribution Blue bars denote a histogram of data divided into 1 sec bins. Red curve is a Poisson curve with rate = median count rate of data. |
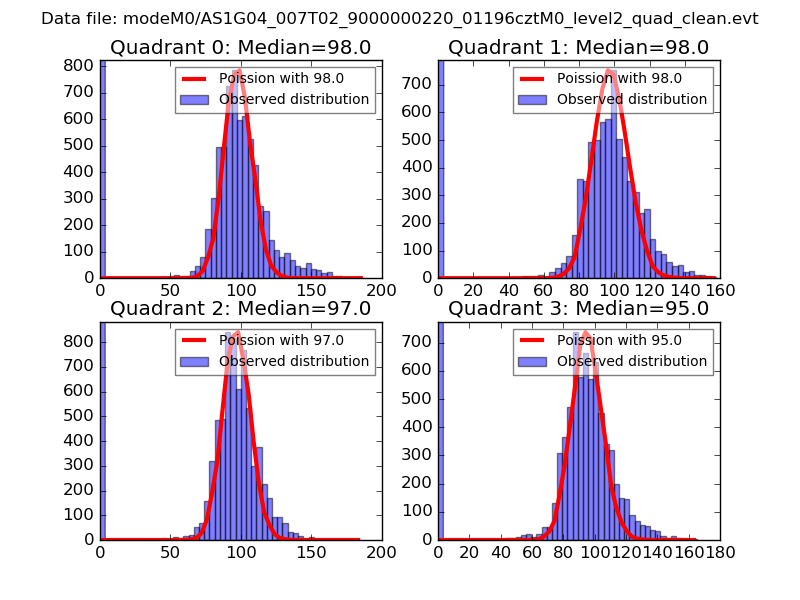 |
 |
| Quadrant-wise count rates Data is divided into 100 sec bins |
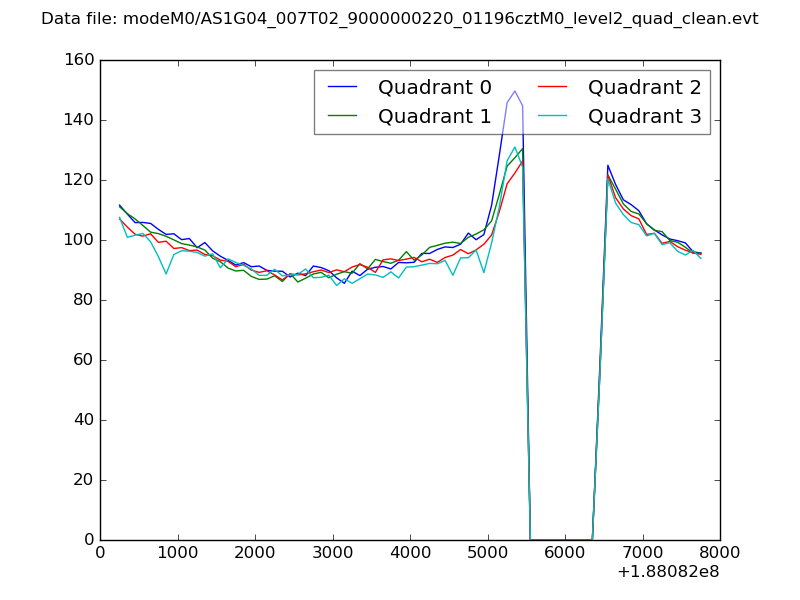 |
|
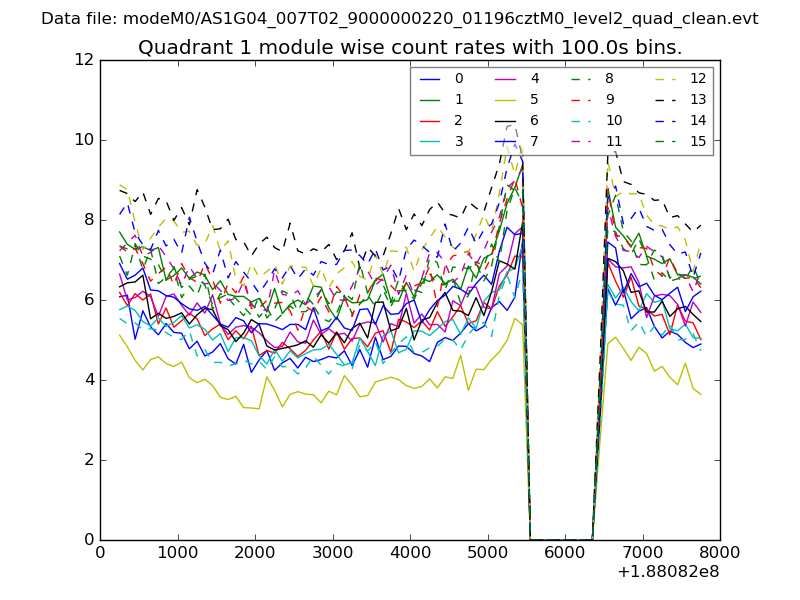
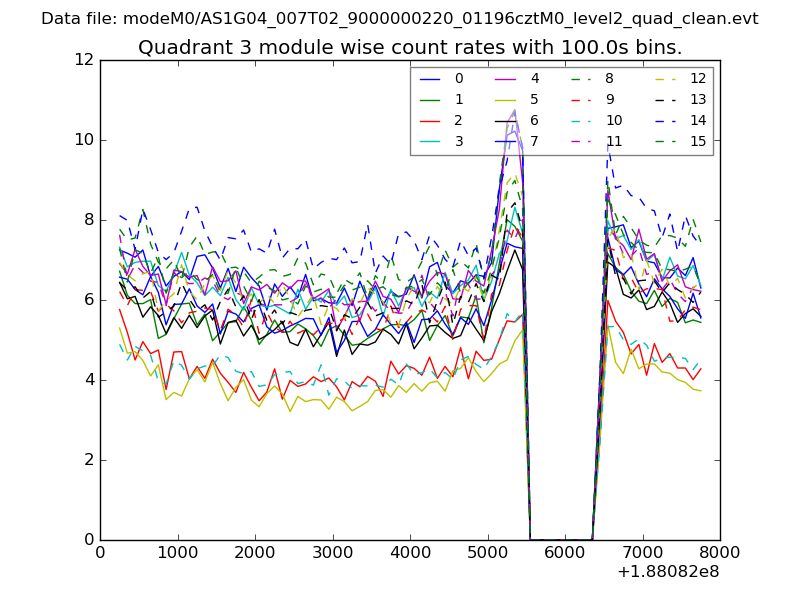
| Module-wise count rates for Quadrant A Data is divided into 100 sec bins |
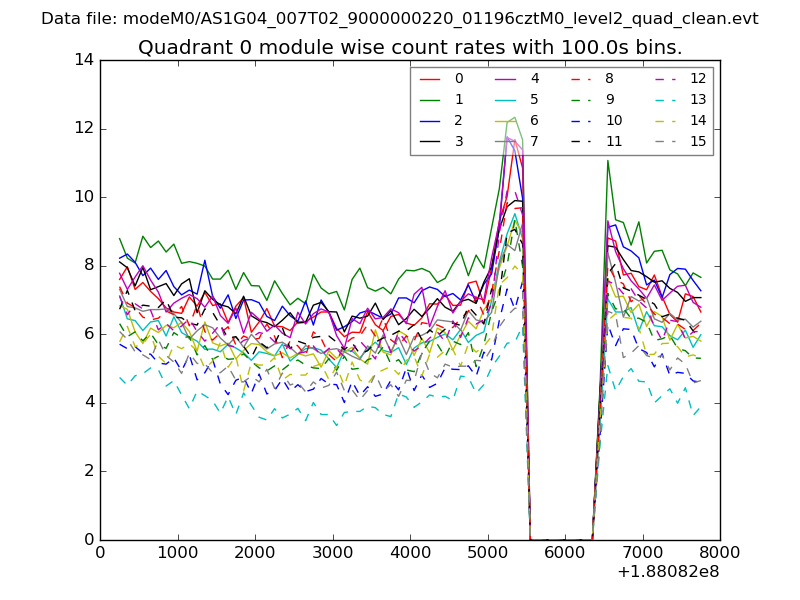 |
 |
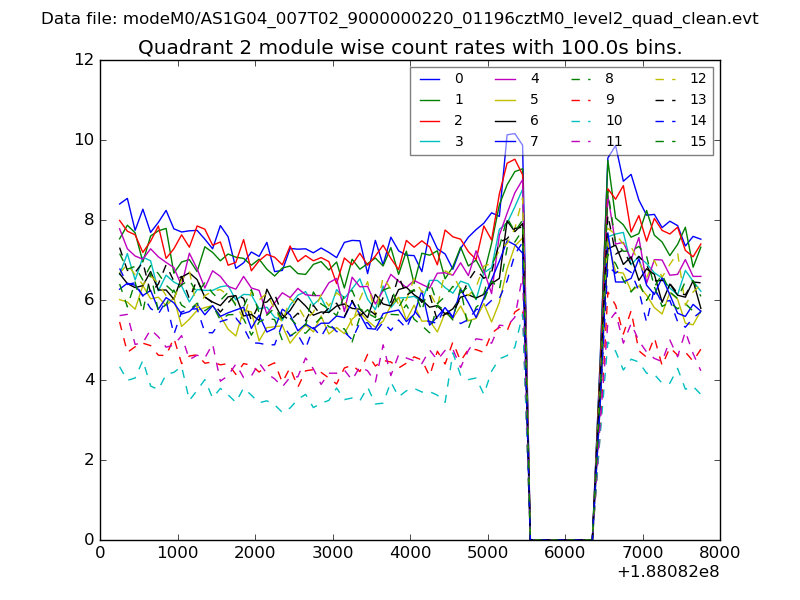
| Module-wise count rates for Quadrant B Data is divided into 100 sec bins |
 |
 |
| Module-wise count rates for Quadrant C Data is divided into 100 sec bins |
 |
 |
| Module-wise count rates for Quadrant D Data is divided into 100 sec bins |
 |
 |
| Parameter | Plot |
|---|---|
| CZT HV Monitor | 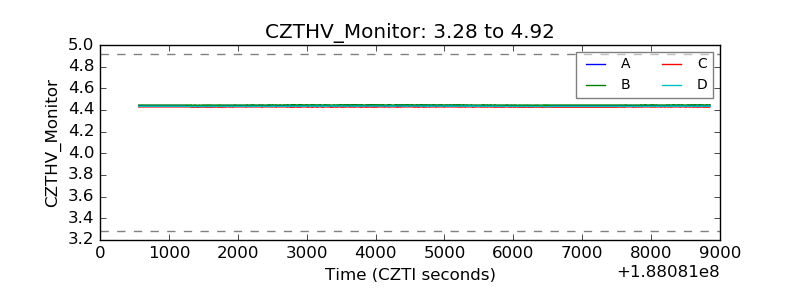 |
| D_VDD | 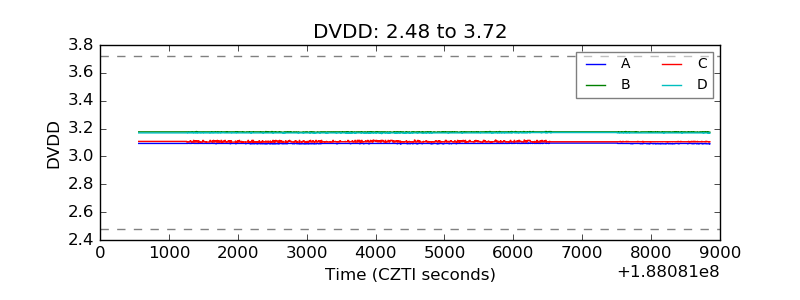 |
| Temperature 1 | 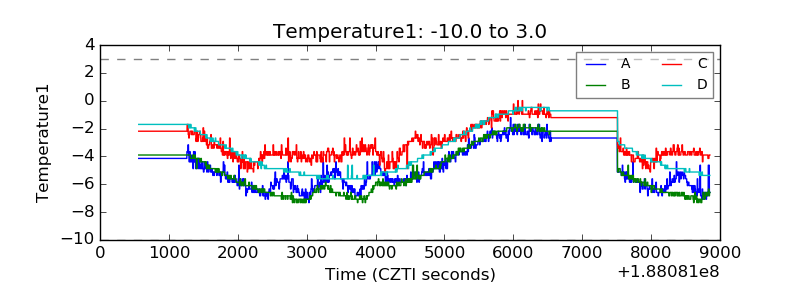 |
| Veto HV Monitor | 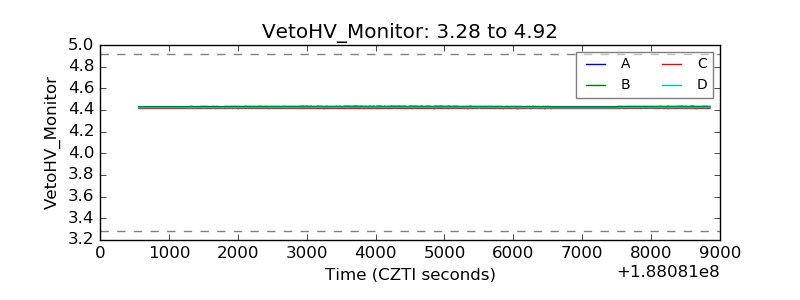 |
| Veto LLD | 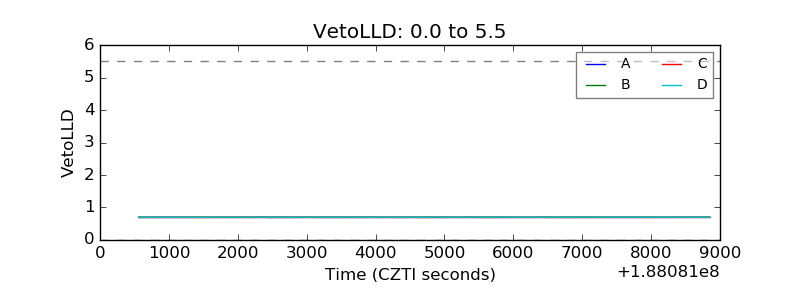 |
| Alpha Counter | 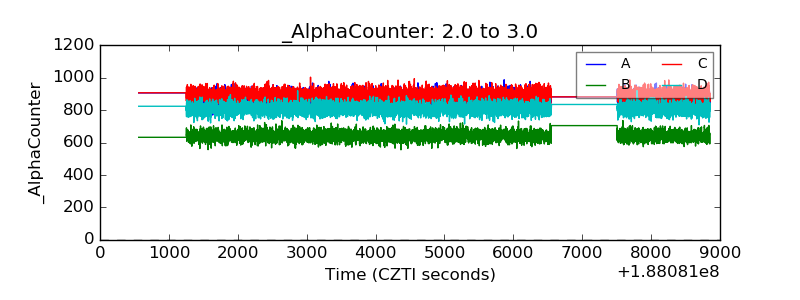 |
| _CPM_Rate | 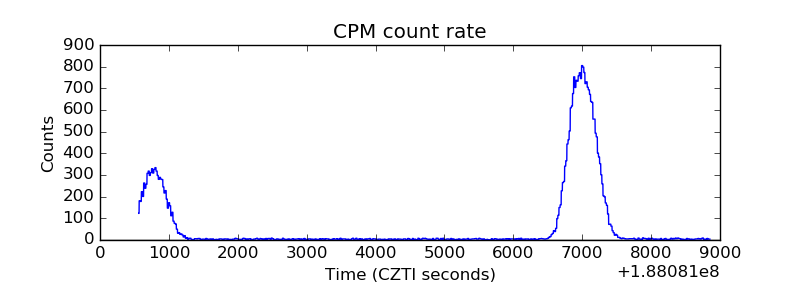 |
| CZT Counter | 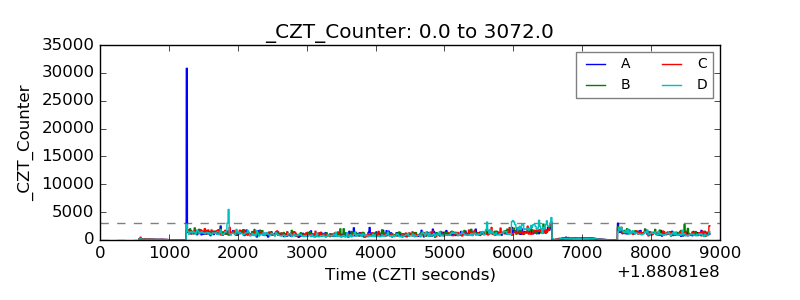 |
| +2.5 Volts monitor |  |
| +5 Volts monitor |  |
| _ROLL_ROT | 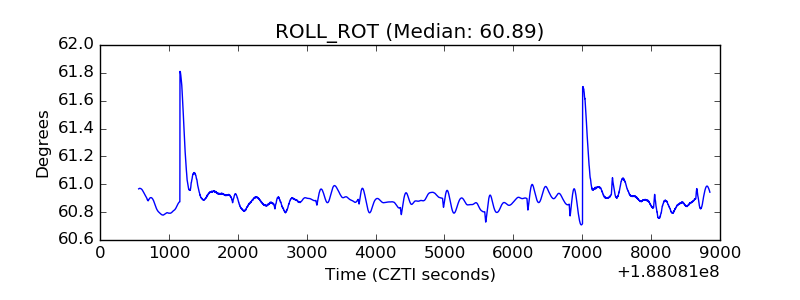 |
| _Roll_DEC | 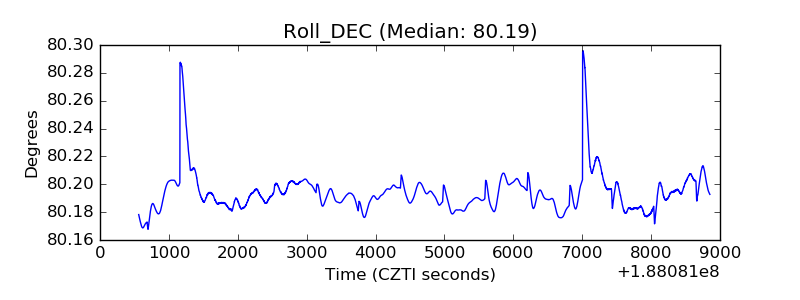 |
| _Roll_RA | 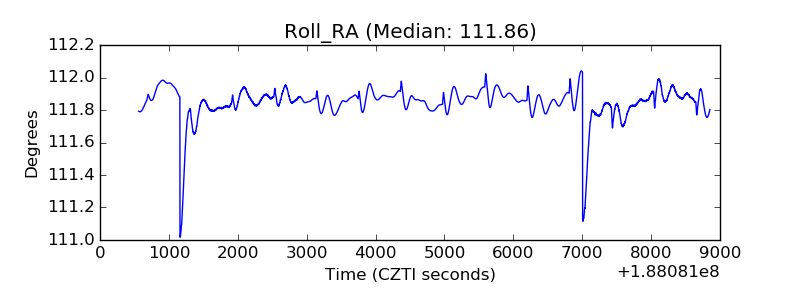 |
| Veto Counter | 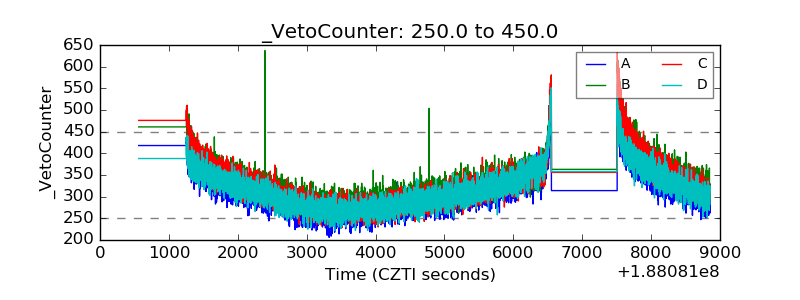 |