| Param | Original file | Final file |
|---|---|---|
| Filename | modeM0/AS1G04_007T02_9000000220_01198cztM0_level2.evt | modeM0/AS1G04_007T02_9000000220_01198cztM0_level2_quad_clean.evt |
| Size (bytes) | 1,071,843,840 | 106,943,040 |
| Size | 1022.2 MB | 102.0 MB |
| Events in quadrant A | 7,808,948 | 703,763 |
| Events in quadrant B | 8,366,621 | 698,359 |
| Events in quadrant C | 8,077,720 | 684,719 |
| Events in quadrant D | 7,754,605 | 676,264 |
| Mode M9 | |||
|---|---|---|---|
| Quadrant | BADHDUFLAG | Total packets | Discarded packets |
| A | 0 | 20 | 0 |
| B | 0 | 20 | 0 |
| C | 0 | 20 | 0 |
| D | 0 | 20 | 0 |
| Mode M0 | |||
|---|---|---|---|
| Quadrant | BADHDUFLAG | Total packets | Discarded packets |
| A | 0 | 28067 | 3 |
| B | 0 | 29695 | 2 |
| C | 0 | 28857 | 2 |
| D | 0 | 27909 | 2 |
| Mode SS | |||
|---|---|---|---|
| Quadrant | BADHDUFLAG | Total packets | Discarded packets |
| A | 0 | 142 | 0 |
| B | 0 | 142 | 0 |
| C | 0 | 142 | 0 |
| D | 0 | 142 | 0 |
| Quadrant | Total seconds | Saturated seconds | Saturation percentage |
|---|---|---|---|
| A | 6824 | 5 | 0.073271% |
| B | 6824 | 13 | 0.190504% |
| C | 6824 | 13 | 0.190504% |
| D | 6824 | 41 | 0.600821% |
Noise dominated data is calculated using 1-second bins in cleaned event files. If a bin has >2000 counts, and if more than 50% of those come from <1% of pixels, then it is considered to be noise-dominated and hence unusable.
| Quadrant | # 1 sec bins | Bins with >0 counts | Bins with >2000 counts | High rate bins dominated by noise | Noise dominated (total time) | Noise dominated (detector-on time) | Marked lightcurve |
|---|---|---|---|---|---|---|---|
| A | 8888 | 6823 | 154 | 154 | 1.73% | 2.26% | 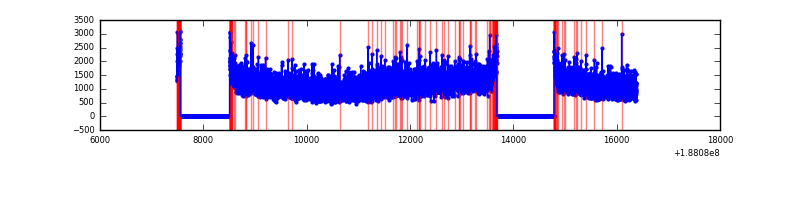 |
| B | 8889 | 6824 | 249 | 249 | 2.80% | 3.65% | 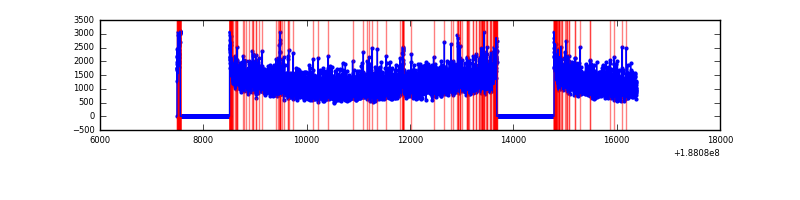 |
| C | 8888 | 6823 | 195 | 195 | 2.19% | 2.86% | 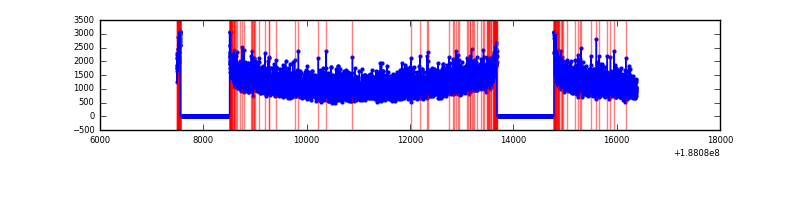 |
| D | 8889 | 6824 | 304 | 304 | 3.42% | 4.45% | 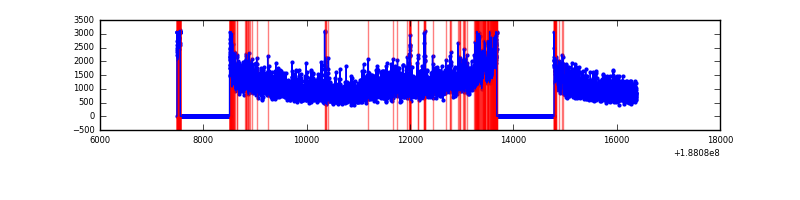 |
Top three noisy pixels from each quadrant. If the there are fewer than three noisy pixels in the level2.evt file, extra rows are filled as -1
| Pixel properties | Quadrant properties | ||||||
|---|---|---|---|---|---|---|---|
| Quadrant | DetID | PixID | Counts | Sigma | Mean | Median | Sigma |
| A | 4 | 32 | 17182 | 31.21 | 2029 | 2042 | 485.1 |
| A | 11 | 79 | 8486 | 13.28 | 2029 | 2042 | 485.1 |
| A | 3 | 111 | 6641 | 9.48 | 2029 | 2042 | 485.1 |
| B | 6 | 53 | 58071 | 111.03 | 2157 | 2168 | 503.5 |
| B | 0 | 190 | 27293 | 49.9 | 2157 | 2168 | 503.5 |
| B | 5 | 191 | 21729 | 38.85 | 2157 | 2168 | 503.5 |
| C | 15 | 241 | 374821 | 682.52 | 1955 | 2022 | 546.2 |
| C | 3 | 111 | 22123 | 36.8 | 1955 | 2022 | 546.2 |
| C | 9 | 83 | 19847 | 32.63 | 1955 | 2022 | 546.2 |
| D | 1 | 239 | 265972 | 466.48 | 1852 | 1915 | 566.1 |
| D | 2 | 16 | 187322 | 327.54 | 1852 | 1915 | 566.1 |
| D | 12 | 22 | 173161 | 302.52 | 1852 | 1915 | 566.1 |
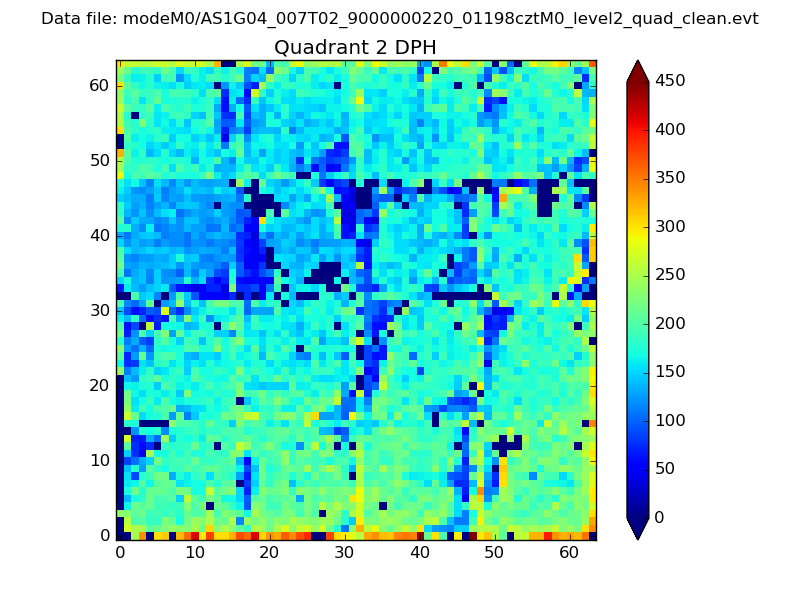
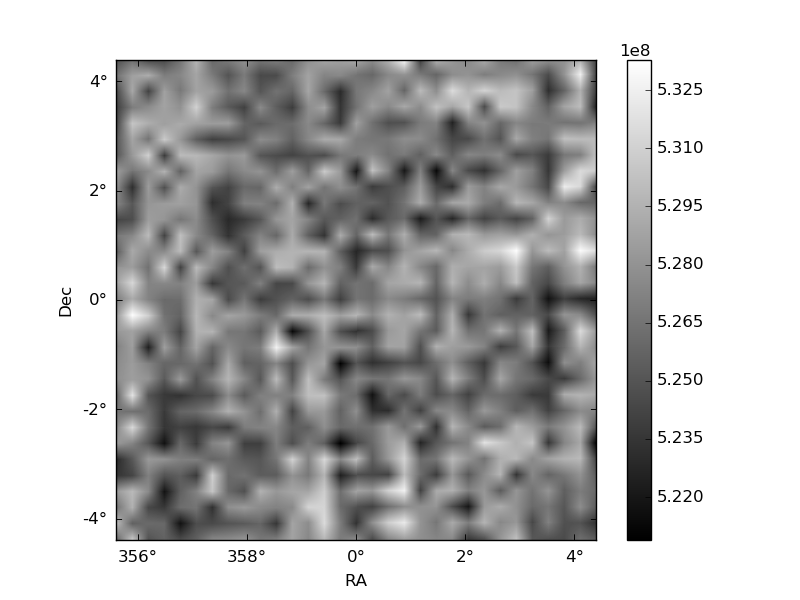
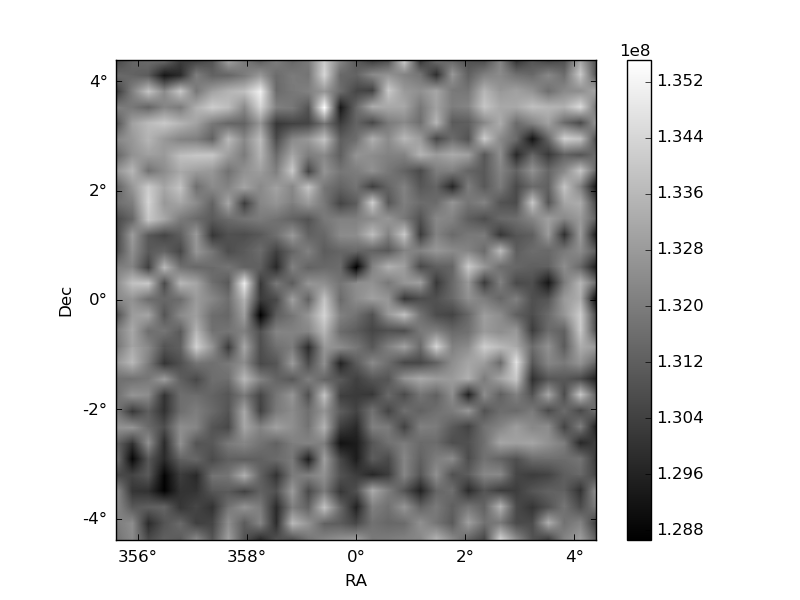
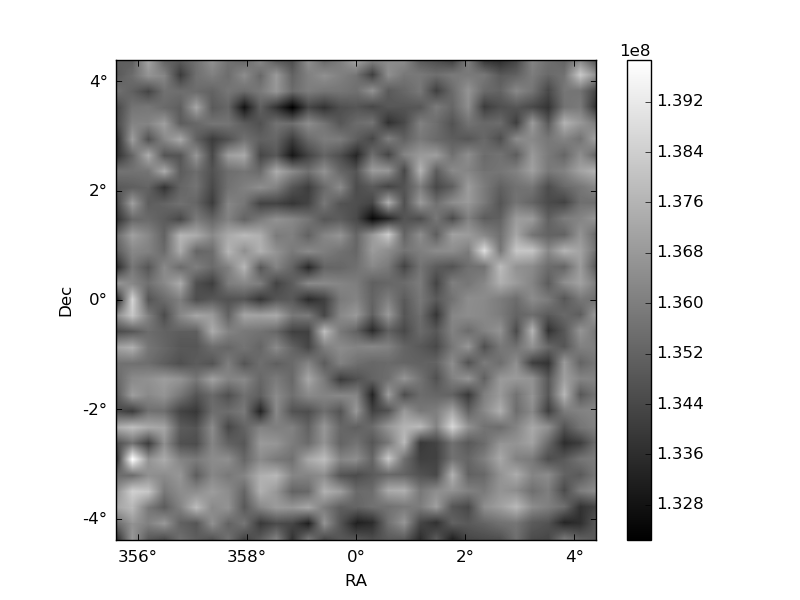
Histogram calculated using DETX and DETY for each event in the final _common_clean file
| Quadrant A | 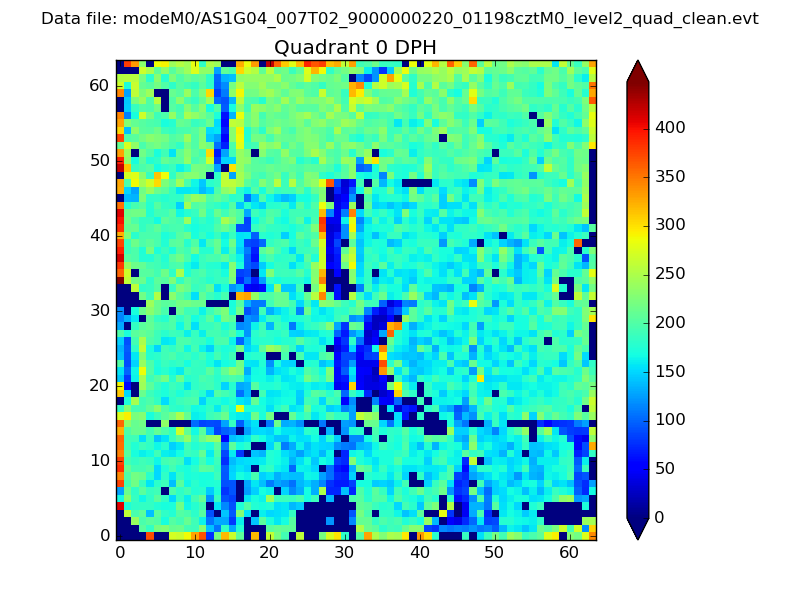 |
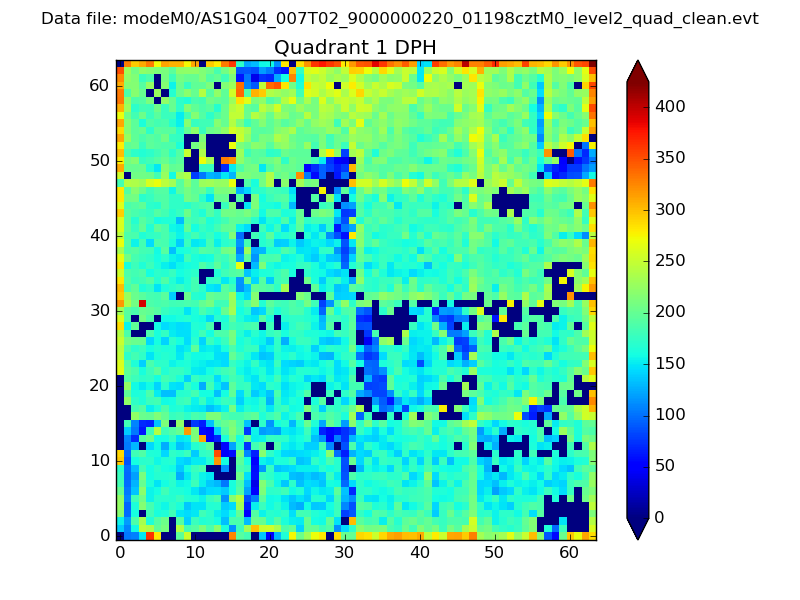 |
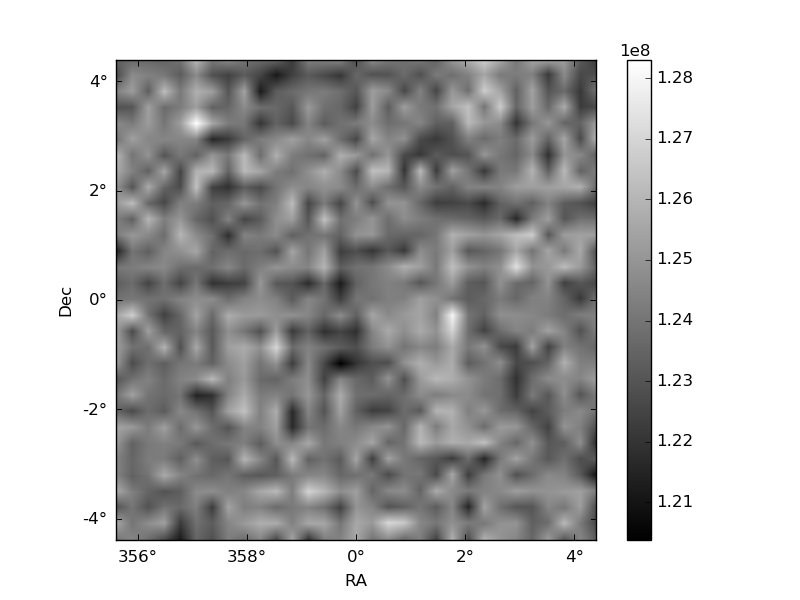
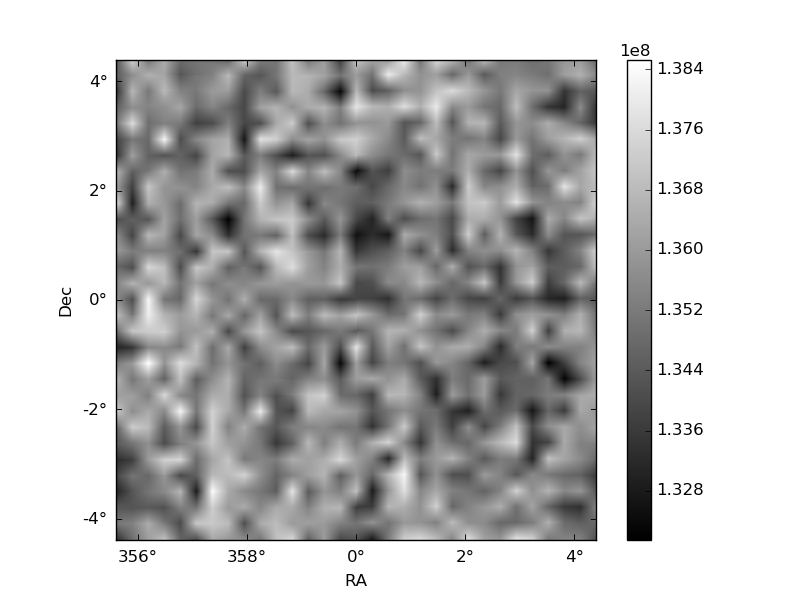
Quadrant B |
|---|---|---|---|
| Quadrant D | 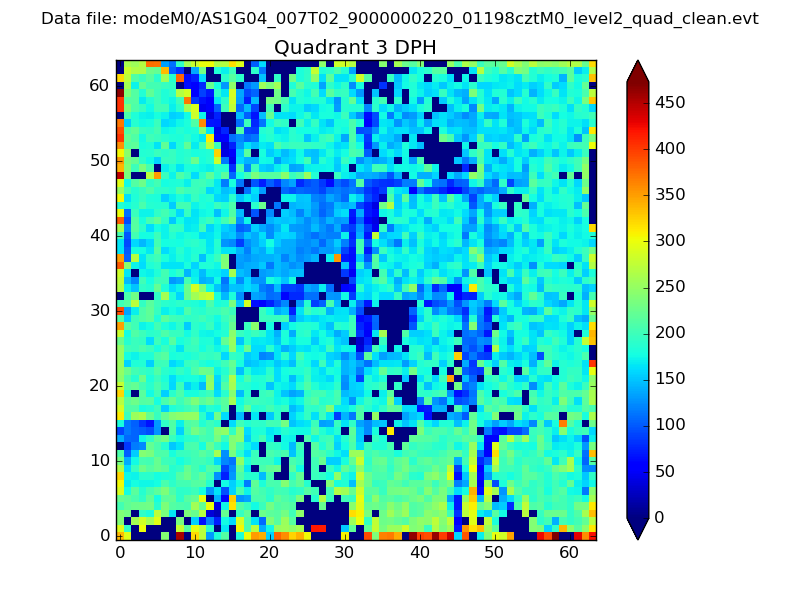 |
 |
Quadrant C |
| Plot type | Count rate plots | Images |
|---|---|---|
| Comparison with Poisson distribution Blue bars denote a histogram of data divided into 1 sec bins. Red curve is a Poisson curve with rate = median count rate of data. |
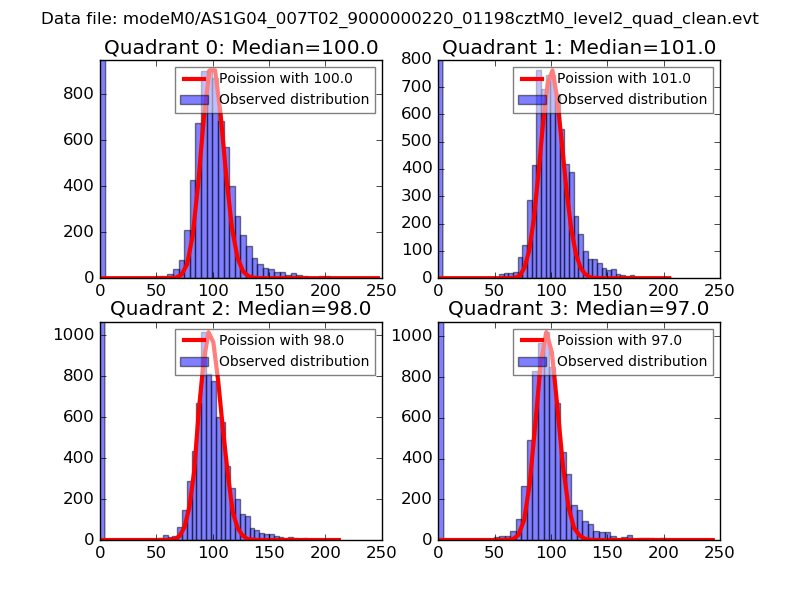 |
 |
| Quadrant-wise count rates Data is divided into 100 sec bins |
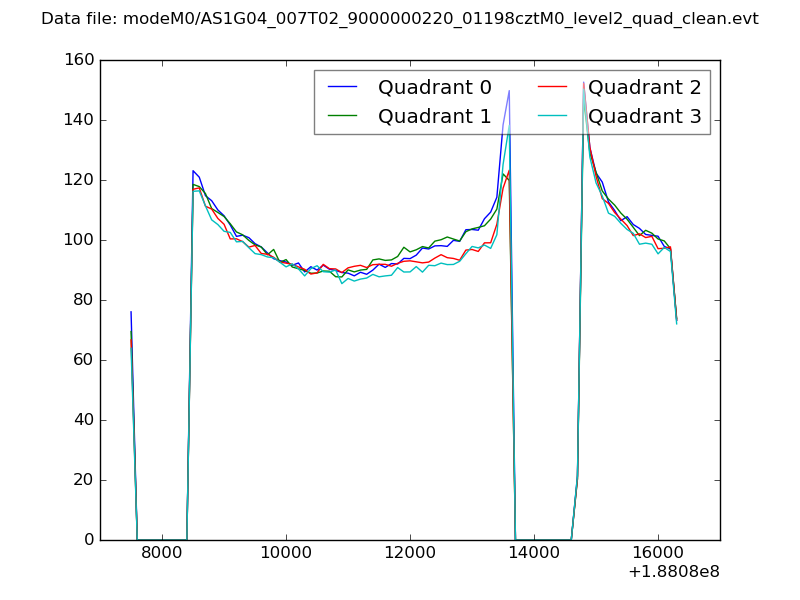 |
|
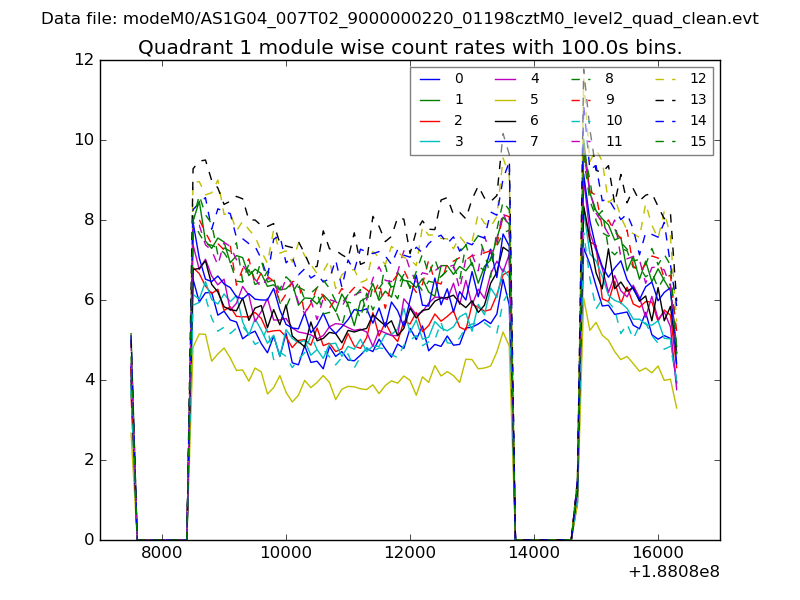
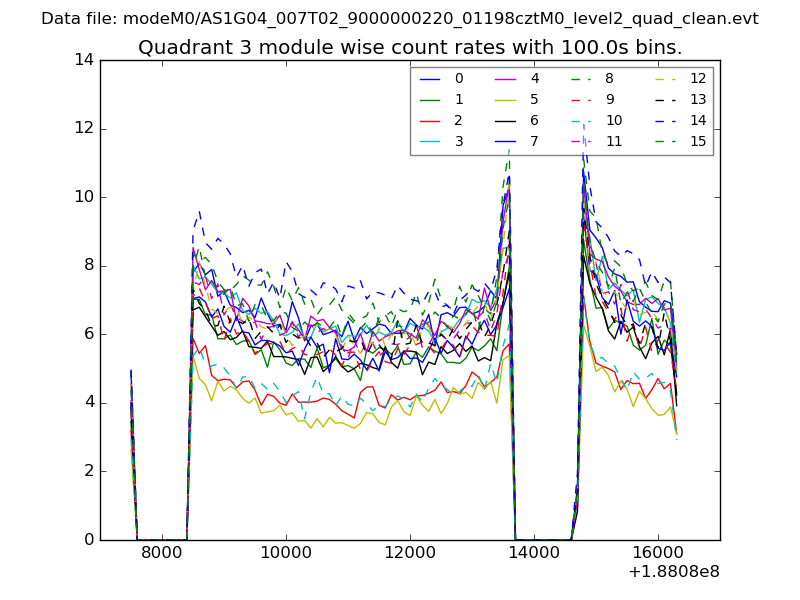
| Module-wise count rates for Quadrant A Data is divided into 100 sec bins |
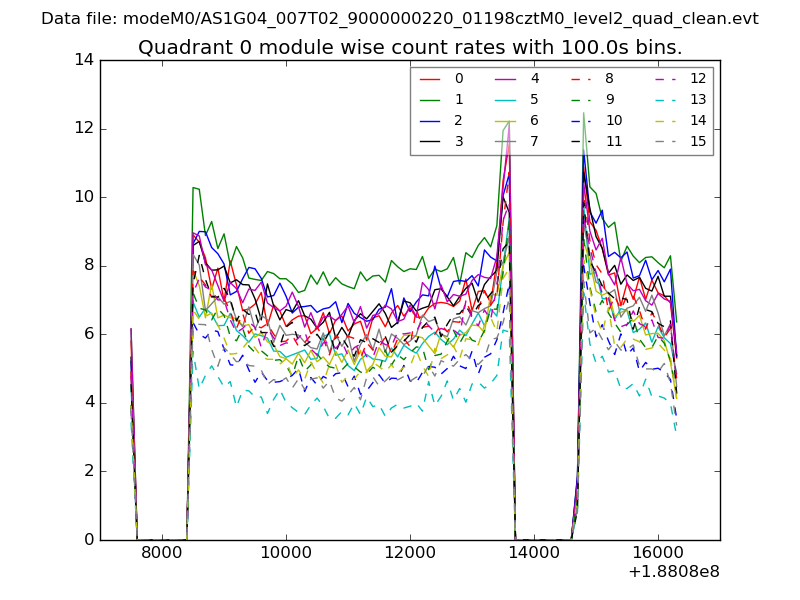 |
 |
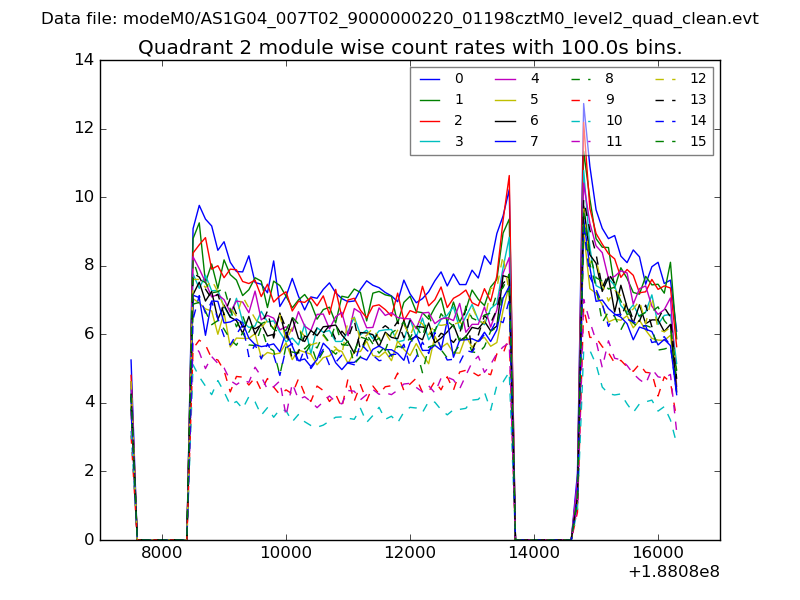
| Module-wise count rates for Quadrant B Data is divided into 100 sec bins |
 |
 |
| Module-wise count rates for Quadrant C Data is divided into 100 sec bins |
 |
 |
| Module-wise count rates for Quadrant D Data is divided into 100 sec bins |
 |
 |
| Parameter | Plot |
|---|---|
| CZT HV Monitor | 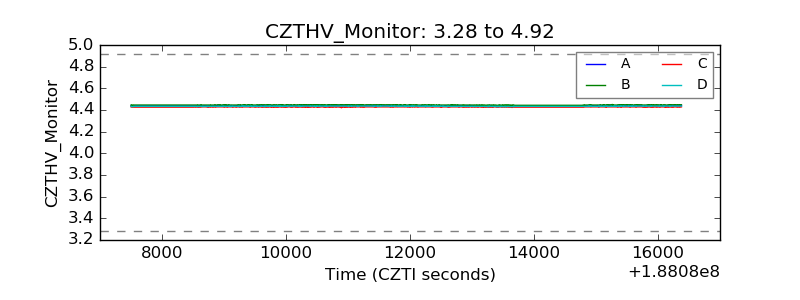 |
| D_VDD | 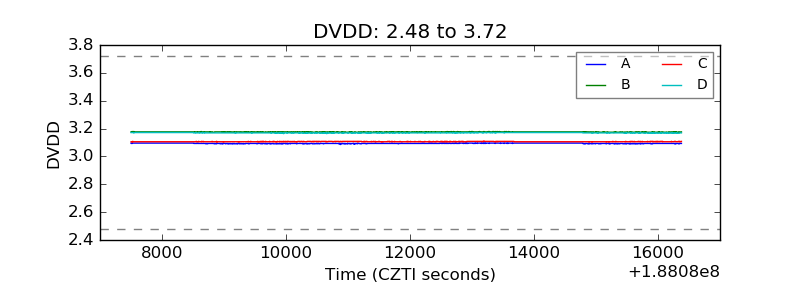 |
| Temperature 1 |  |
| Veto HV Monitor | 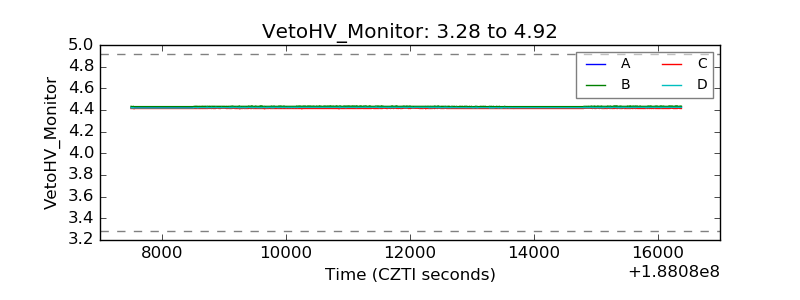 |
| Veto LLD | 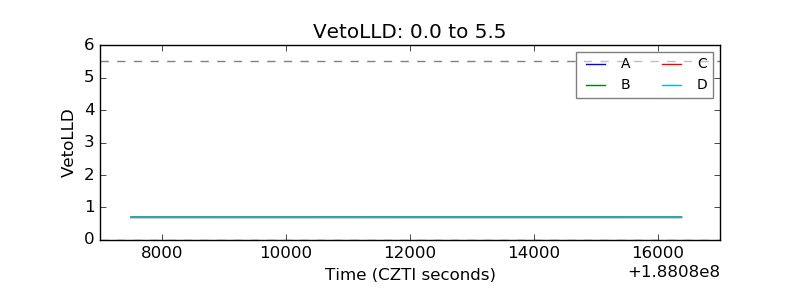 |
| Alpha Counter | 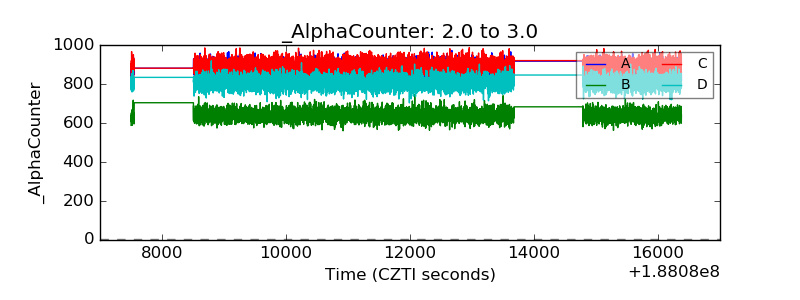 |
| _CPM_Rate | 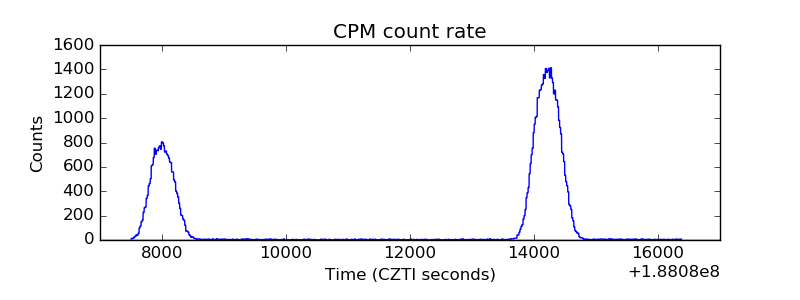 |
| CZT Counter | 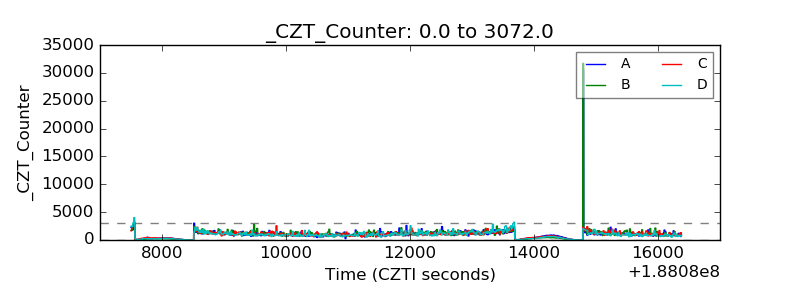 |
| +2.5 Volts monitor |  |
| +5 Volts monitor |  |
| _ROLL_ROT | 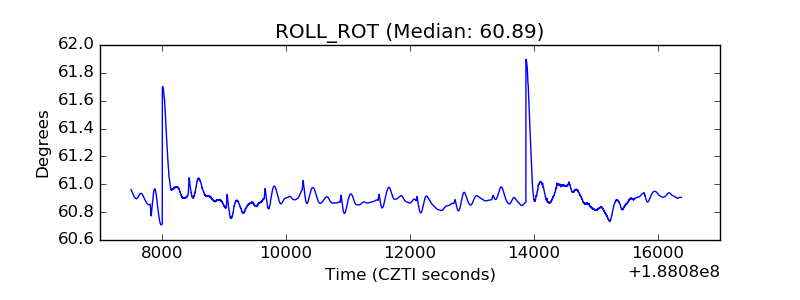 |
| _Roll_DEC | 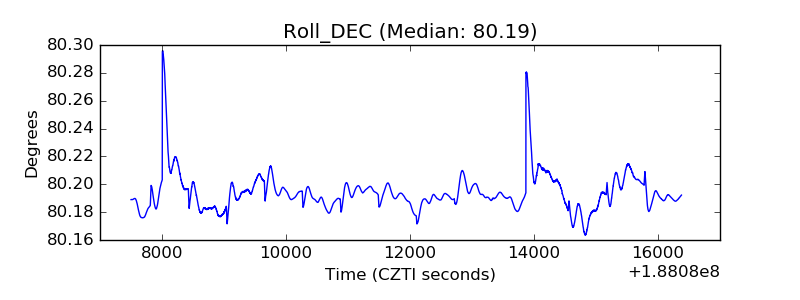 |
| _Roll_RA | 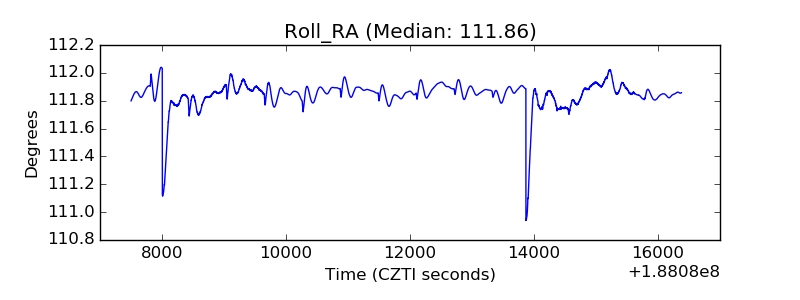 |
| Veto Counter | 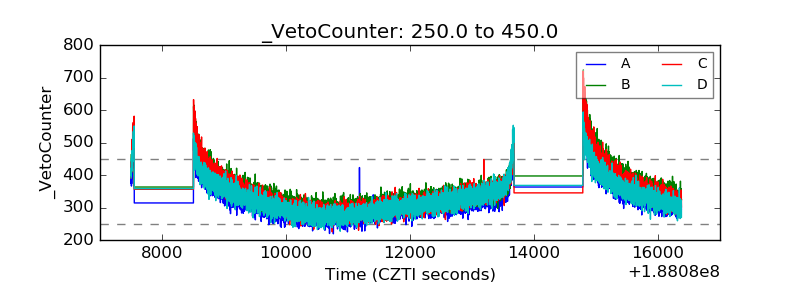 |