| Param | Original file | Final file |
|---|---|---|
| Filename | modeM0/AS1G04_007T02_9000000220_01199cztM0_level2.evt | modeM0/AS1G04_007T02_9000000220_01199cztM0_level2_quad_clean.evt |
| Size (bytes) | 986,693,760 | 100,906,560 |
| Size | 941.0 MB | 96.2 MB |
| Events in quadrant A | 7,328,994 | 664,403 |
| Events in quadrant B | 7,644,641 | 669,078 |
| Events in quadrant C | 7,361,489 | 646,545 |
| Events in quadrant D | 7,122,892 | 630,611 |
| Mode M9 | |||
|---|---|---|---|
| Quadrant | BADHDUFLAG | Total packets | Discarded packets |
| A | 0 | 12 | 0 |
| B | 0 | 12 | 0 |
| C | 0 | 12 | 0 |
| D | 0 | 12 | 0 |
| Mode M0 | |||
|---|---|---|---|
| Quadrant | BADHDUFLAG | Total packets | Discarded packets |
| A | 0 | 26334 | 2 |
| B | 0 | 27197 | 1 |
| C | 0 | 26416 | 1 |
| D | 0 | 25745 | 1 |
| Mode SS | |||
|---|---|---|---|
| Quadrant | BADHDUFLAG | Total packets | Discarded packets |
| A | 0 | 130 | 0 |
| B | 0 | 130 | 0 |
| C | 0 | 130 | 0 |
| D | 0 | 130 | 0 |
| Quadrant | Total seconds | Saturated seconds | Saturation percentage |
|---|---|---|---|
| A | 6383 | 21 | 0.328999% |
| B | 6383 | 5 | 0.078333% |
| C | 6383 | 4 | 0.062666% |
| D | 6383 | 4 | 0.062666% |
Noise dominated data is calculated using 1-second bins in cleaned event files. If a bin has >2000 counts, and if more than 50% of those come from <1% of pixels, then it is considered to be noise-dominated and hence unusable.
| Quadrant | # 1 sec bins | Bins with >0 counts | Bins with >2000 counts | High rate bins dominated by noise | Noise dominated (total time) | Noise dominated (detector-on time) | Marked lightcurve |
|---|---|---|---|---|---|---|---|
| A | 7577 | 6382 | 152 | 152 | 2.01% | 2.38% | 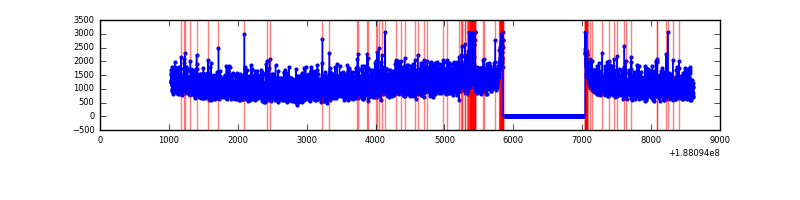 |
| B | 7577 | 6382 | 155 | 155 | 2.05% | 2.43% | 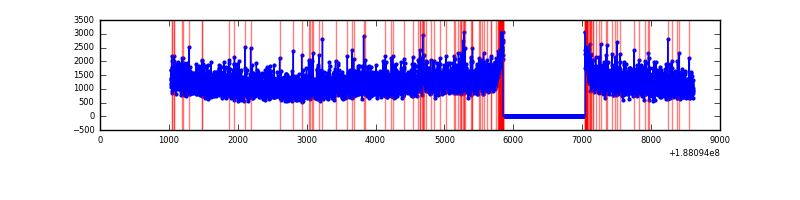 |
| C | 7578 | 6383 | 114 | 114 | 1.50% | 1.79% | 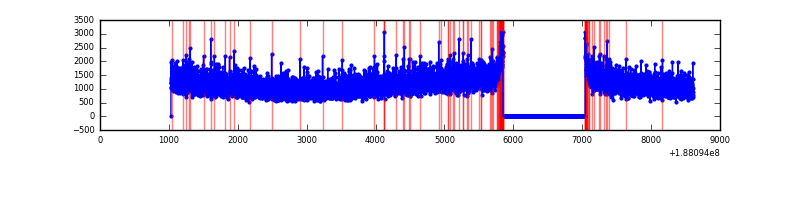 |
| D | 7577 | 6382 | 102 | 102 | 1.35% | 1.60% | 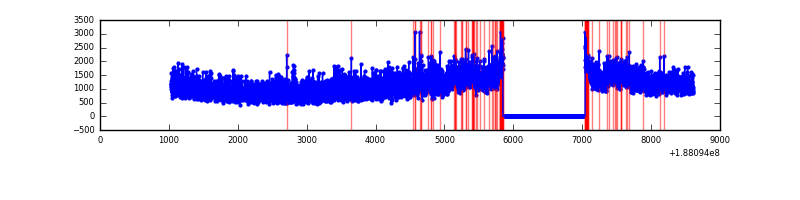 |
Top three noisy pixels from each quadrant. If the there are fewer than three noisy pixels in the level2.evt file, extra rows are filled as -1
| Pixel properties | Quadrant properties | ||||||
|---|---|---|---|---|---|---|---|
| Quadrant | DetID | PixID | Counts | Sigma | Mean | Median | Sigma |
| A | 4 | 32 | 100741 | 220.48 | 1881 | 1900 | 448.3 |
| A | 11 | 79 | 7841 | 13.25 | 1881 | 1900 | 448.3 |
| A | 3 | 111 | 6429 | 10.1 | 1881 | 1900 | 448.3 |
| B | 6 | 53 | 45851 | 94.85 | 1979 | 1991 | 462.4 |
| B | 7 | 221 | 32926 | 66.9 | 1979 | 1991 | 462.4 |
| B | 8 | 219 | 19500 | 37.86 | 1979 | 1991 | 462.4 |
| C | 15 | 241 | 340760 | 694.03 | 1768 | 1831 | 488.4 |
| C | 9 | 83 | 64699 | 128.74 | 1768 | 1831 | 488.4 |
| C | 3 | 111 | 21436 | 40.15 | 1768 | 1831 | 488.4 |
| D | 1 | 239 | 529084 | 1007.08 | 1698 | 1759 | 523.6 |
| D | 12 | 22 | 178275 | 337.11 | 1698 | 1759 | 523.6 |
| D | 1 | 83 | 36225 | 65.82 | 1698 | 1759 | 523.6 |
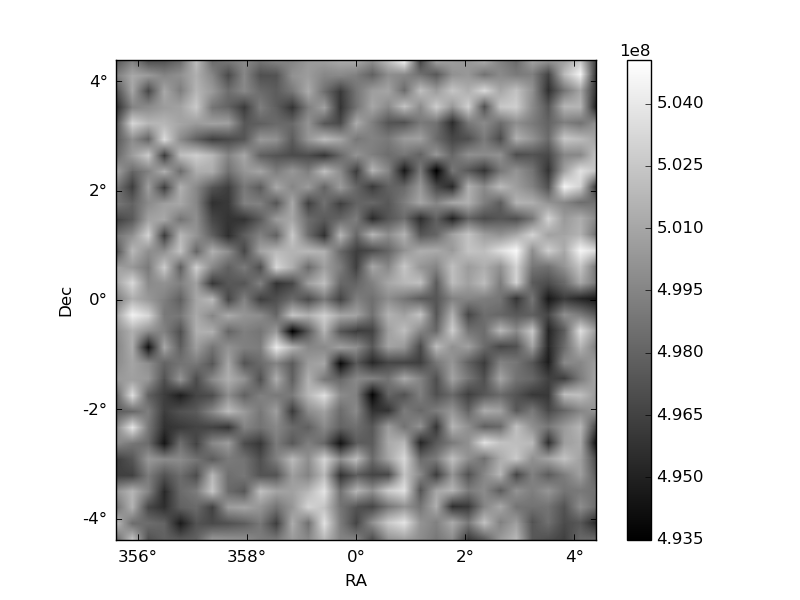
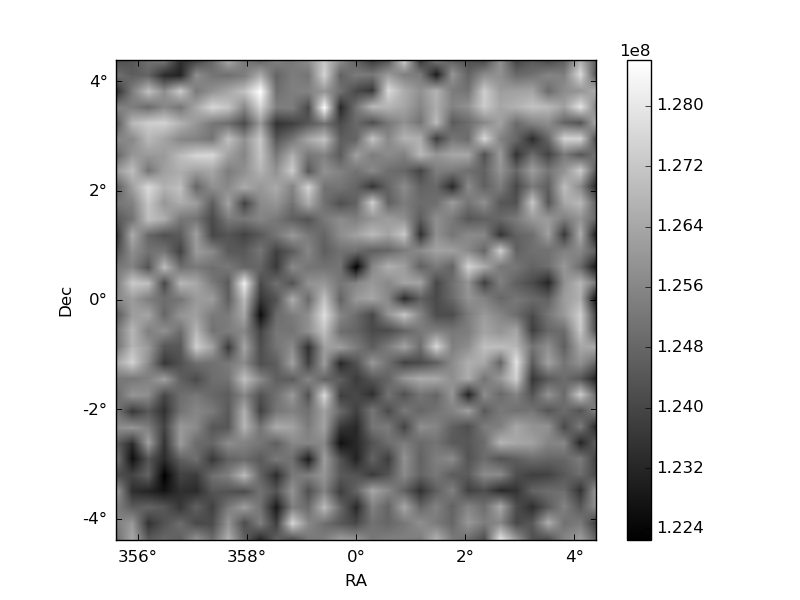
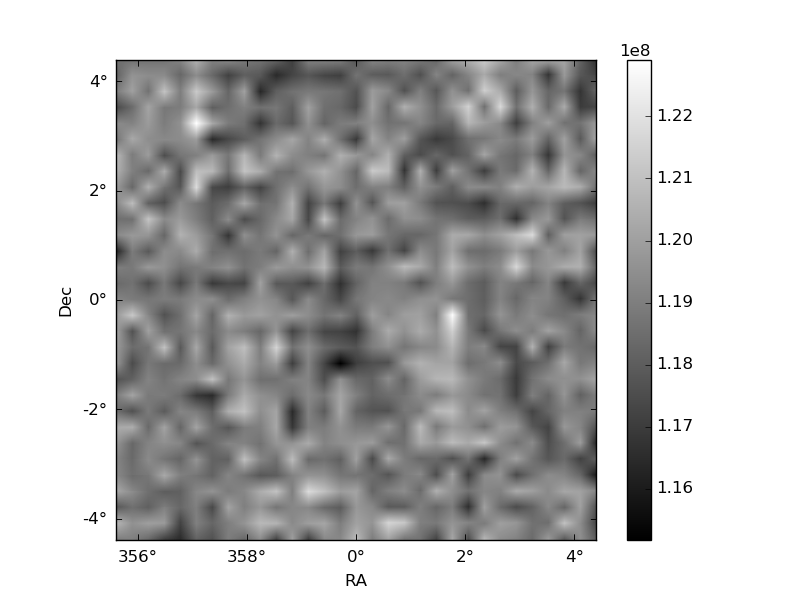
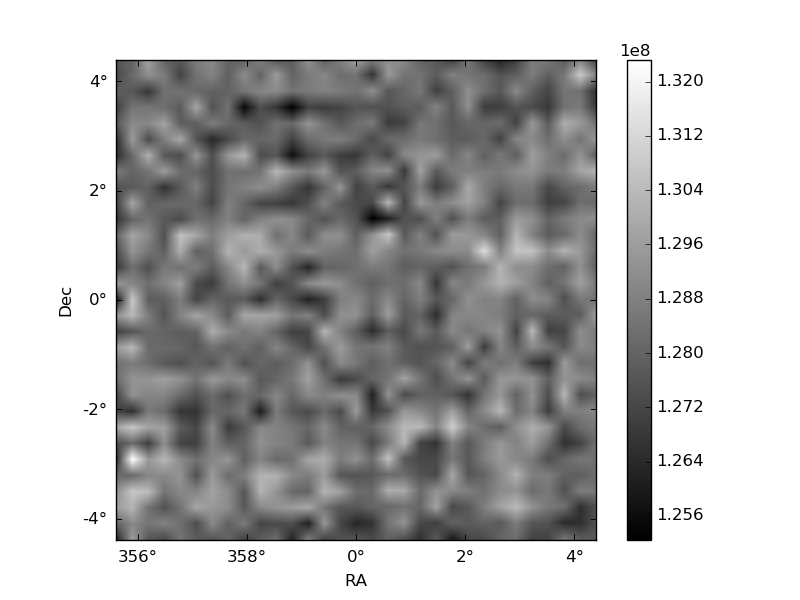
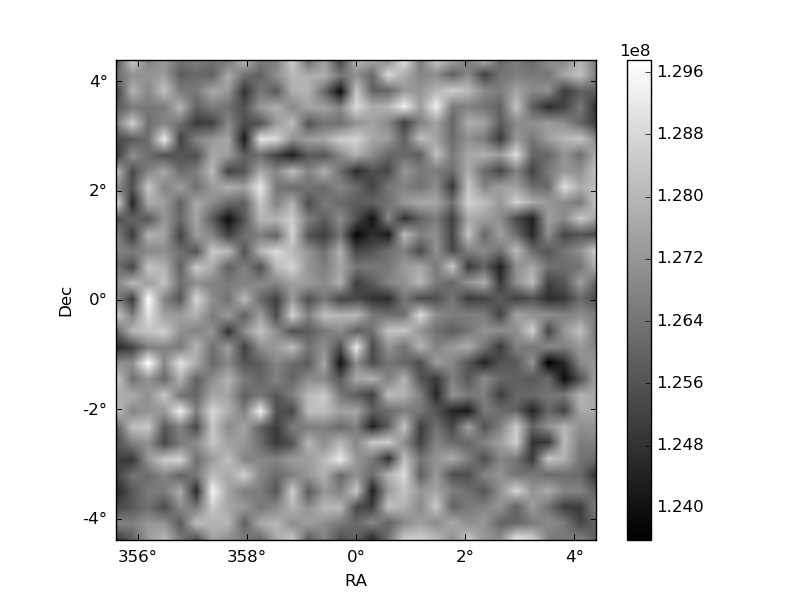
Histogram calculated using DETX and DETY for each event in the final _common_clean file
| Quadrant A | 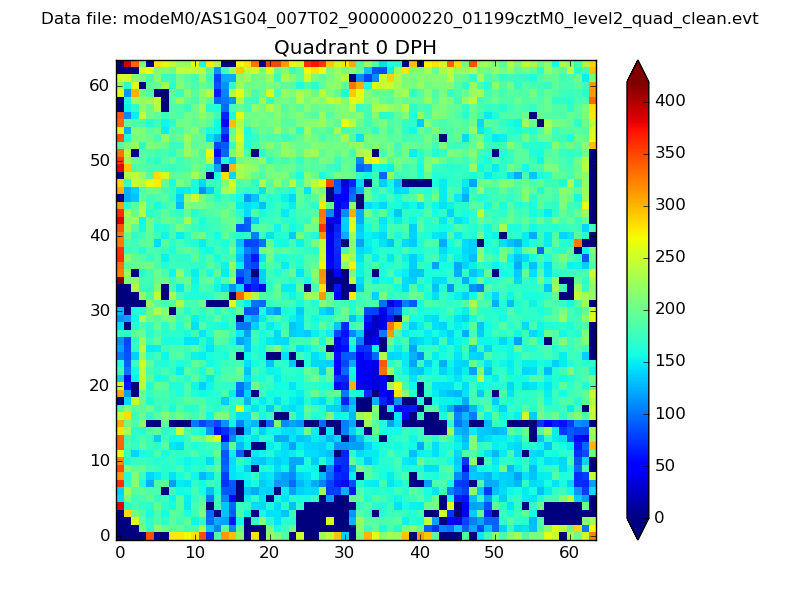 |
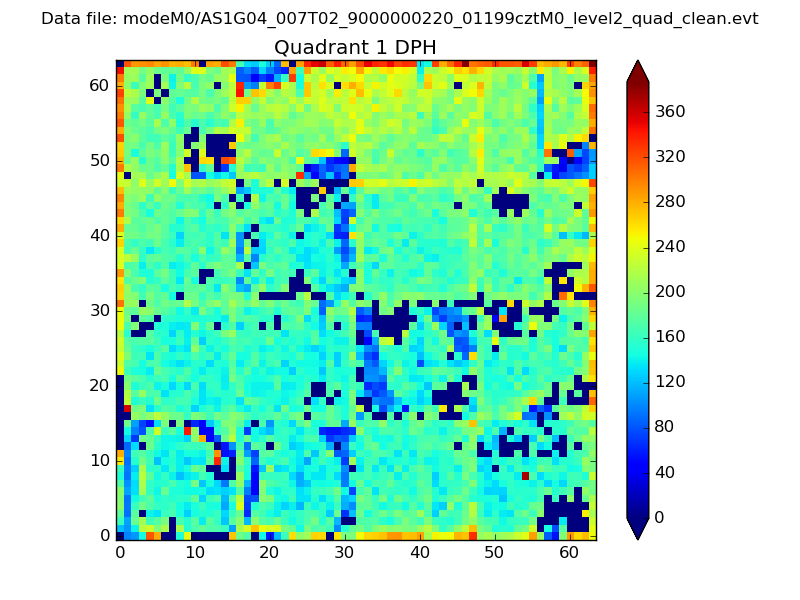 |
Quadrant B |
|---|---|---|---|
| Quadrant D | 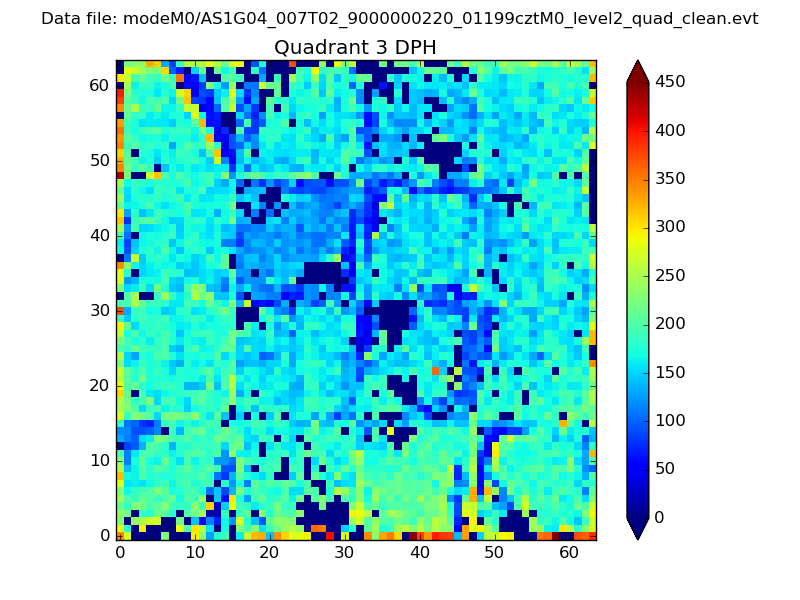 |
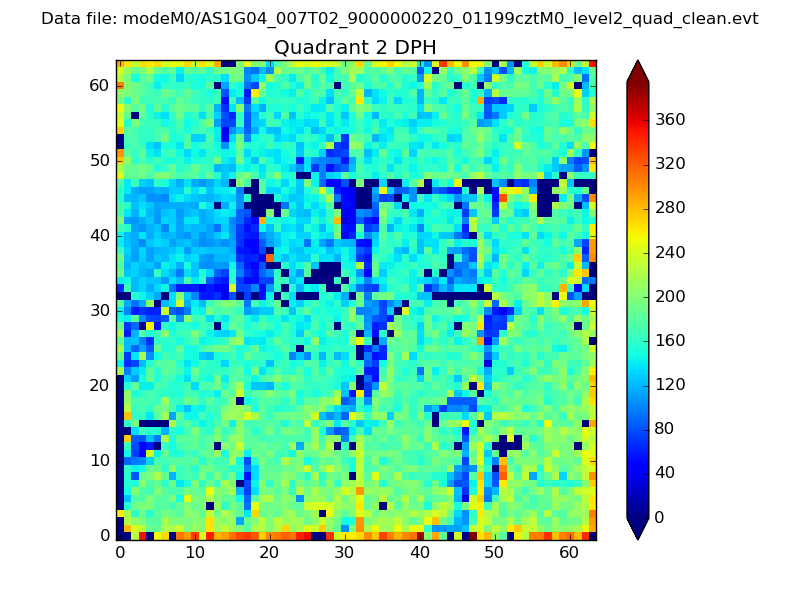 |
Quadrant C |
| Plot type | Count rate plots | Images |
|---|---|---|
| Comparison with Poisson distribution Blue bars denote a histogram of data divided into 1 sec bins. Red curve is a Poisson curve with rate = median count rate of data. |
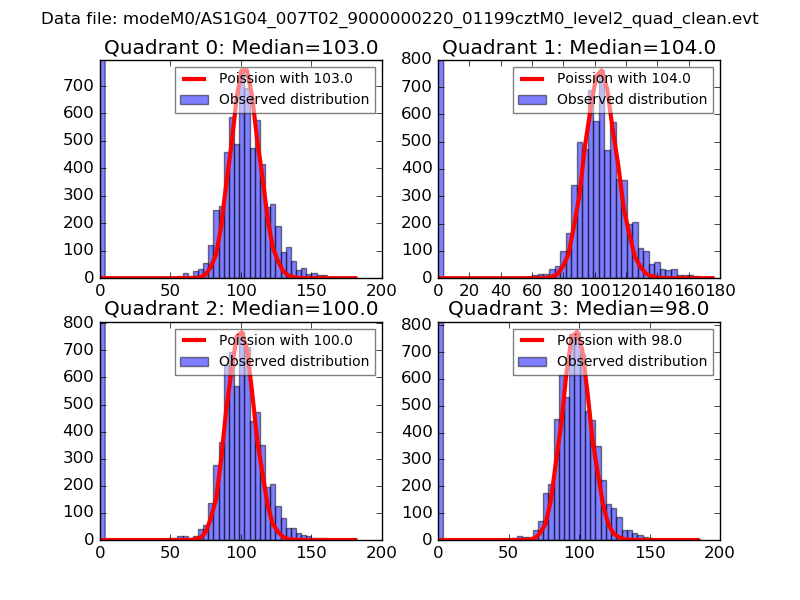 |
 |
| Quadrant-wise count rates Data is divided into 100 sec bins |
 |
|
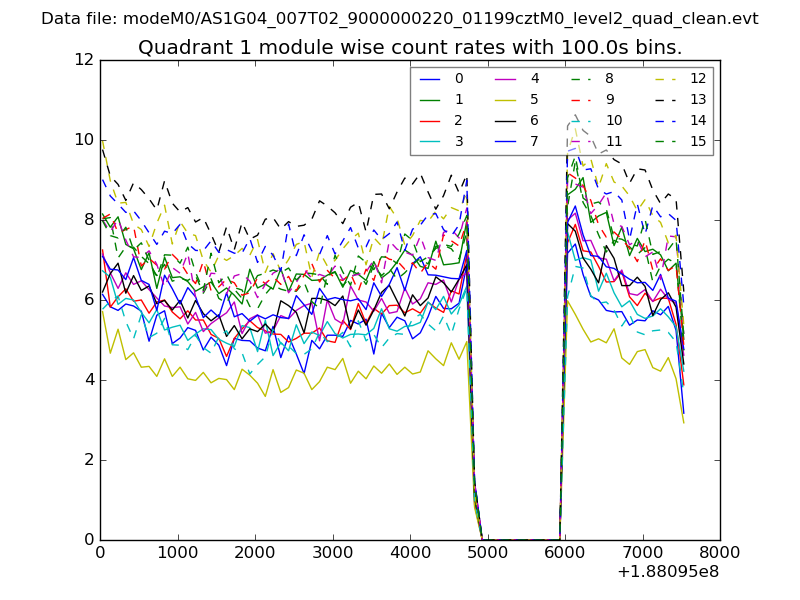
| Module-wise count rates for Quadrant A Data is divided into 100 sec bins |
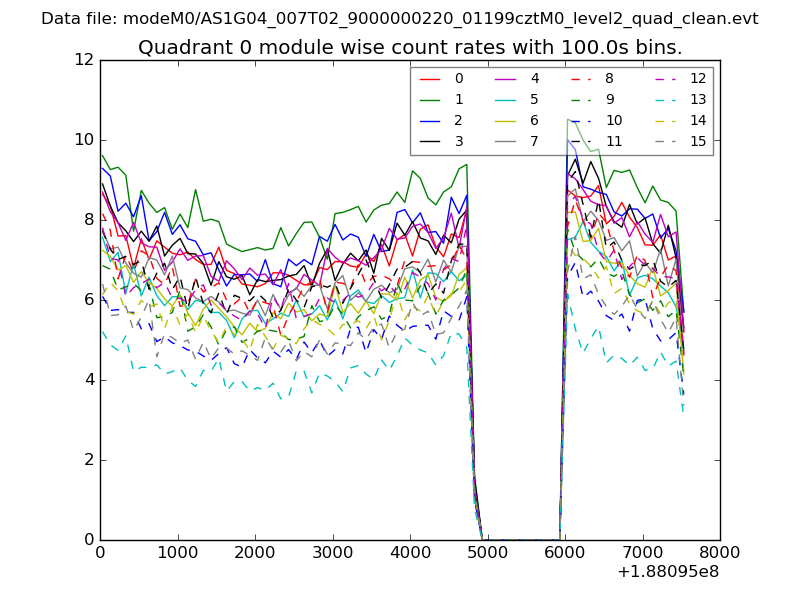 |
 |
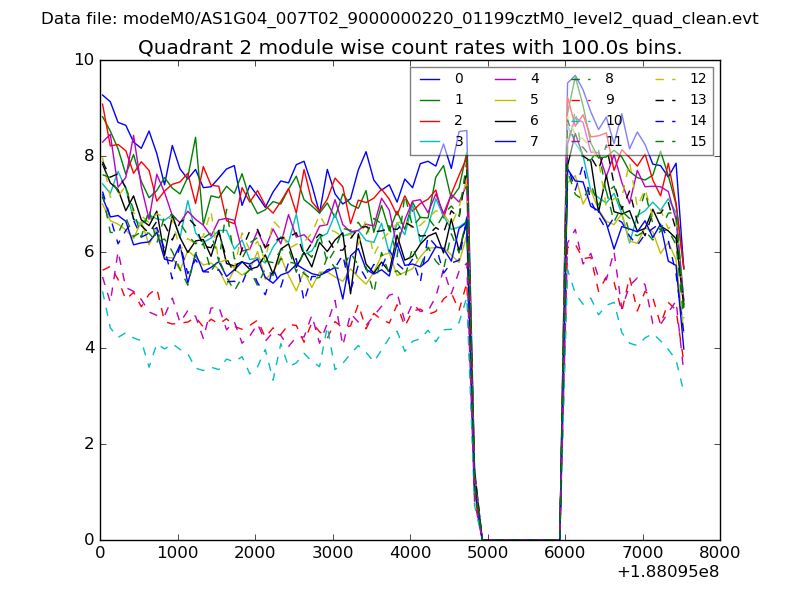
| Module-wise count rates for Quadrant B Data is divided into 100 sec bins |
 |
 |
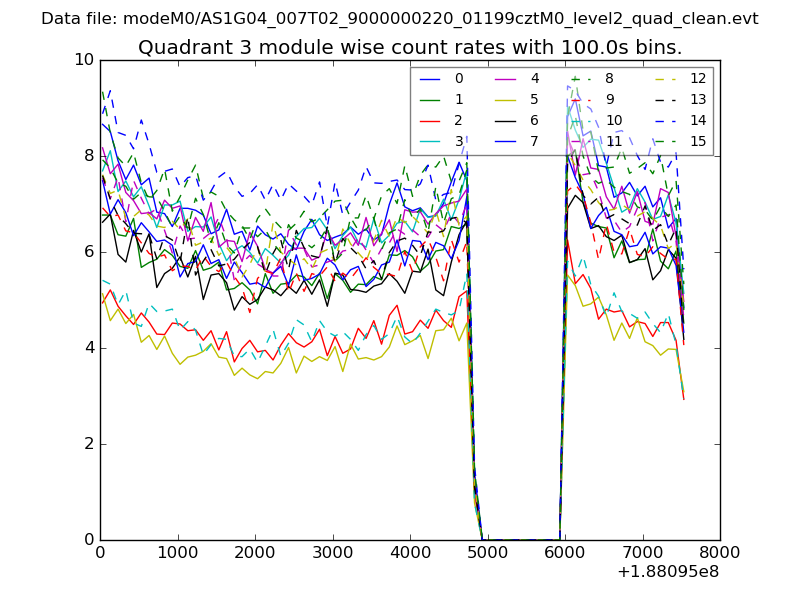
| Module-wise count rates for Quadrant C Data is divided into 100 sec bins |
 |
 |
| Module-wise count rates for Quadrant D Data is divided into 100 sec bins |
 |
 |
| Parameter | Plot |
|---|---|
| CZT HV Monitor | 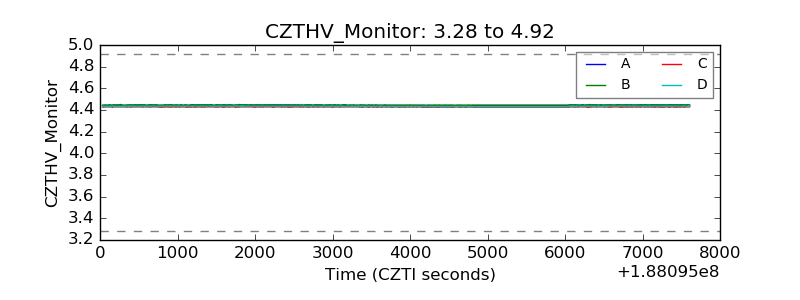 |
| D_VDD | 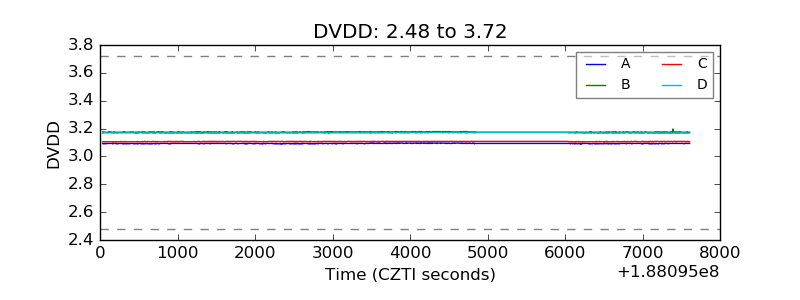 |
| Temperature 1 | 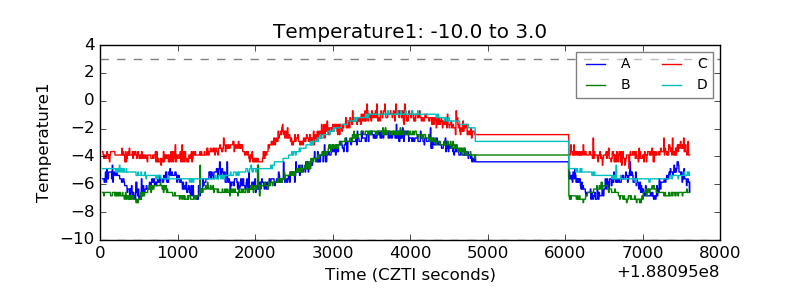 |
| Veto HV Monitor | 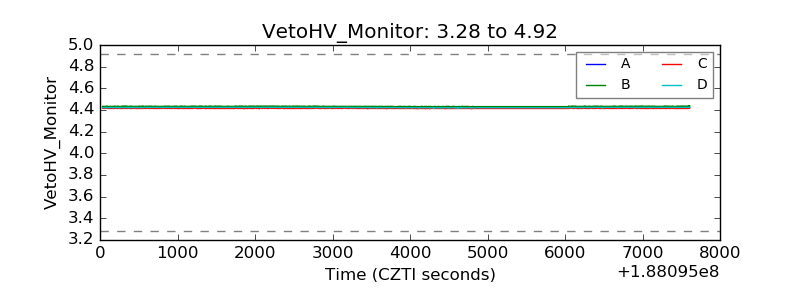 |
| Veto LLD | 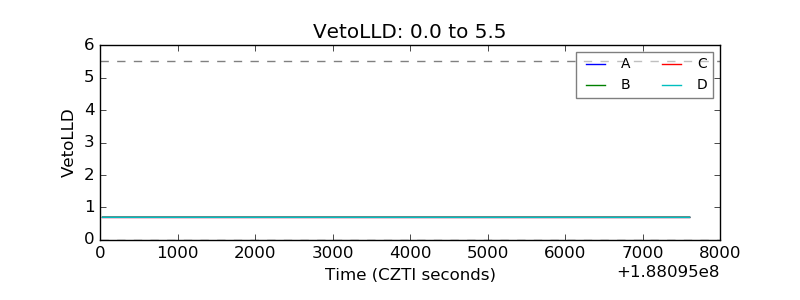 |
| Alpha Counter | 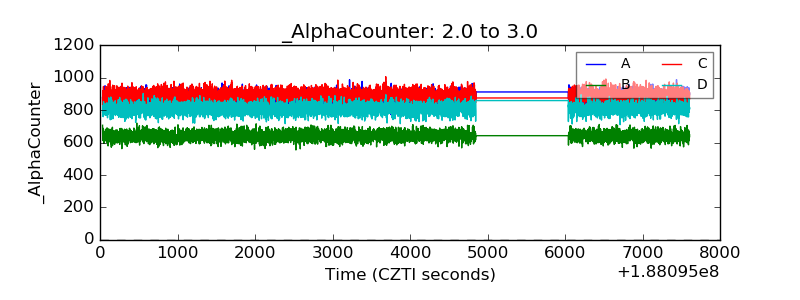 |
| _CPM_Rate | 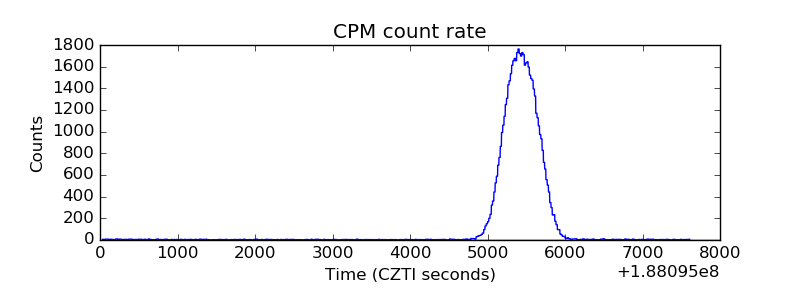 |
| CZT Counter | 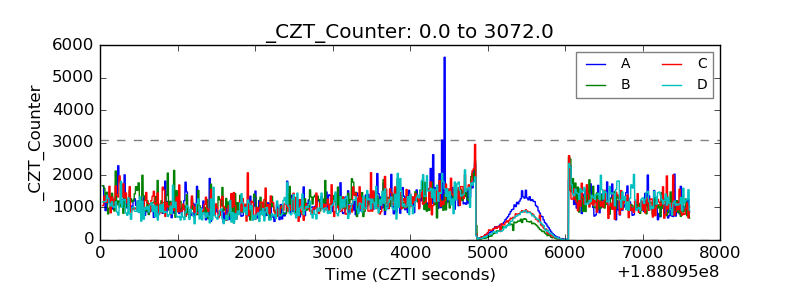 |
| +2.5 Volts monitor |  |
| +5 Volts monitor |  |
| _ROLL_ROT | 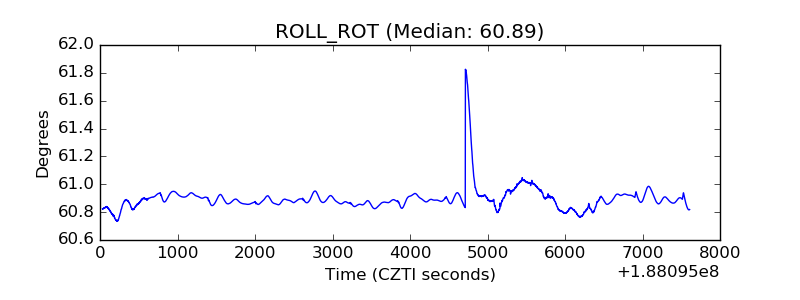 |
| _Roll_DEC | 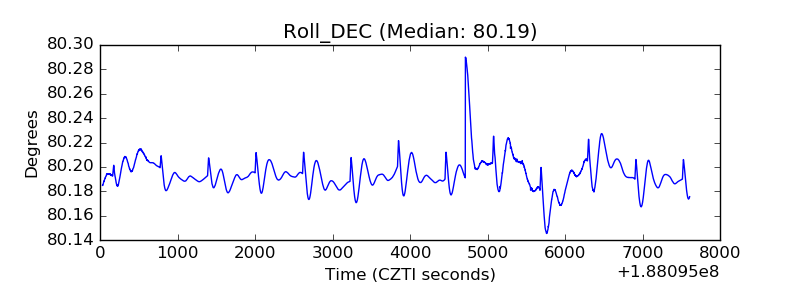 |
| _Roll_RA | 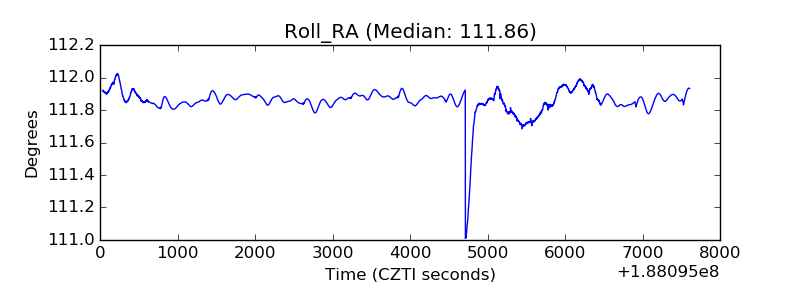 |
| Veto Counter | 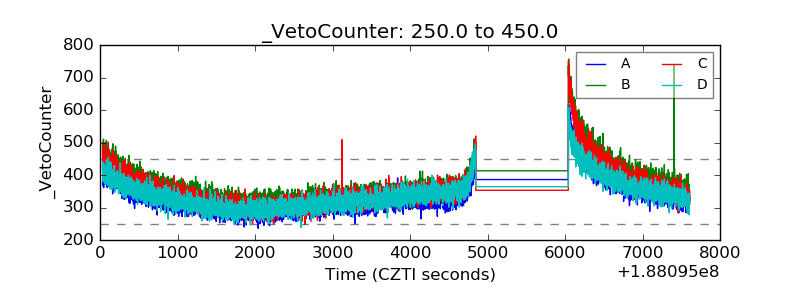 |