| Param | Original file | Final file |
|---|---|---|
| Filename | modeM0/AS1G04_007T02_9000000220_01201cztM0_level2.evt | modeM0/AS1G04_007T02_9000000220_01201cztM0_level2_quad_clean.evt |
| Size (bytes) | 853,842,240 | 88,620,480 |
| Size | 814.3 MB | 84.5 MB |
| Events in quadrant A | 6,523,447 | 589,268 |
| Events in quadrant B | 6,781,722 | 591,067 |
| Events in quadrant C | 6,427,370 | 561,893 |
| Events in quadrant D | 5,760,167 | 556,437 |
| Mode M9 | |||
|---|---|---|---|
| Quadrant | BADHDUFLAG | Total packets | Discarded packets |
| A | 0 | 12 | 0 |
| B | 0 | 12 | 0 |
| C | 0 | 12 | 0 |
| D | 0 | 12 | 0 |
| Mode M0 | |||
|---|---|---|---|
| Quadrant | BADHDUFLAG | Total packets | Discarded packets |
| A | 0 | 23511 | 219 |
| B | 0 | 24260 | 231 |
| C | 0 | 23175 | 197 |
| D | 0 | 21212 | 144 |
| Mode SS | |||
|---|---|---|---|
| Quadrant | BADHDUFLAG | Total packets | Discarded packets |
| A | 0 | 114 | 0 |
| B | 0 | 114 | 2 |
| C | 0 | 114 | 2 |
| D | 0 | 114 | 0 |
| Quadrant | Total seconds | Saturated seconds | Saturation percentage |
|---|---|---|---|
| A | 5497 | 11 | 0.200109% |
| B | 5496 | 30 | 0.545852% |
| C | 5499 | 6 | 0.109111% |
| D | 5510 | 2 | 0.036298% |
Noise dominated data is calculated using 1-second bins in cleaned event files. If a bin has >2000 counts, and if more than 50% of those come from <1% of pixels, then it is considered to be noise-dominated and hence unusable.
| Quadrant | # 1 sec bins | Bins with >0 counts | Bins with >2000 counts | High rate bins dominated by noise | Noise dominated (total time) | Noise dominated (detector-on time) | Marked lightcurve |
|---|---|---|---|---|---|---|---|
| A | 6804 | 5514 | 171 | 171 | 2.51% | 3.10% | 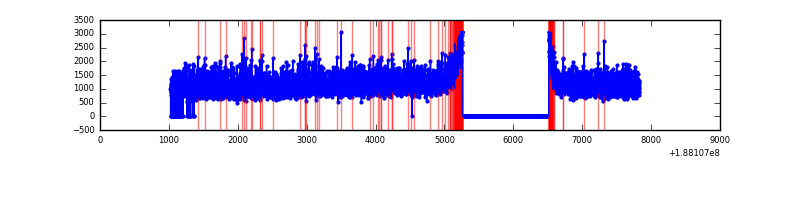 |
| B | 6803 | 5510 | 205 | 205 | 3.01% | 3.72% | 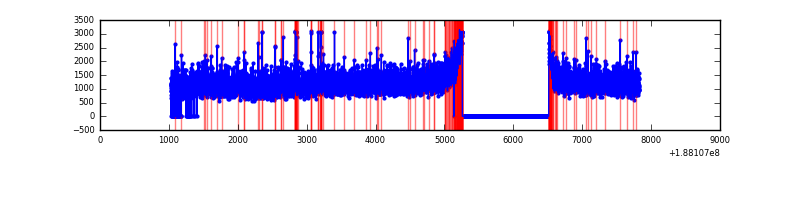 |
| C | 6804 | 5523 | 152 | 152 | 2.23% | 2.75% | 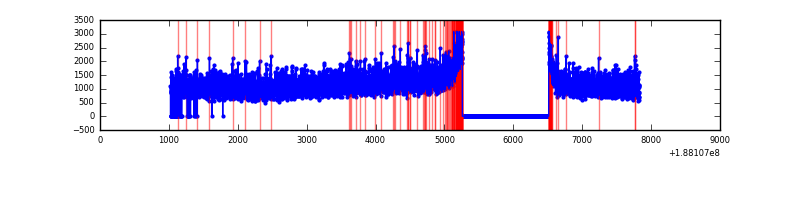 |
| D | 6803 | 5523 | 93 | 93 | 1.37% | 1.68% | 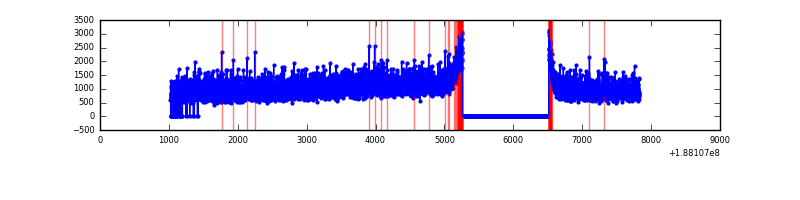 |
Top three noisy pixels from each quadrant. If the there are fewer than three noisy pixels in the level2.evt file, extra rows are filled as -1
| Pixel properties | Quadrant properties | ||||||
|---|---|---|---|---|---|---|---|
| Quadrant | DetID | PixID | Counts | Sigma | Mean | Median | Sigma |
| A | 12 | 243 | 15239 | 33.56 | 1694 | 1707 | 403.2 |
| A | 11 | 79 | 7354 | 14.01 | 1694 | 1707 | 403.2 |
| A | 4 | 32 | 6015 | 10.68 | 1694 | 1707 | 403.2 |
| B | 7 | 221 | 52004 | 123.55 | 1743 | 1751 | 406.7 |
| B | 5 | 191 | 31507 | 73.16 | 1743 | 1751 | 406.7 |
| B | 6 | 53 | 26172 | 60.04 | 1743 | 1751 | 406.7 |
| C | 15 | 241 | 287539 | 667.61 | 1554 | 1602 | 428.3 |
| C | 3 | 111 | 20098 | 43.18 | 1554 | 1602 | 428.3 |
| C | 3 | 79 | 19607 | 42.04 | 1554 | 1602 | 428.3 |
| D | 13 | 205 | 12239 | 22.5 | 1530 | 1584 | 473.5 |
| D | 2 | 16 | 12172 | 22.36 | 1530 | 1584 | 473.5 |
| D | 10 | 84 | 11760 | 21.49 | 1530 | 1584 | 473.5 |
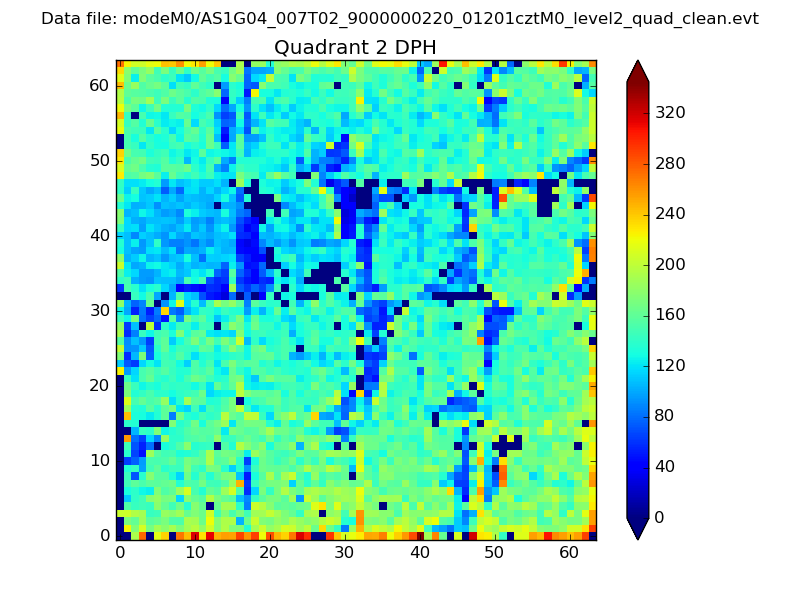
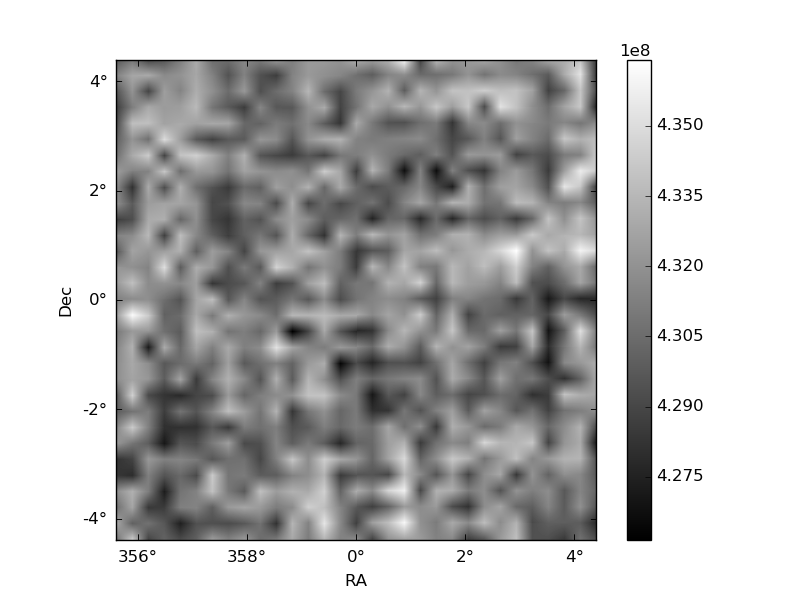
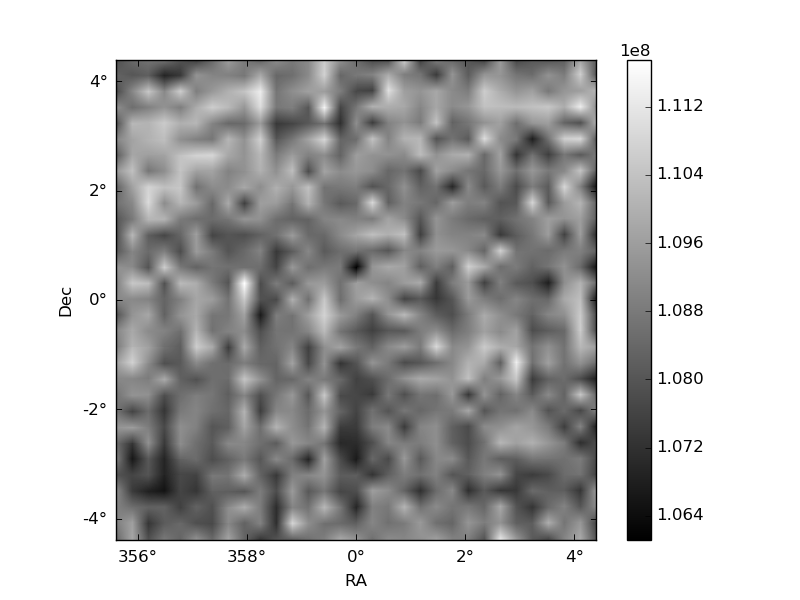
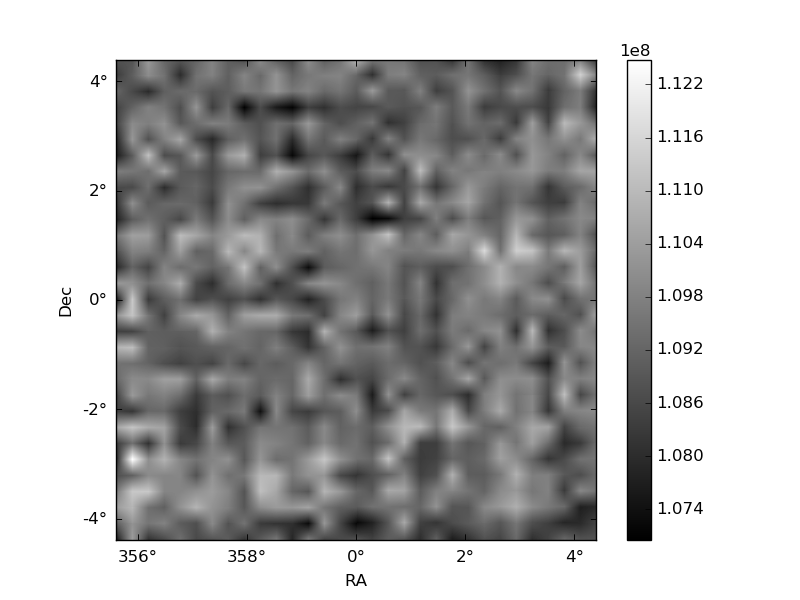
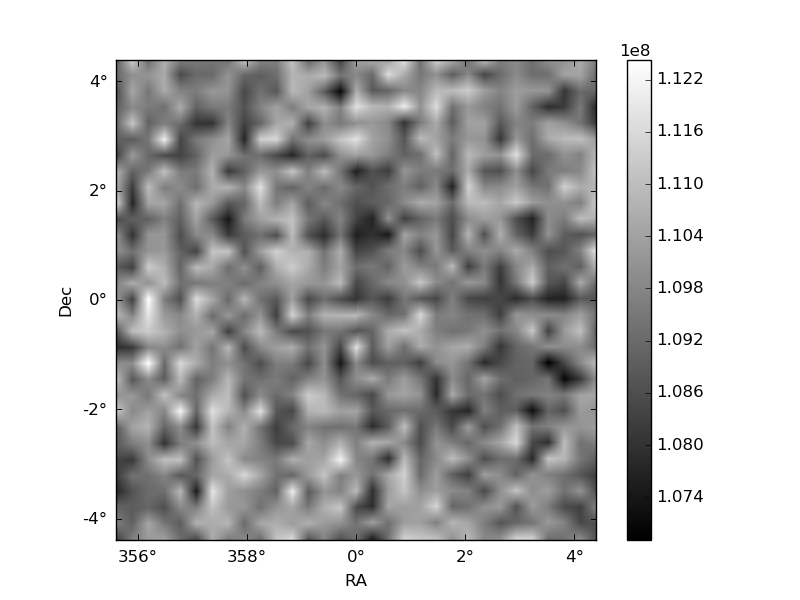
Histogram calculated using DETX and DETY for each event in the final _common_clean file
| Quadrant A | 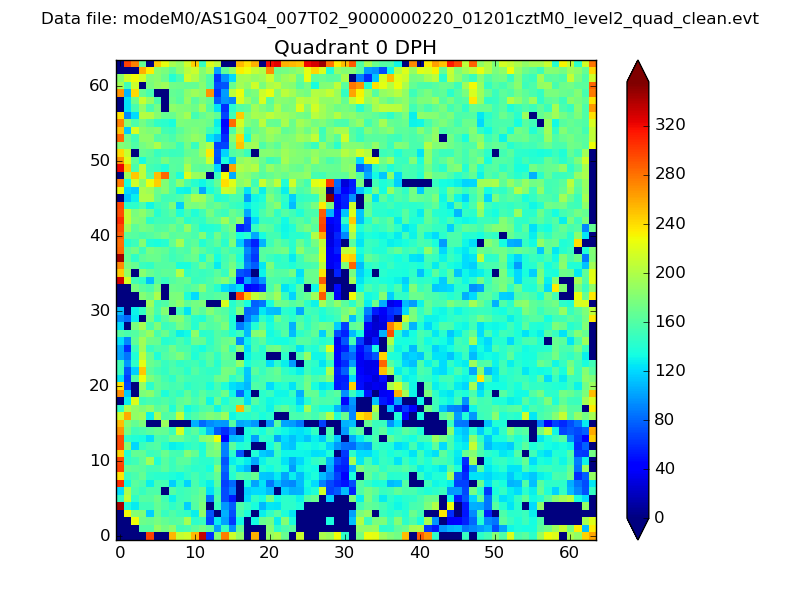 |
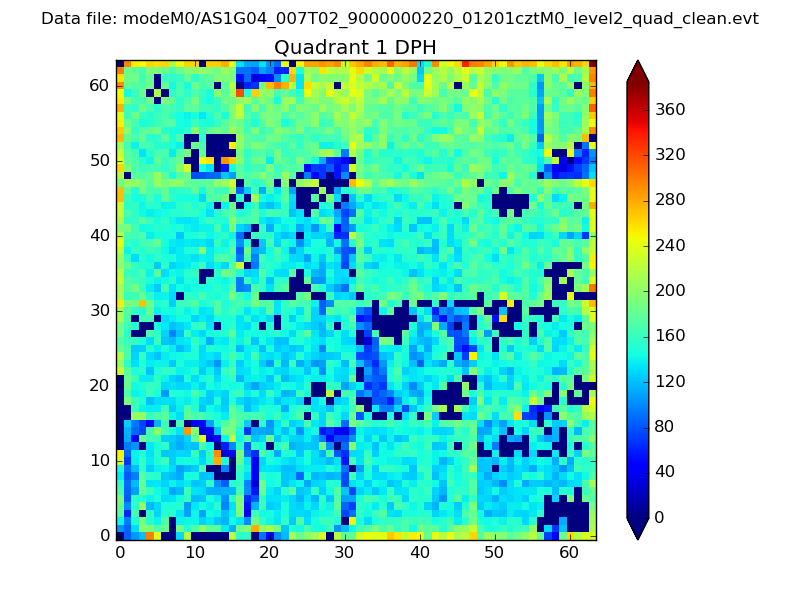 |
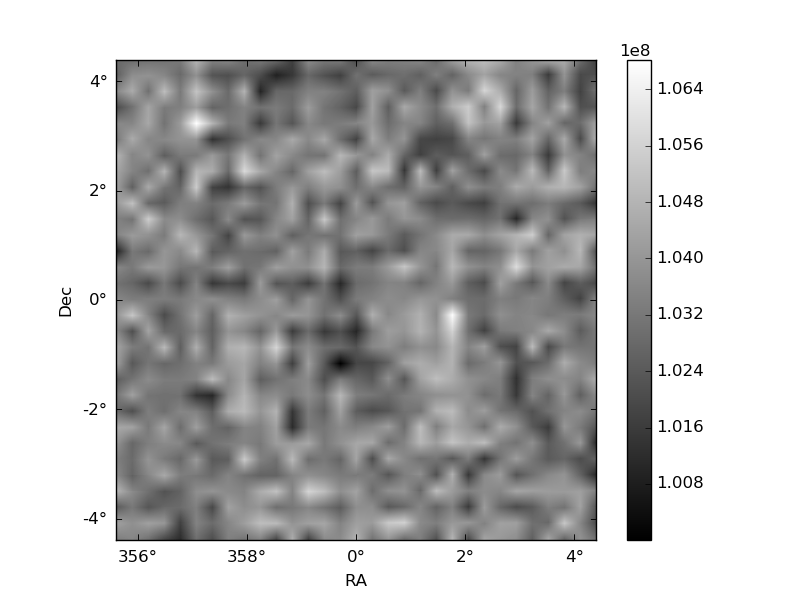
Quadrant B |
|---|---|---|---|
| Quadrant D | 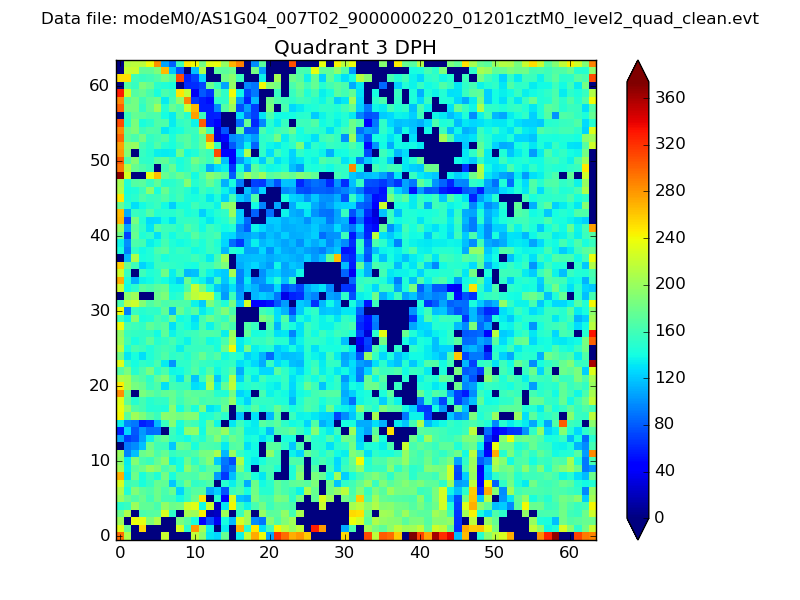 |
 |
Quadrant C |
| Plot type | Count rate plots | Images |
|---|---|---|
| Comparison with Poisson distribution Blue bars denote a histogram of data divided into 1 sec bins. Red curve is a Poisson curve with rate = median count rate of data. |
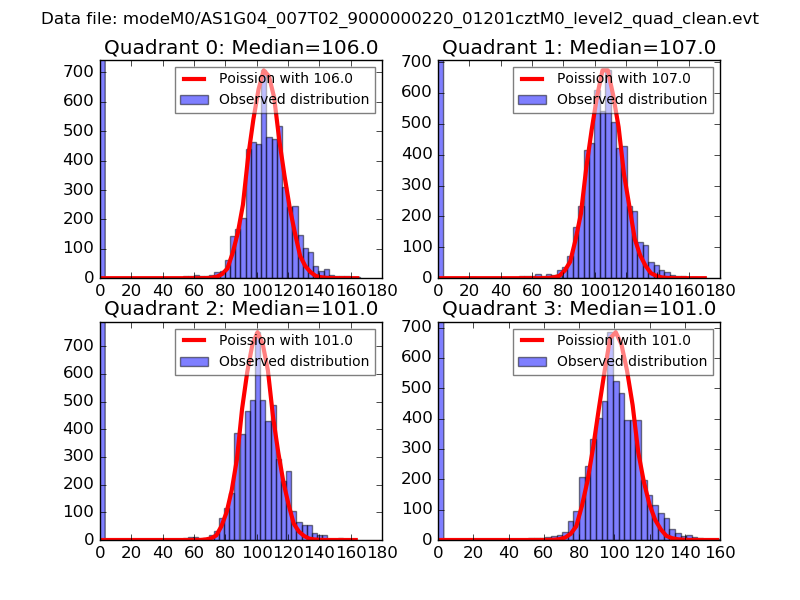 |
 |
| Quadrant-wise count rates Data is divided into 100 sec bins |
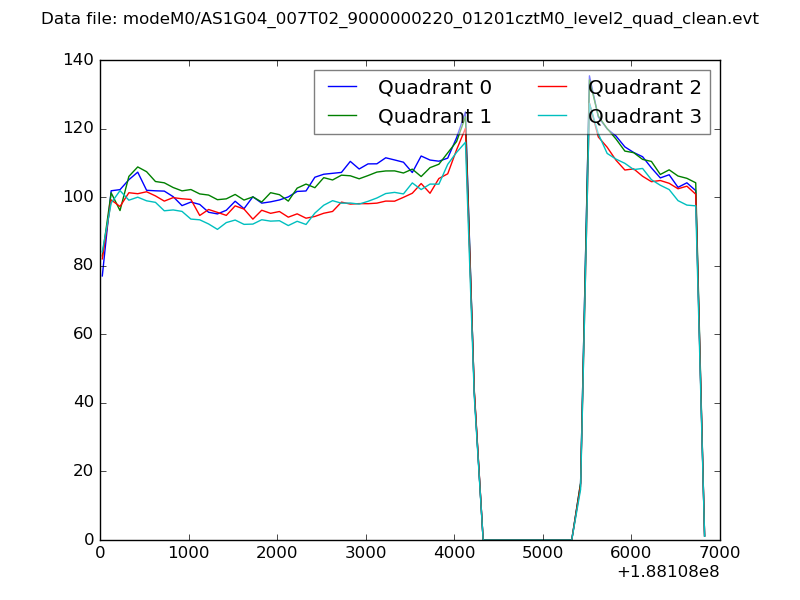 |
|
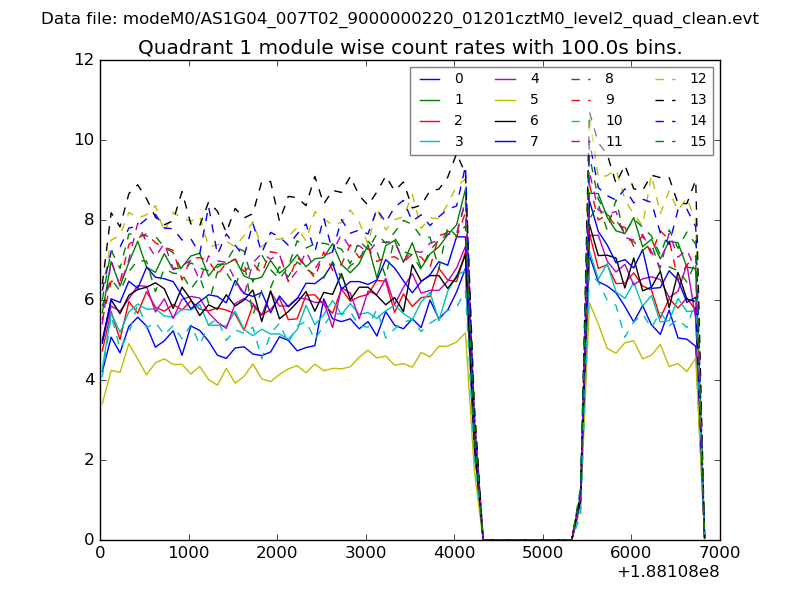
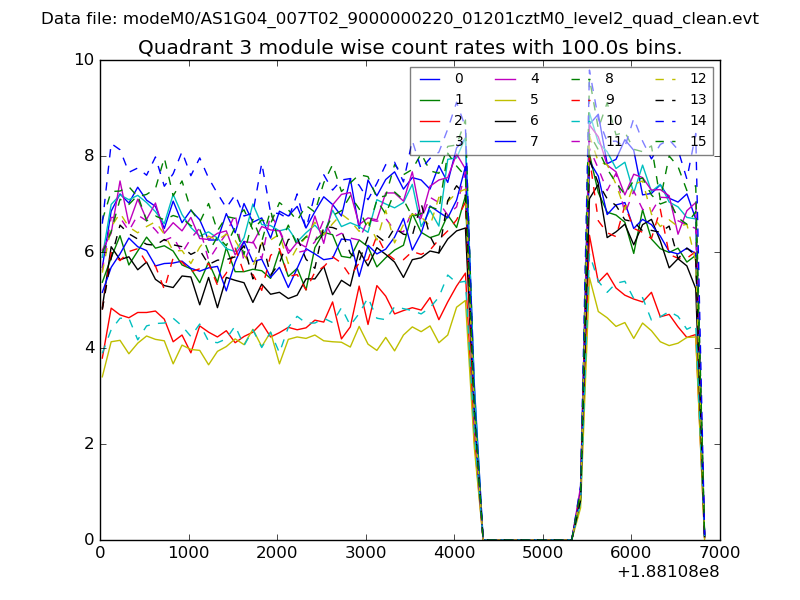
| Module-wise count rates for Quadrant A Data is divided into 100 sec bins |
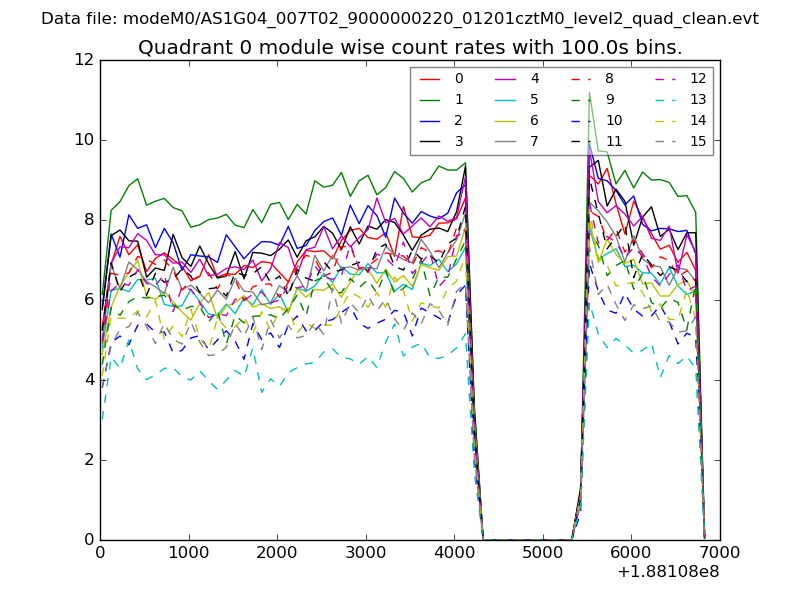 |
 |
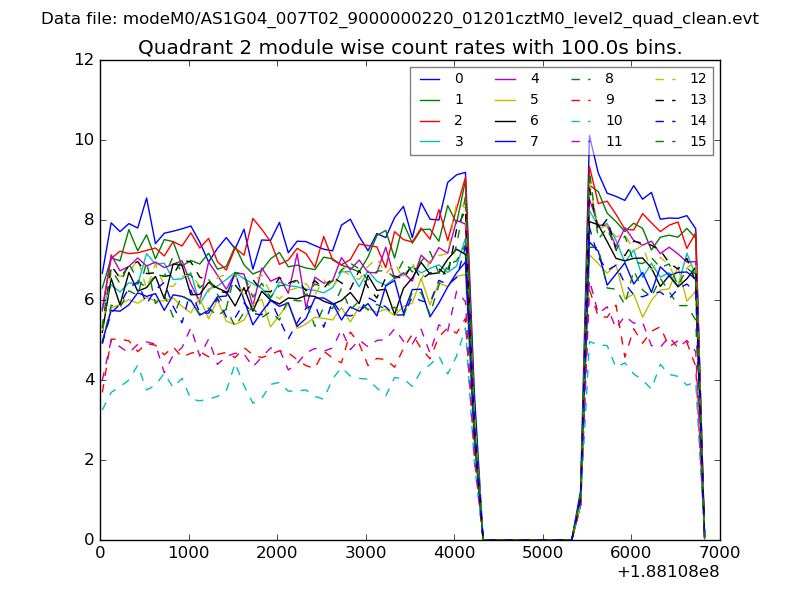
| Module-wise count rates for Quadrant B Data is divided into 100 sec bins |
 |
 |
| Module-wise count rates for Quadrant C Data is divided into 100 sec bins |
 |
 |
| Module-wise count rates for Quadrant D Data is divided into 100 sec bins |
 |
 |
| Parameter | Plot |
|---|---|
| CZT HV Monitor | 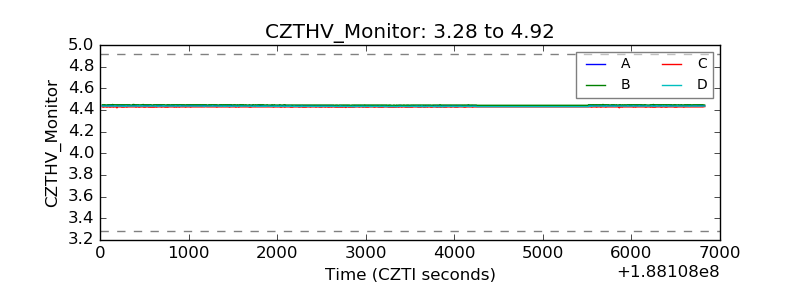 |
| D_VDD | 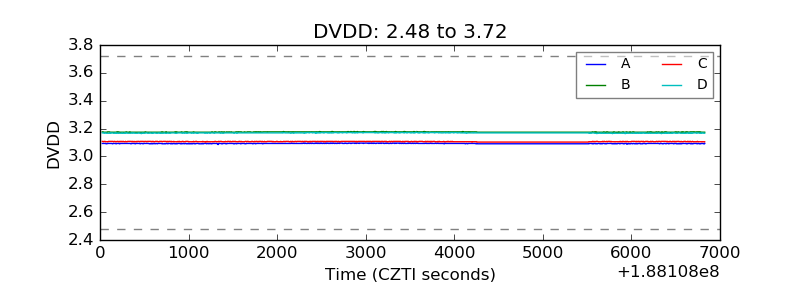 |
| Temperature 1 | 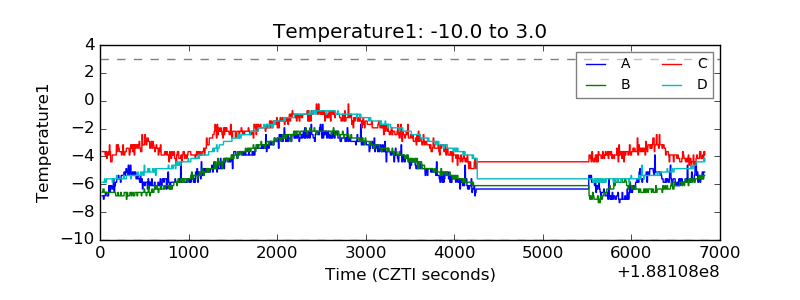 |
| Veto HV Monitor | 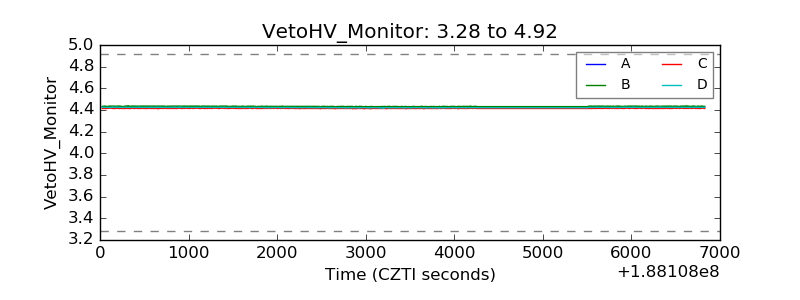 |
| Veto LLD | 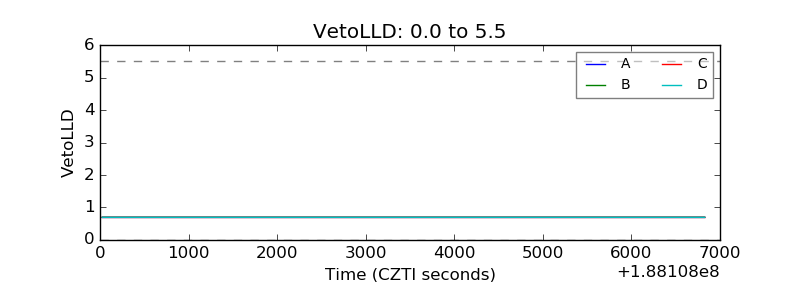 |
| Alpha Counter | 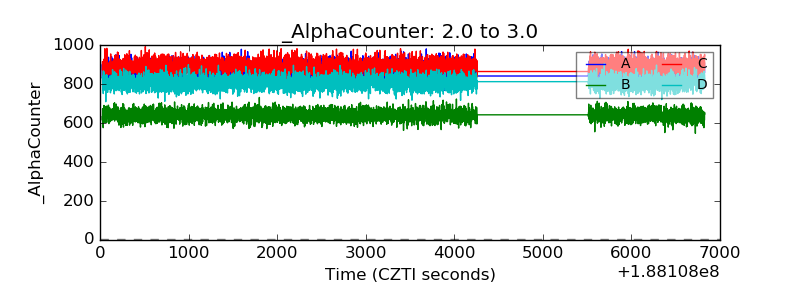 |
| _CPM_Rate | 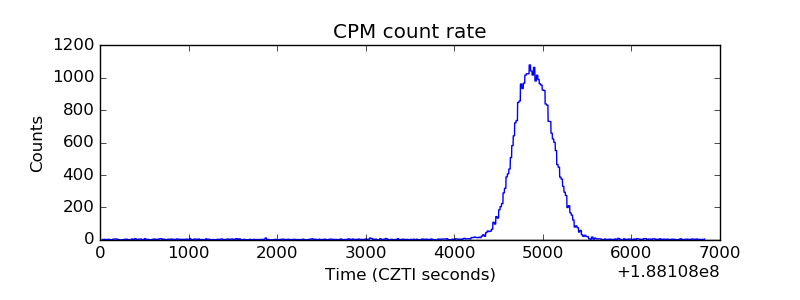 |
| CZT Counter | 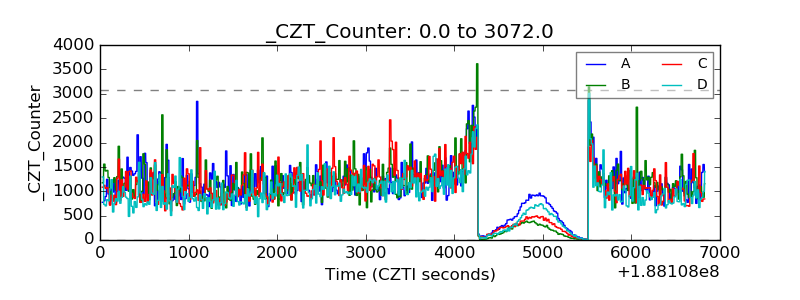 |
| +2.5 Volts monitor |  |
| +5 Volts monitor | 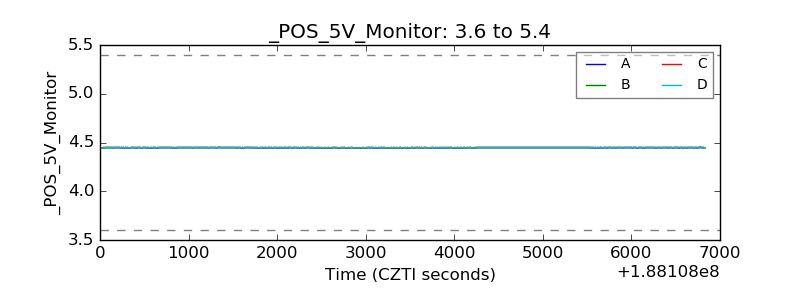 |
| _ROLL_ROT | 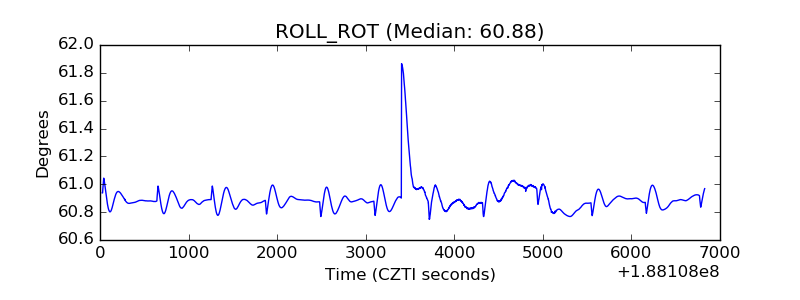 |
| _Roll_DEC | 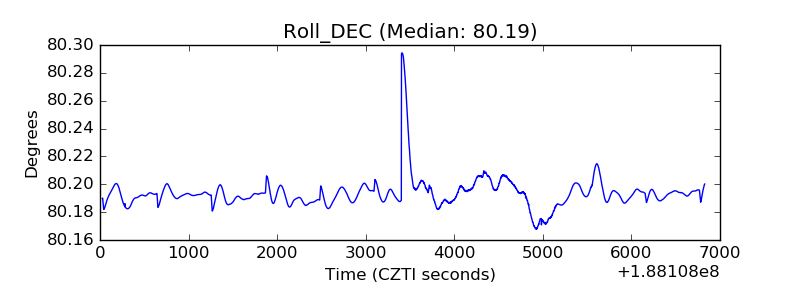 |
| _Roll_RA | 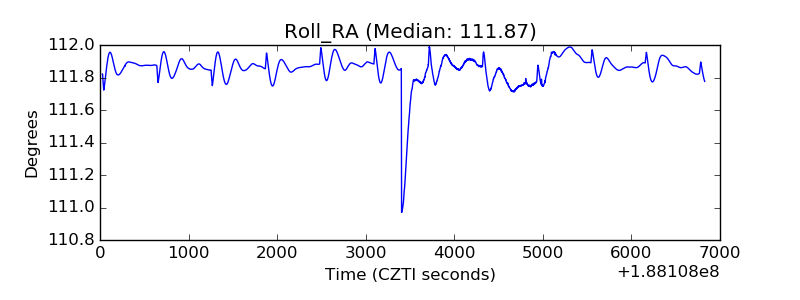 |
| Veto Counter | 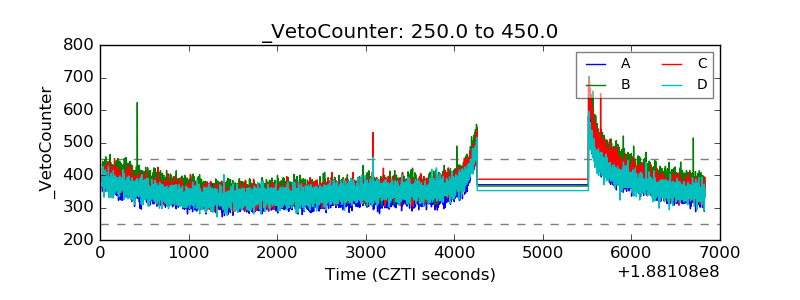 |