| Param | Original file | Final file |
|---|---|---|
| Filename | modeM0/AS1G04_007T02_9000000220_01202cztM0_level2.evt | modeM0/AS1G04_007T02_9000000220_01202cztM0_level2_quad_clean.evt |
| Size (bytes) | 960,016,320 | 94,691,520 |
| Size | 915.5 MB | 90.3 MB |
| Events in quadrant A | 7,301,304 | 628,281 |
| Events in quadrant B | 7,407,838 | 631,057 |
| Events in quadrant C | 7,034,928 | 599,154 |
| Events in quadrant D | 6,931,652 | 589,870 |
| Mode M9 | |||
|---|---|---|---|
| Quadrant | BADHDUFLAG | Total packets | Discarded packets |
| A | 0 | 11 | 0 |
| B | 0 | 11 | 0 |
| C | 0 | 11 | 0 |
| D | 0 | 11 | 0 |
| Mode M0 | |||
|---|---|---|---|
| Quadrant | BADHDUFLAG | Total packets | Discarded packets |
| A | 0 | 25944 | 2 |
| B | 0 | 26241 | 1 |
| C | 0 | 25136 | 1 |
| D | 0 | 24868 | 1 |
| Mode SS | |||
|---|---|---|---|
| Quadrant | BADHDUFLAG | Total packets | Discarded packets |
| A | 0 | 124 | 0 |
| B | 0 | 124 | 0 |
| C | 0 | 124 | 0 |
| D | 0 | 124 | 0 |
| Quadrant | Total seconds | Saturated seconds | Saturation percentage |
|---|---|---|---|
| A | 5998 | 23 | 0.383461% |
| B | 5998 | 24 | 0.400133% |
| C | 5998 | 9 | 0.150050% |
| D | 5998 | 22 | 0.366789% |
Noise dominated data is calculated using 1-second bins in cleaned event files. If a bin has >2000 counts, and if more than 50% of those come from <1% of pixels, then it is considered to be noise-dominated and hence unusable.
| Quadrant | # 1 sec bins | Bins with >0 counts | Bins with >2000 counts | High rate bins dominated by noise | Noise dominated (total time) | Noise dominated (detector-on time) | Marked lightcurve |
|---|---|---|---|---|---|---|---|
| A | 7182 | 5997 | 216 | 216 | 3.01% | 3.60% | 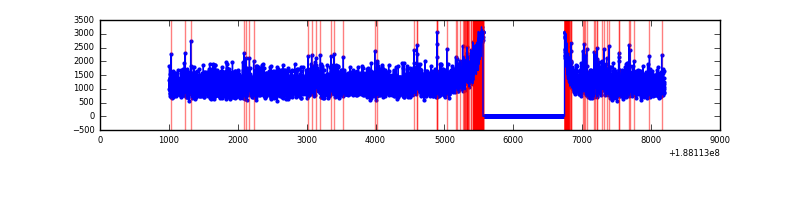 |
| B | 7183 | 5998 | 250 | 250 | 3.48% | 4.17% | 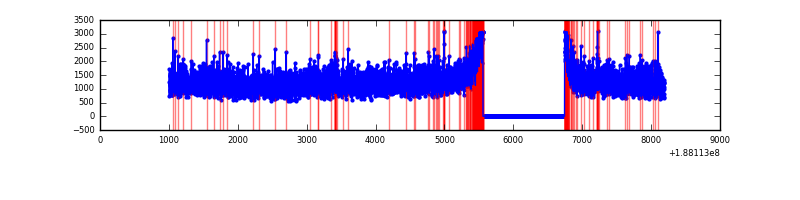 |
| C | 7183 | 5999 | 192 | 192 | 2.67% | 3.20% | 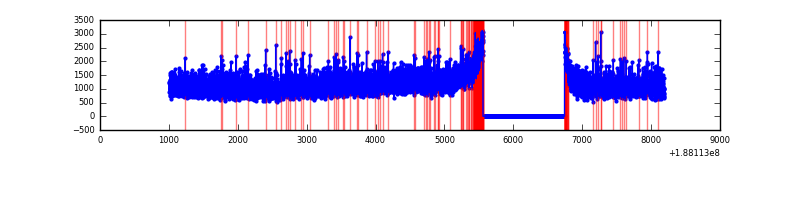 |
| D | 7182 | 5998 | 215 | 215 | 2.99% | 3.58% | 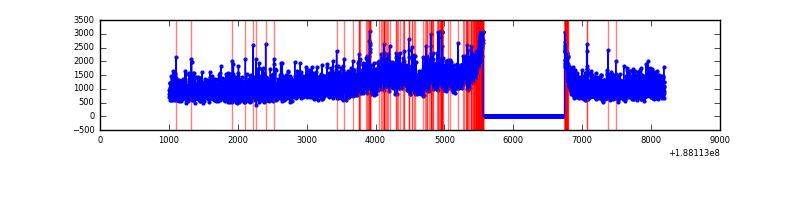 |
Top three noisy pixels from each quadrant. If the there are fewer than three noisy pixels in the level2.evt file, extra rows are filled as -1
| Pixel properties | Quadrant properties | ||||||
|---|---|---|---|---|---|---|---|
| Quadrant | DetID | PixID | Counts | Sigma | Mean | Median | Sigma |
| A | 15 | 127 | 89353 | 197.73 | 1860 | 1872 | 442.4 |
| A | 4 | 32 | 63827 | 140.04 | 1860 | 1872 | 442.4 |
| A | 12 | 243 | 9367 | 16.94 | 1860 | 1872 | 442.4 |
| B | 6 | 53 | 58842 | 125.25 | 1919 | 1925 | 454.4 |
| B | 5 | 249 | 16174 | 31.36 | 1919 | 1925 | 454.4 |
| B | 0 | 190 | 11468 | 21.0 | 1919 | 1925 | 454.4 |
| C | 15 | 241 | 309477 | 651.77 | 1702 | 1756 | 472.1 |
| C | 12 | 4 | 30120 | 60.08 | 1702 | 1756 | 472.1 |
| C | 3 | 111 | 20181 | 39.02 | 1702 | 1756 | 472.1 |
| D | 12 | 22 | 285703 | 545.3 | 1688 | 1746 | 520.7 |
| D | 2 | 152 | 111676 | 211.11 | 1688 | 1746 | 520.7 |
| D | 1 | 83 | 62721 | 117.09 | 1688 | 1746 | 520.7 |
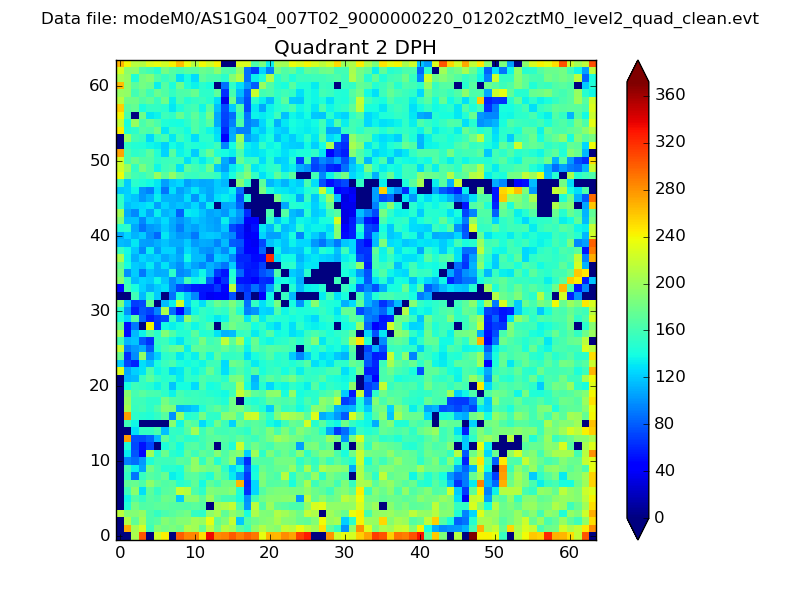
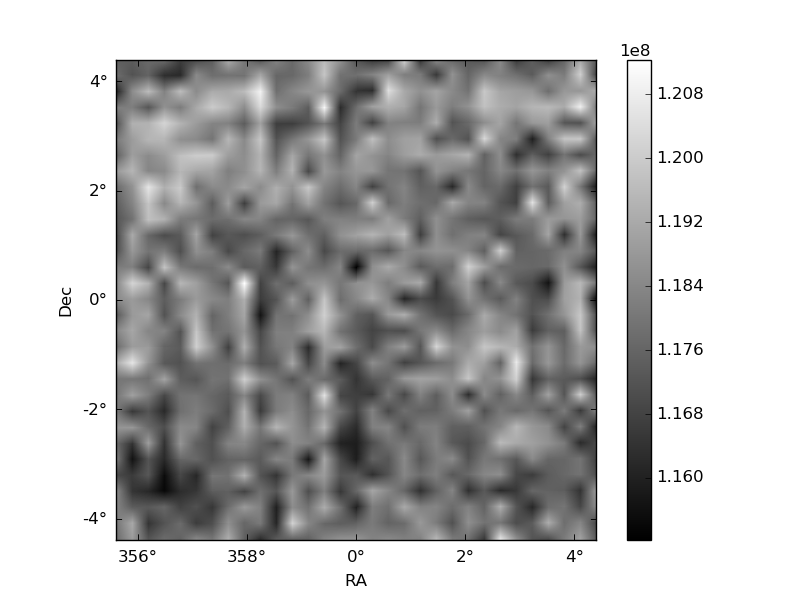
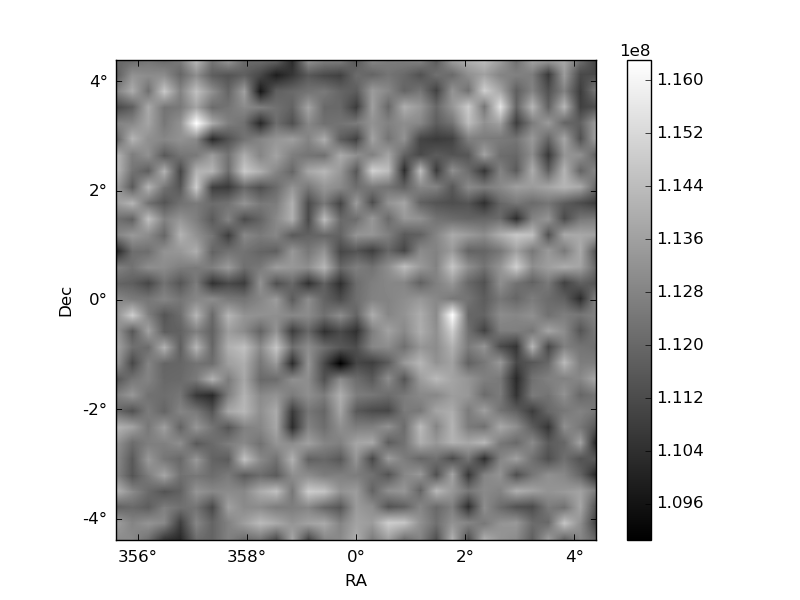
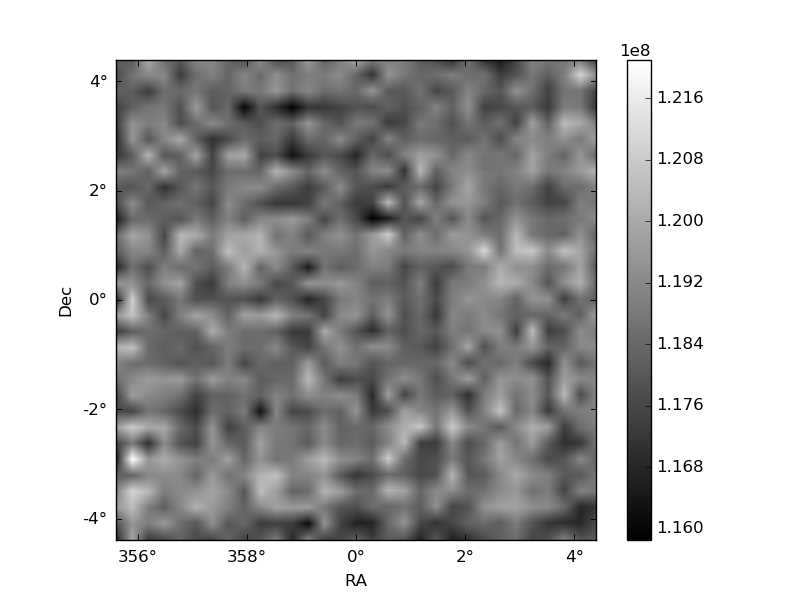
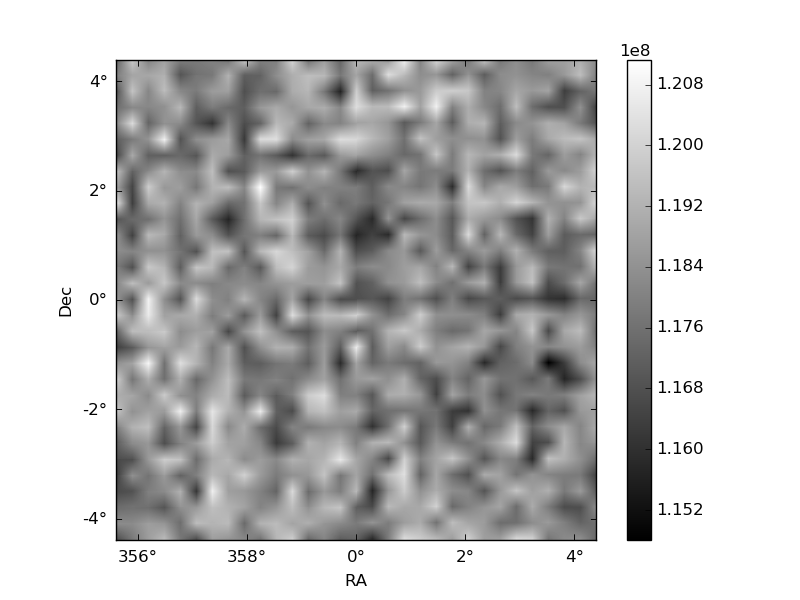
Histogram calculated using DETX and DETY for each event in the final _common_clean file
| Quadrant A | 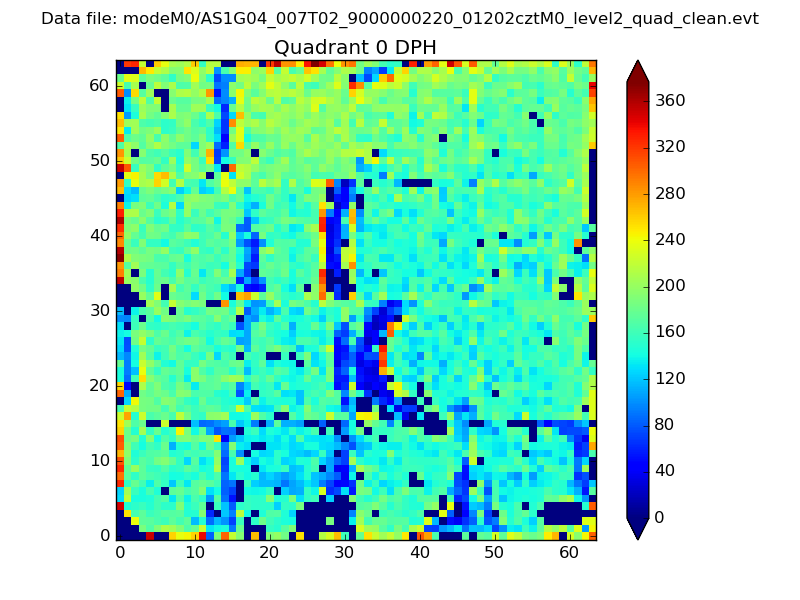 |
 |
Quadrant B |
|---|---|---|---|
| Quadrant D |  |
 |
Quadrant C |
| Plot type | Count rate plots | Images |
|---|---|---|
| Comparison with Poisson distribution Blue bars denote a histogram of data divided into 1 sec bins. Red curve is a Poisson curve with rate = median count rate of data. |
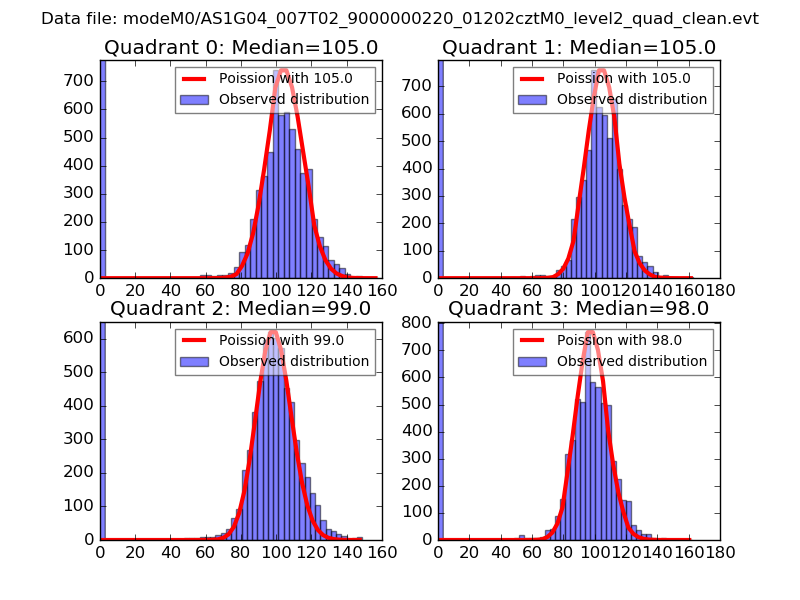 |
 |
| Quadrant-wise count rates Data is divided into 100 sec bins |
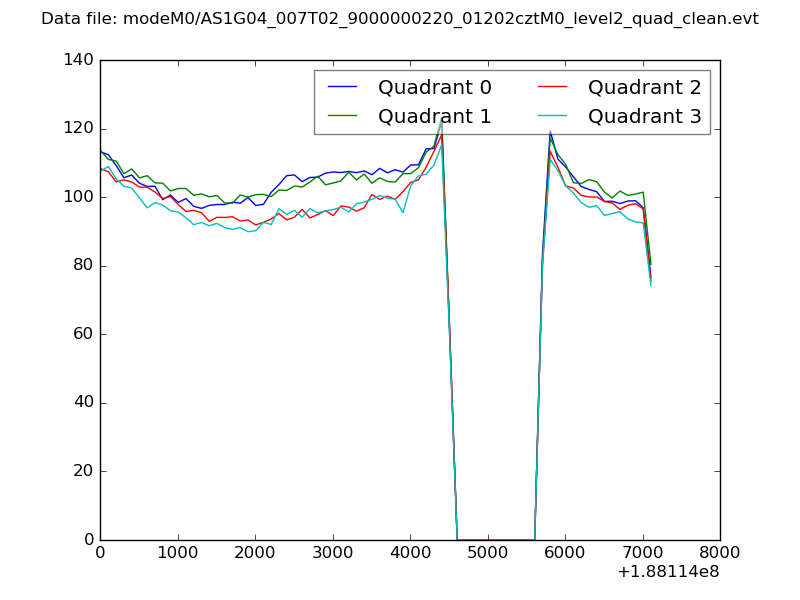 |
|
| Module-wise count rates for Quadrant A Data is divided into 100 sec bins |
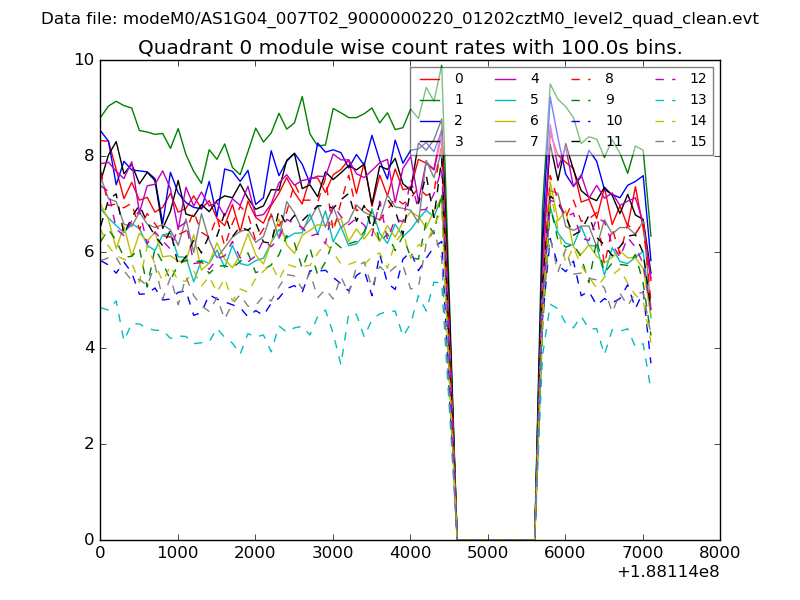 |
 |
| Module-wise count rates for Quadrant B Data is divided into 100 sec bins |
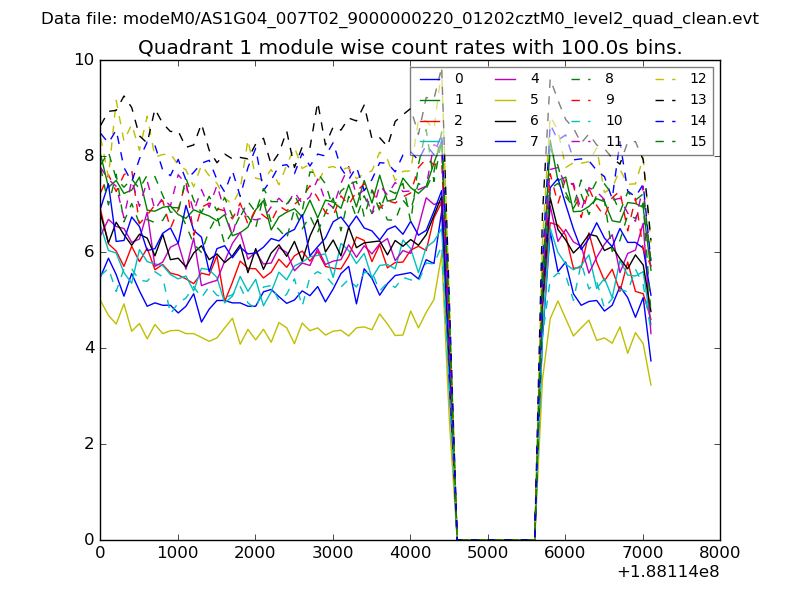 |
 |
| Module-wise count rates for Quadrant C Data is divided into 100 sec bins |
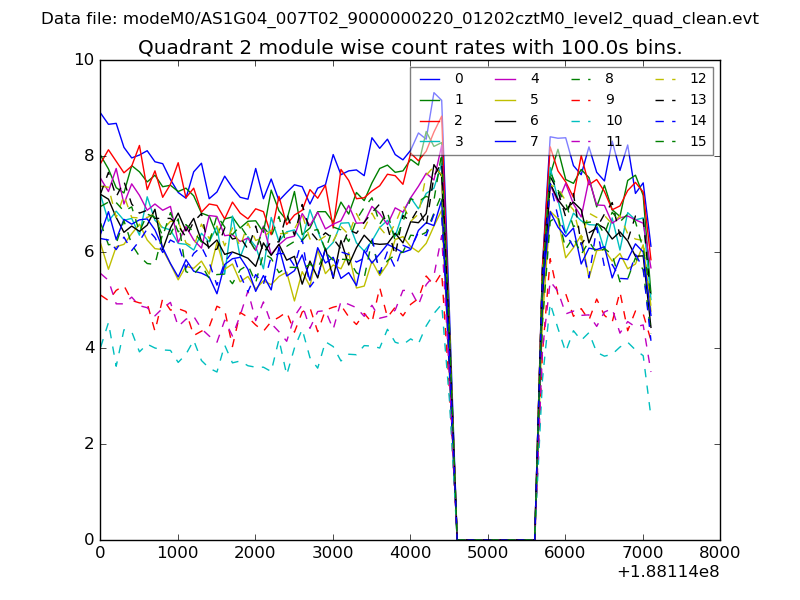 |
 |
| Module-wise count rates for Quadrant D Data is divided into 100 sec bins |
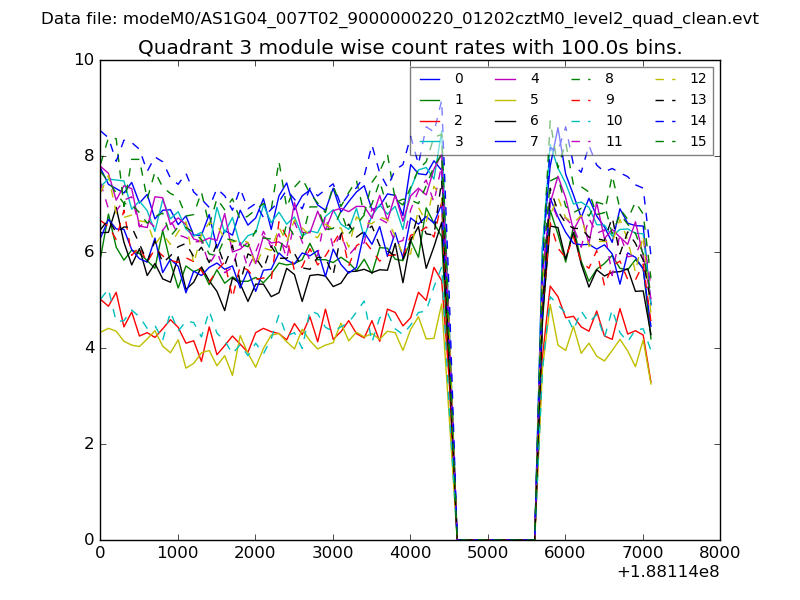 |
 |
| Parameter | Plot |
|---|---|
| CZT HV Monitor | 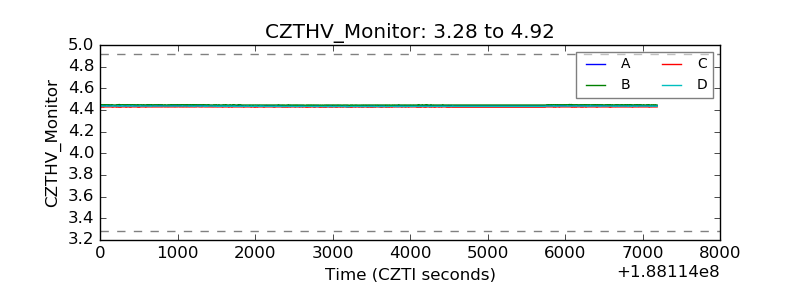 |
| D_VDD | 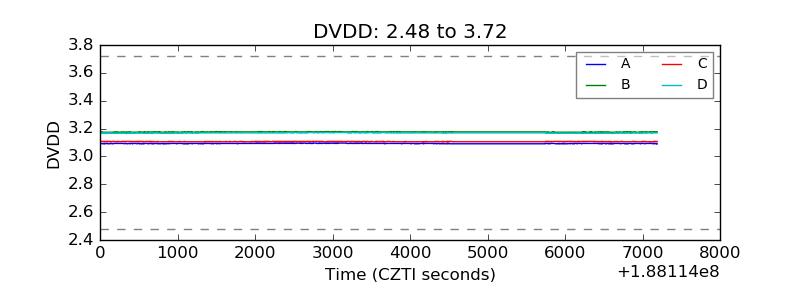 |
| Temperature 1 | 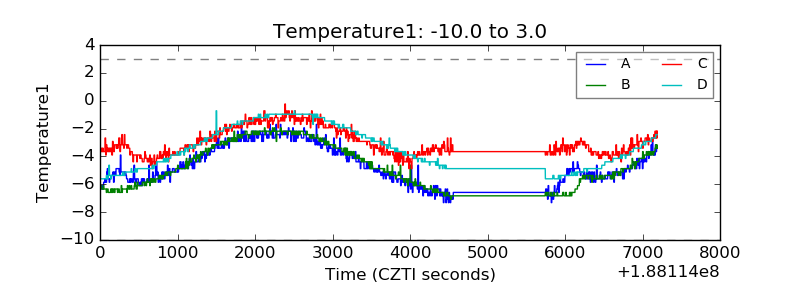 |
| Veto HV Monitor | 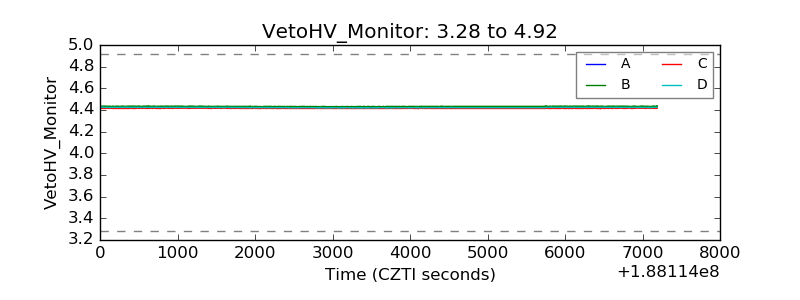 |
| Veto LLD | 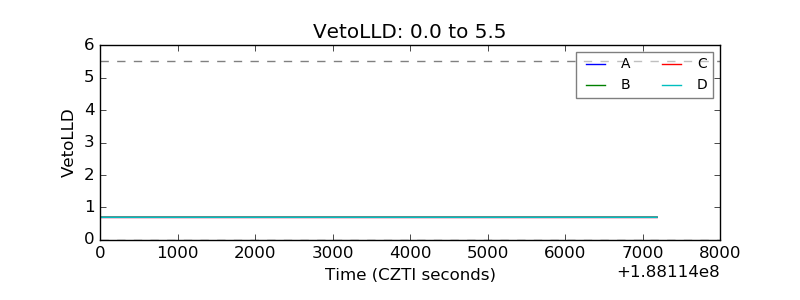 |
| Alpha Counter | 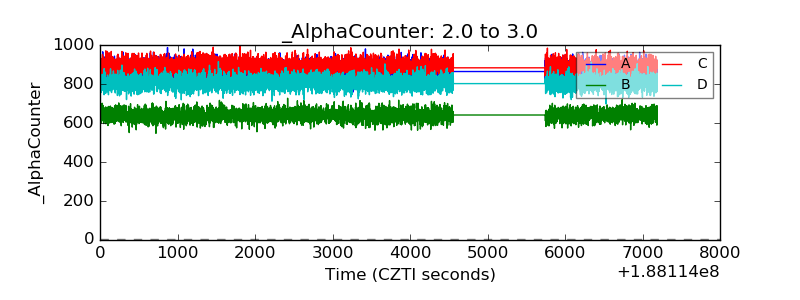 |
| _CPM_Rate | 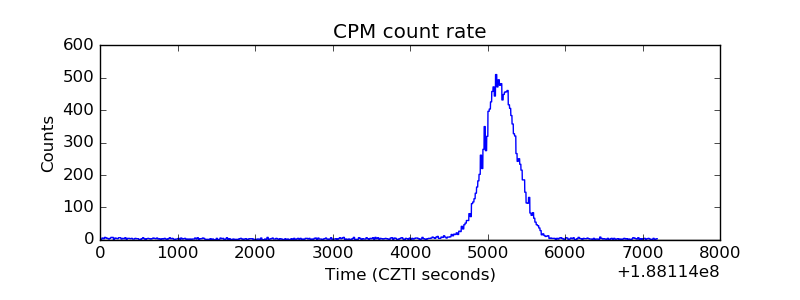 |
| CZT Counter | 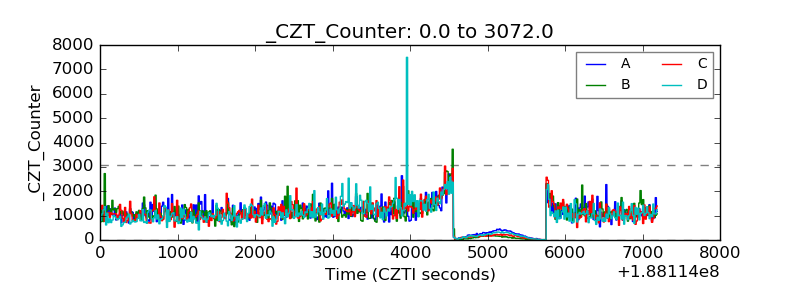 |
| +2.5 Volts monitor |  |
| +5 Volts monitor |  |
| _ROLL_ROT | 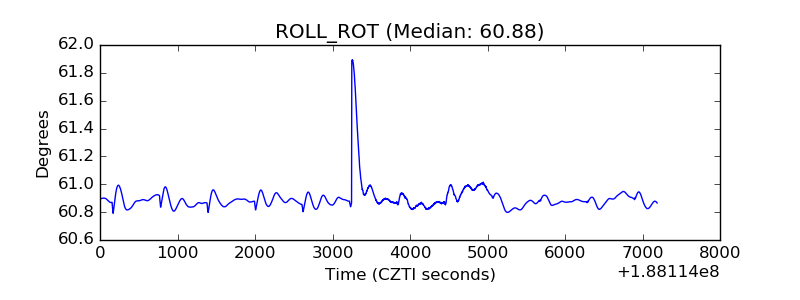 |
| _Roll_DEC | 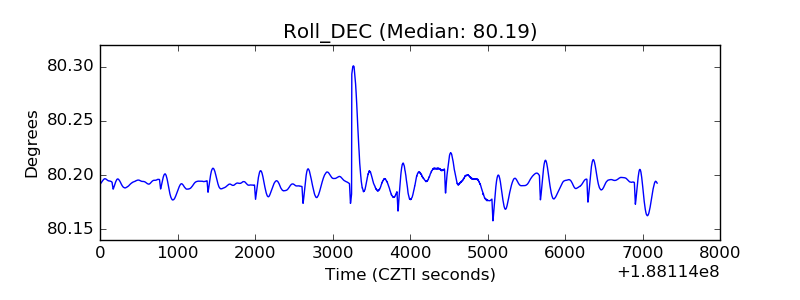 |
| _Roll_RA | 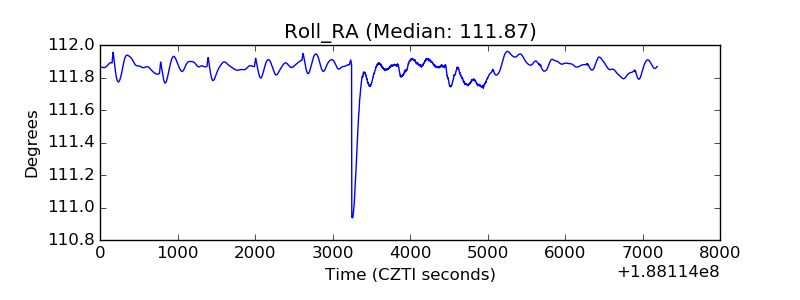 |
| Veto Counter | 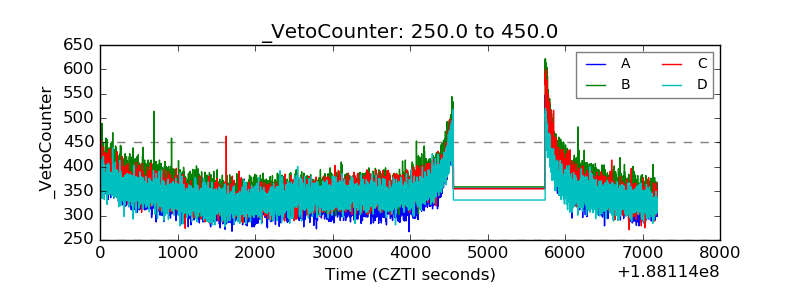 |