| Param | Original file | Final file |
|---|---|---|
| Filename | modeM0/AS1G04_007T02_9000000220_01203cztM0_level2.evt | modeM0/AS1G04_007T02_9000000220_01203cztM0_level2_quad_clean.evt |
| Size (bytes) | 1,075,950,720 | 98,637,120 |
| Size | 1.0 GB | 94.1 MB |
| Events in quadrant A | 7,902,434 | 652,734 |
| Events in quadrant B | 8,249,918 | 649,883 |
| Events in quadrant C | 7,718,617 | 627,078 |
| Events in quadrant D | 8,288,109 | 608,541 |
| Mode M9 | |||
|---|---|---|---|
| Quadrant | BADHDUFLAG | Total packets | Discarded packets |
| A | 0 | 10 | 0 |
| B | 0 | 10 | 0 |
| C | 0 | 10 | 0 |
| D | 0 | 10 | 0 |
| Mode M0 | |||
|---|---|---|---|
| Quadrant | BADHDUFLAG | Total packets | Discarded packets |
| A | 0 | 28084 | 2 |
| B | 0 | 29123 | 1 |
| C | 0 | 27481 | 1 |
| D | 0 | 29224 | 1 |
| Mode SS | |||
|---|---|---|---|
| Quadrant | BADHDUFLAG | Total packets | Discarded packets |
| A | 0 | 130 | 0 |
| B | 0 | 130 | 0 |
| C | 0 | 130 | 0 |
| D | 0 | 130 | 0 |
| Quadrant | Total seconds | Saturated seconds | Saturation percentage |
|---|---|---|---|
| A | 6442 | 84 | 1.303943% |
| B | 6442 | 130 | 2.018007% |
| C | 6442 | 59 | 0.915865% |
| D | 6442 | 212 | 3.290903% |
Noise dominated data is calculated using 1-second bins in cleaned event files. If a bin has >2000 counts, and if more than 50% of those come from <1% of pixels, then it is considered to be noise-dominated and hence unusable.
| Quadrant | # 1 sec bins | Bins with >0 counts | Bins with >2000 counts | High rate bins dominated by noise | Noise dominated (total time) | Noise dominated (detector-on time) | Marked lightcurve |
|---|---|---|---|---|---|---|---|
| A | 7347 | 6443 | 285 | 285 | 3.88% | 4.42% | 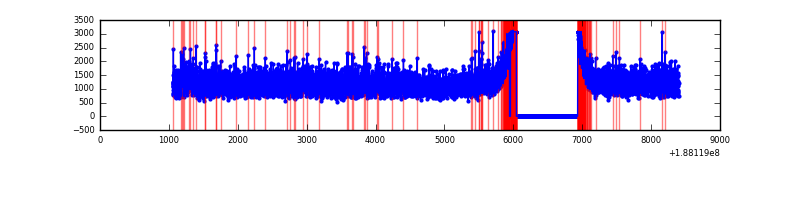 |
| B | 7347 | 6443 | 388 | 388 | 5.28% | 6.02% | 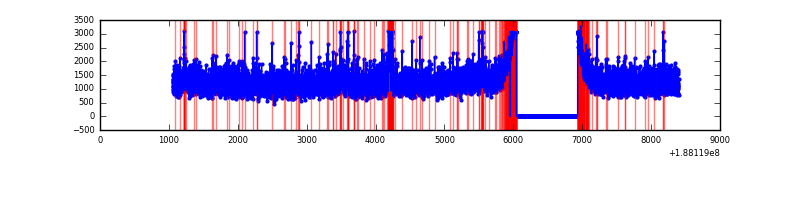 |
| C | 7347 | 6443 | 249 | 249 | 3.39% | 3.86% | 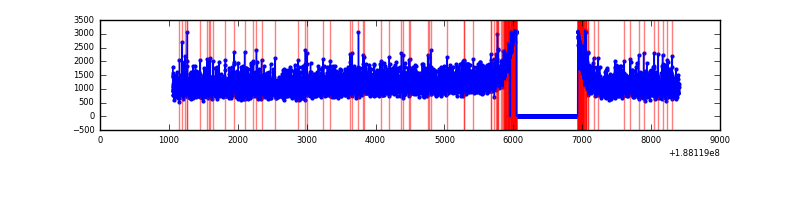 |
| D | 7347 | 6443 | 608 | 608 | 8.28% | 9.44% | 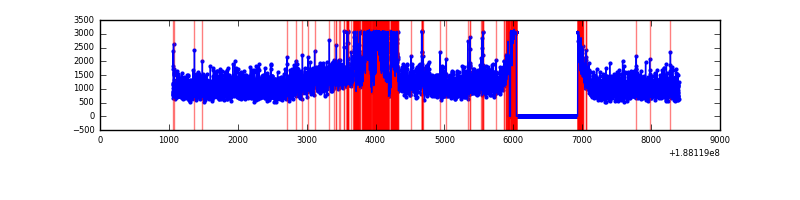 |
Top three noisy pixels from each quadrant. If the there are fewer than three noisy pixels in the level2.evt file, extra rows are filled as -1
| Pixel properties | Quadrant properties | ||||||
|---|---|---|---|---|---|---|---|
| Quadrant | DetID | PixID | Counts | Sigma | Mean | Median | Sigma |
| A | 15 | 127 | 80296 | 161.12 | 2023 | 2036 | 485.7 |
| A | 4 | 32 | 39897 | 77.95 | 2023 | 2036 | 485.7 |
| A | 12 | 243 | 23707 | 44.62 | 2023 | 2036 | 485.7 |
| B | 0 | 187 | 118273 | 232.66 | 2090 | 2094 | 499.3 |
| B | 8 | 4 | 43644 | 83.21 | 2090 | 2094 | 499.3 |
| B | 5 | 191 | 37589 | 71.08 | 2090 | 2094 | 499.3 |
| C | 15 | 241 | 336036 | 641.59 | 1870 | 1931 | 520.7 |
| C | 12 | 4 | 29974 | 53.85 | 1870 | 1931 | 520.7 |
| C | 3 | 111 | 22518 | 39.53 | 1870 | 1931 | 520.7 |
| D | 1 | 83 | 649323 | 1146.11 | 1826 | 1891 | 564.9 |
| D | 12 | 22 | 431013 | 759.65 | 1826 | 1891 | 564.9 |
| D | 2 | 16 | 136112 | 237.6 | 1826 | 1891 | 564.9 |
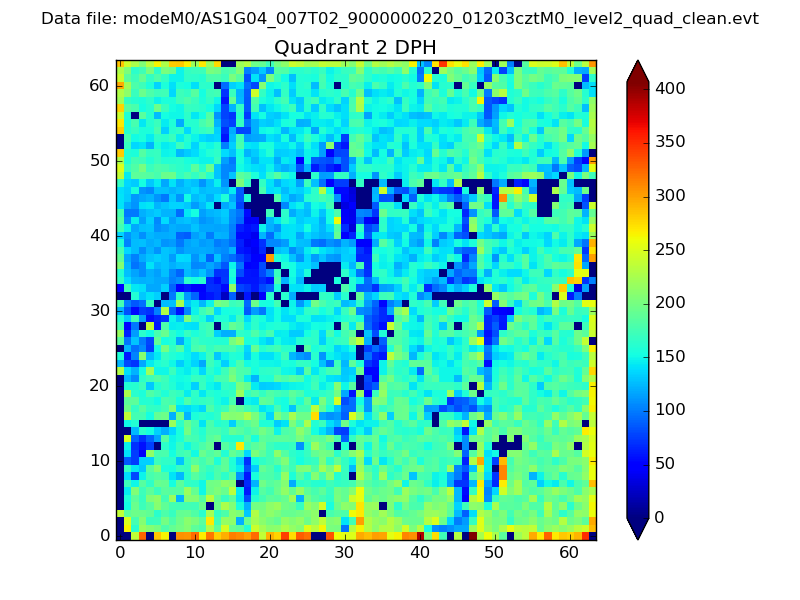
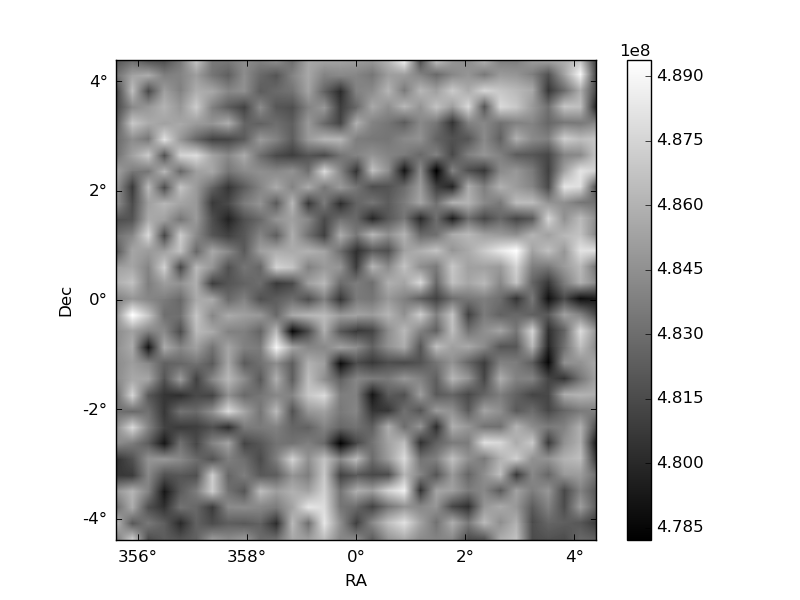
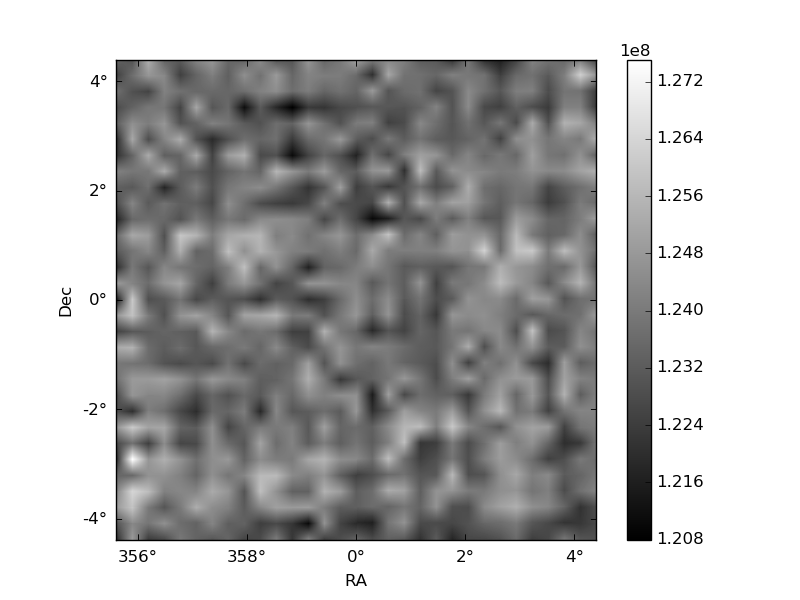
Histogram calculated using DETX and DETY for each event in the final _common_clean file
| Quadrant A | 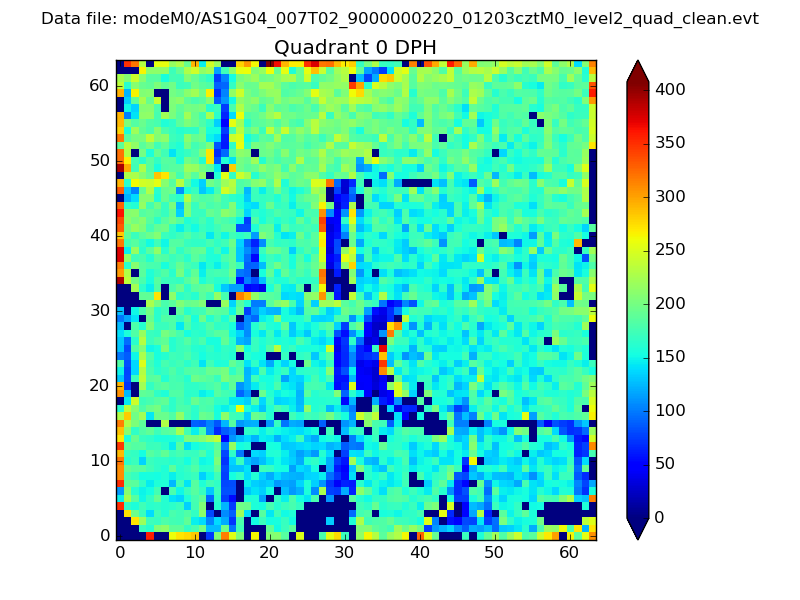 |
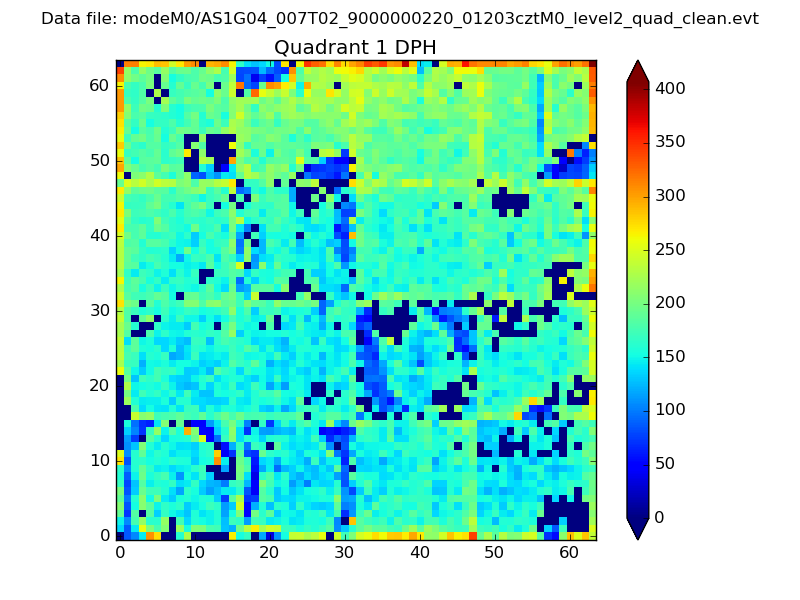 |
Quadrant B |
|---|---|---|---|
| Quadrant D | 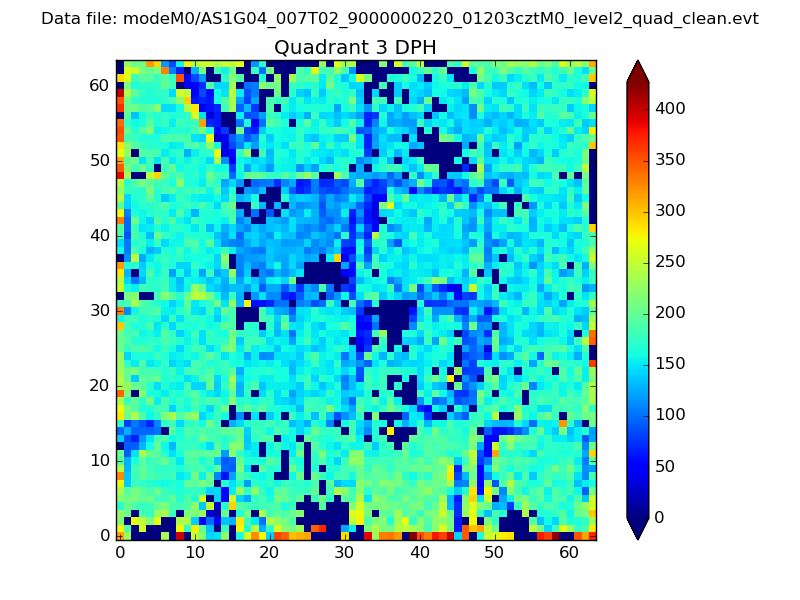 |
 |
Quadrant C |
| Plot type | Count rate plots | Images |
|---|---|---|
| Comparison with Poisson distribution Blue bars denote a histogram of data divided into 1 sec bins. Red curve is a Poisson curve with rate = median count rate of data. |
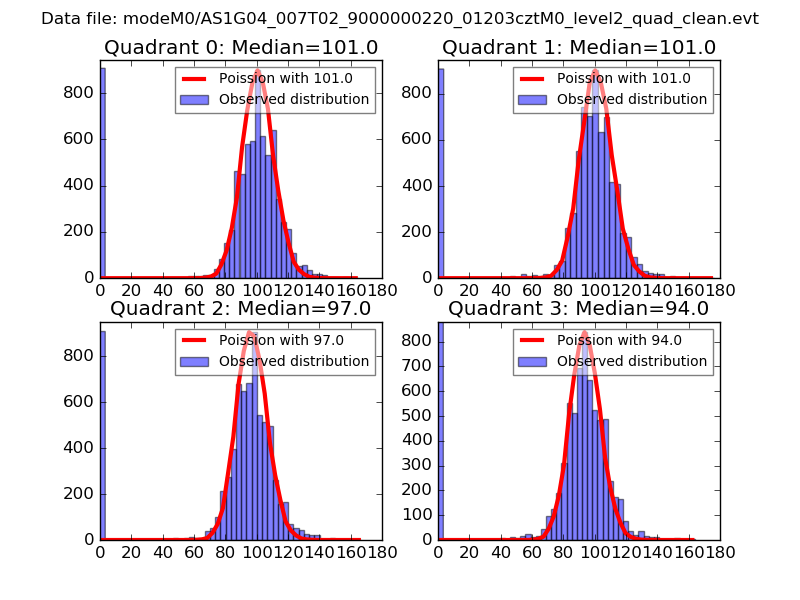 |
 |
| Quadrant-wise count rates Data is divided into 100 sec bins |
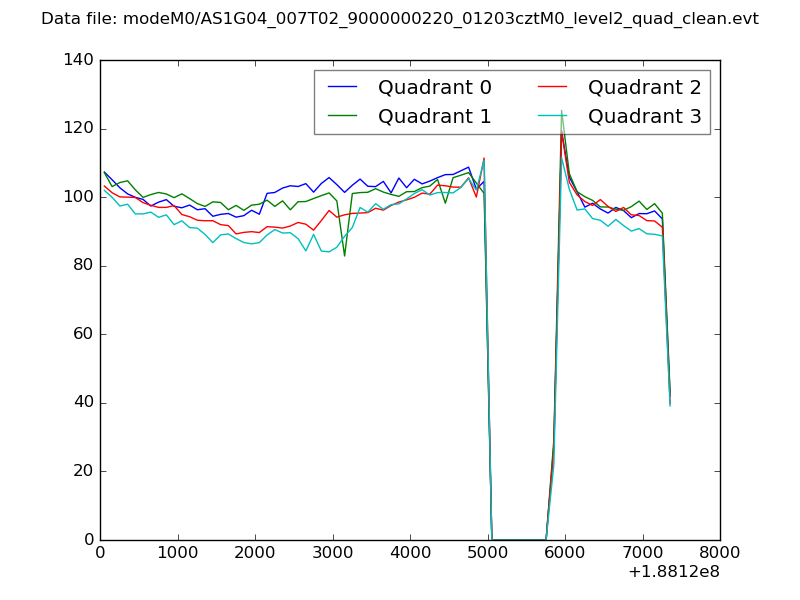 |
|
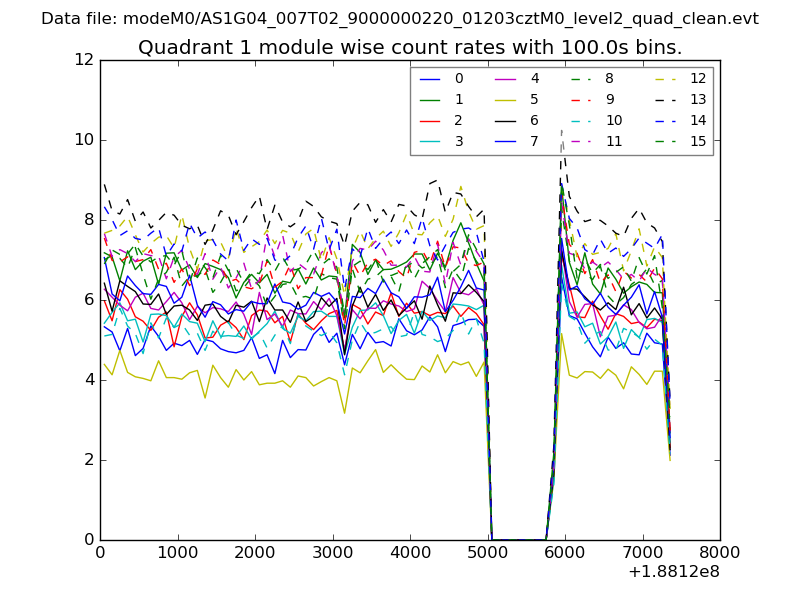
| Module-wise count rates for Quadrant A Data is divided into 100 sec bins |
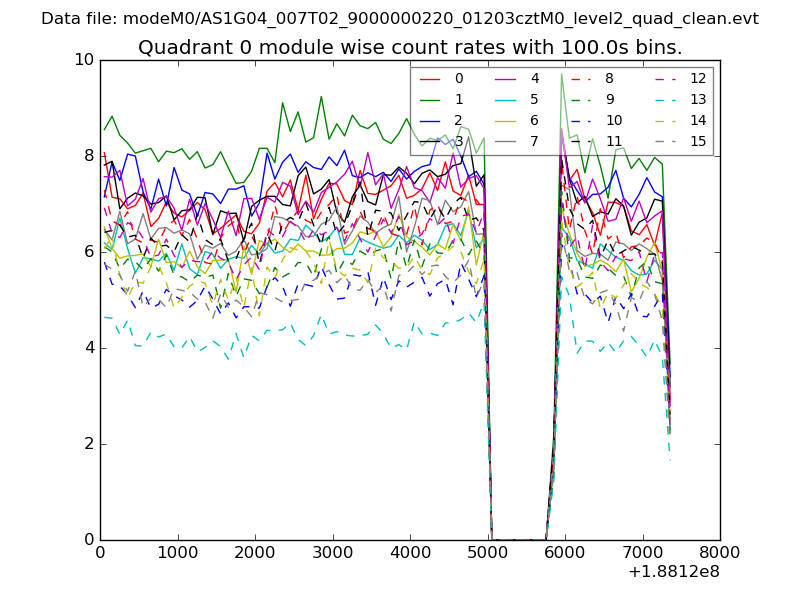 |
 |
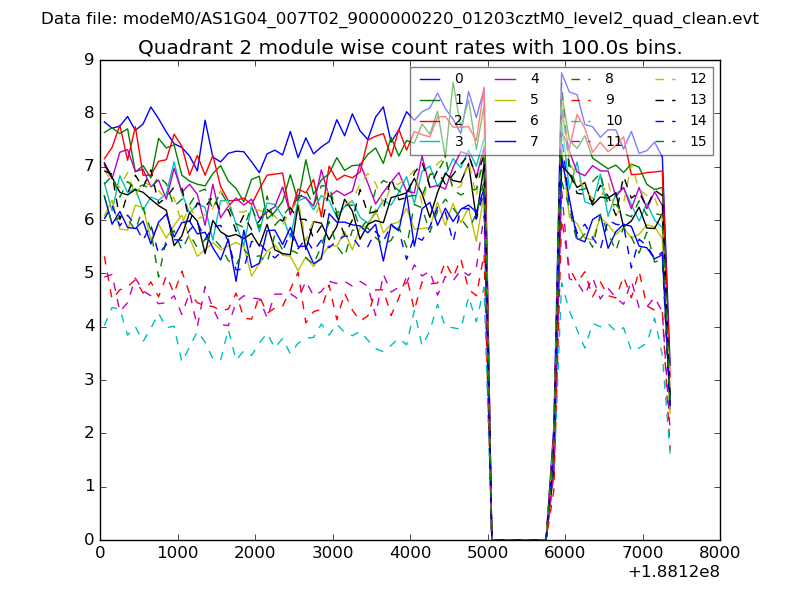
| Module-wise count rates for Quadrant B Data is divided into 100 sec bins |
 |
 |
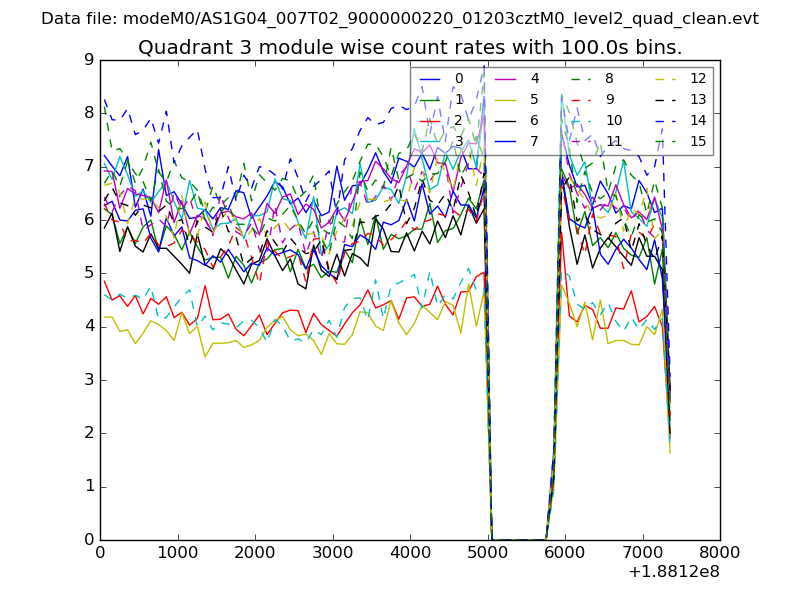
| Module-wise count rates for Quadrant C Data is divided into 100 sec bins |
 |
 |
| Module-wise count rates for Quadrant D Data is divided into 100 sec bins |
 |
 |
| Parameter | Plot |
|---|---|
| CZT HV Monitor | 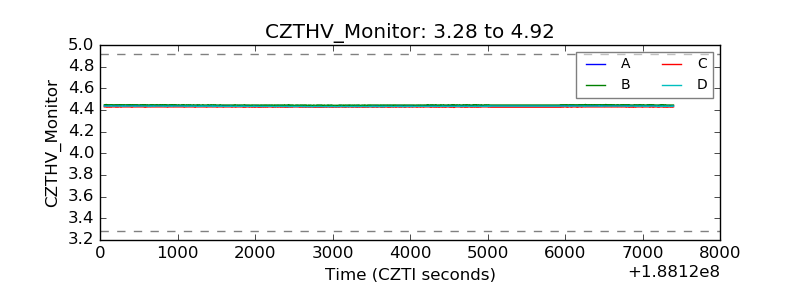 |
| D_VDD | 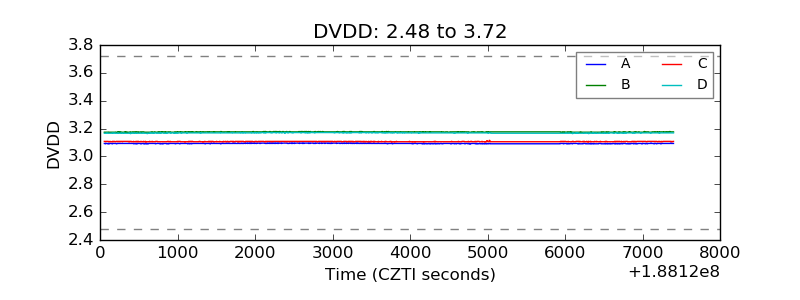 |
| Temperature 1 | 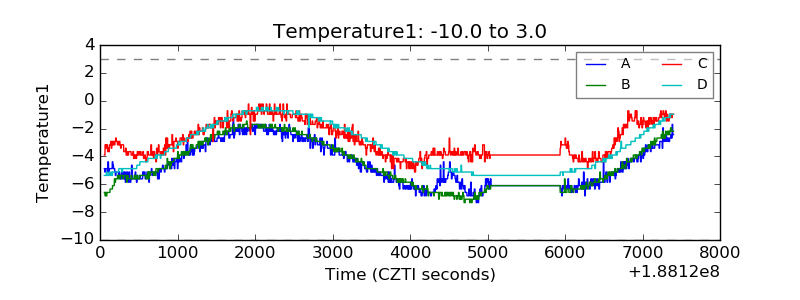 |
| Veto HV Monitor | 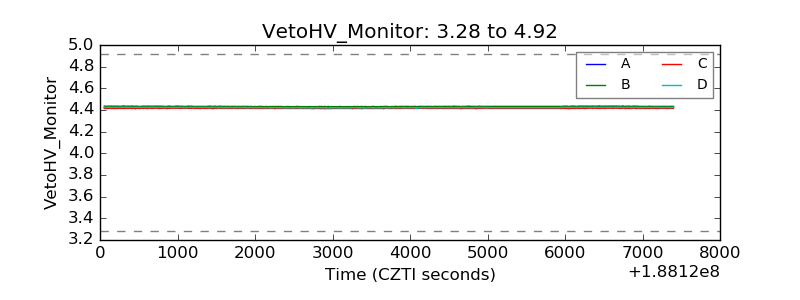 |
| Veto LLD | 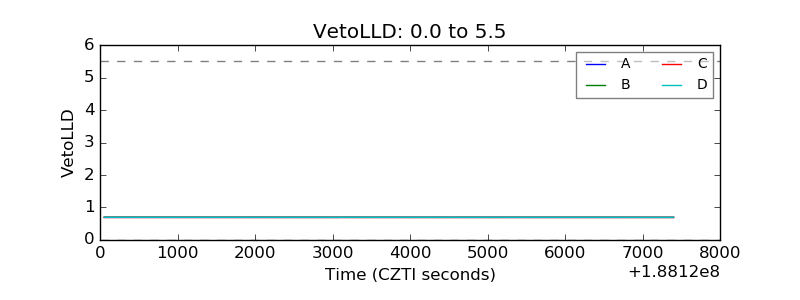 |
| Alpha Counter | 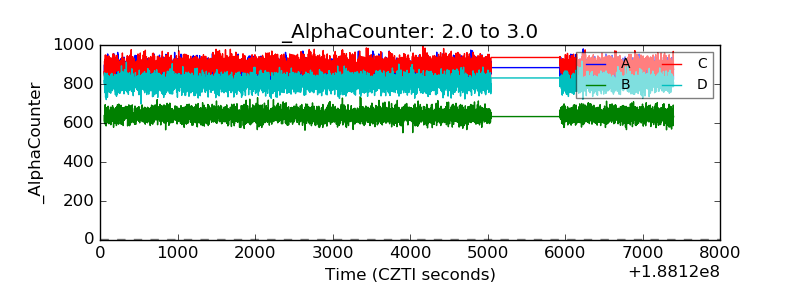 |
| _CPM_Rate | 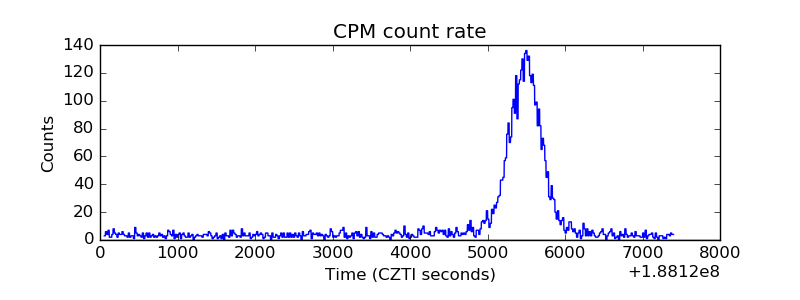 |
| CZT Counter | 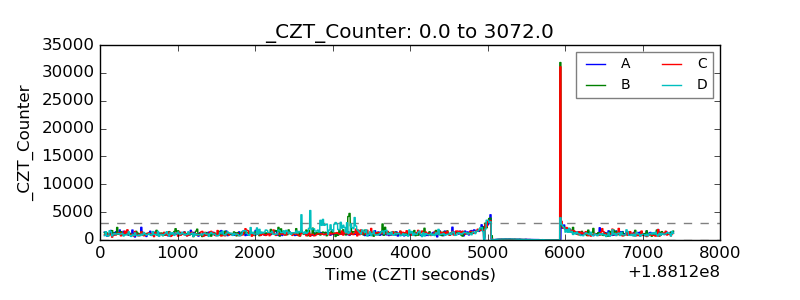 |
| +2.5 Volts monitor |  |
| +5 Volts monitor |  |
| _ROLL_ROT | 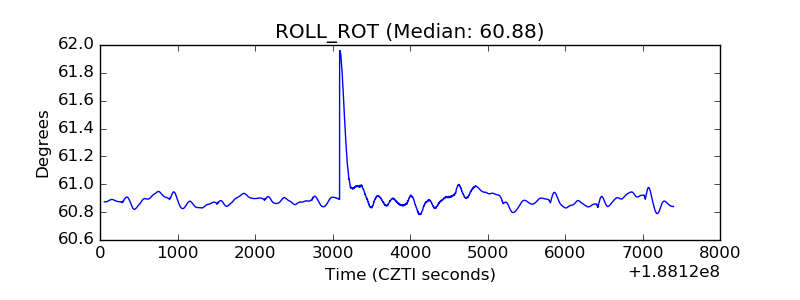 |
| _Roll_DEC | 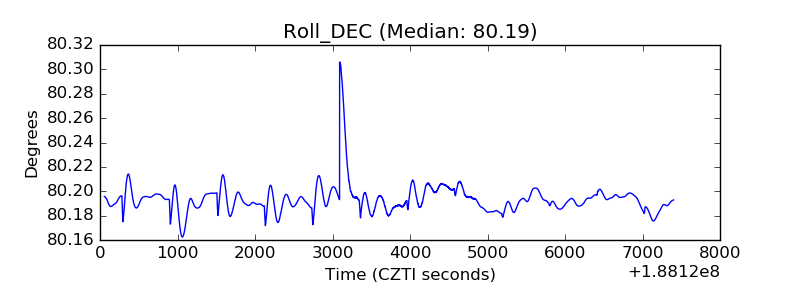 |
| _Roll_RA | 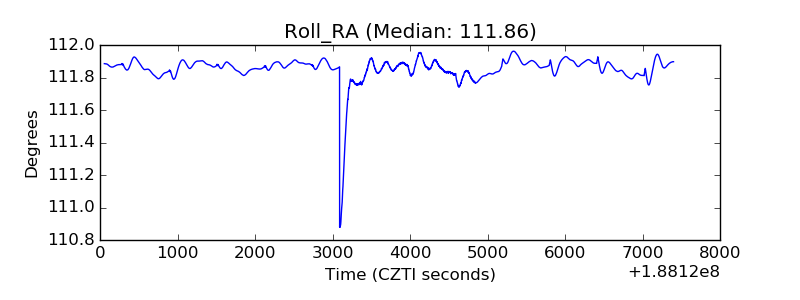 |
| Veto Counter | 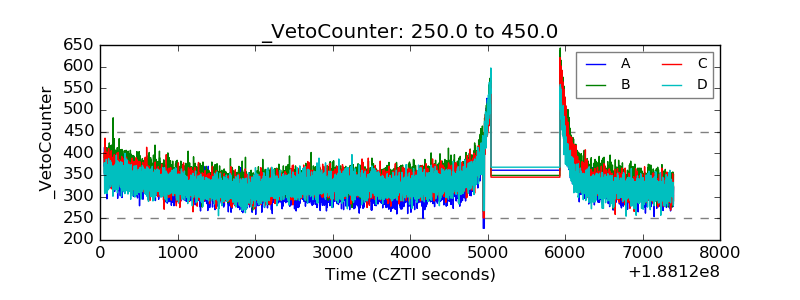 |