| Param | Original file | Final file |
|---|---|---|
| Filename | modeM0/AS1G04_007T02_9000000220_01204cztM0_level2.evt | modeM0/AS1G04_007T02_9000000220_01204cztM0_level2_quad_clean.evt |
| Size (bytes) | 1,075,628,160 | 99,048,960 |
| Size | 1.0 GB | 94.5 MB |
| Events in quadrant A | 7,986,043 | 652,453 |
| Events in quadrant B | 8,402,980 | 647,363 |
| Events in quadrant C | 7,967,424 | 626,148 |
| Events in quadrant D | 7,784,490 | 616,357 |
| Mode M9 | |||
|---|---|---|---|
| Quadrant | BADHDUFLAG | Total packets | Discarded packets |
| A | 0 | 4 | 0 |
| B | 0 | 4 | 0 |
| C | 0 | 4 | 0 |
| D | 0 | 4 | 0 |
| Mode M0 | |||
|---|---|---|---|
| Quadrant | BADHDUFLAG | Total packets | Discarded packets |
| A | 0 | 28374 | 2 |
| B | 0 | 29642 | 1 |
| C | 0 | 28324 | 1 |
| D | 0 | 27803 | 1 |
| Mode SS | |||
|---|---|---|---|
| Quadrant | BADHDUFLAG | Total packets | Discarded packets |
| A | 0 | 134 | 0 |
| B | 0 | 134 | 0 |
| C | 0 | 134 | 0 |
| D | 0 | 134 | 0 |
| Quadrant | Total seconds | Saturated seconds | Saturation percentage |
|---|---|---|---|
| A | 6554 | 96 | 1.464754% |
| B | 6554 | 102 | 1.556301% |
| C | 6554 | 59 | 0.900214% |
| D | 6554 | 126 | 1.922490% |
Noise dominated data is calculated using 1-second bins in cleaned event files. If a bin has >2000 counts, and if more than 50% of those come from <1% of pixels, then it is considered to be noise-dominated and hence unusable.
| Quadrant | # 1 sec bins | Bins with >0 counts | Bins with >2000 counts | High rate bins dominated by noise | Noise dominated (total time) | Noise dominated (detector-on time) | Marked lightcurve |
|---|---|---|---|---|---|---|---|
| A | 7003 | 6553 | 336 | 336 | 4.80% | 5.13% | 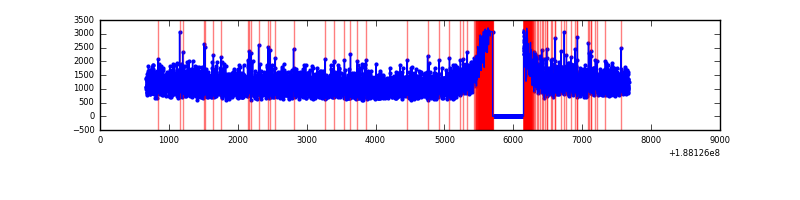 |
| B | 7003 | 6553 | 380 | 380 | 5.43% | 5.80% | 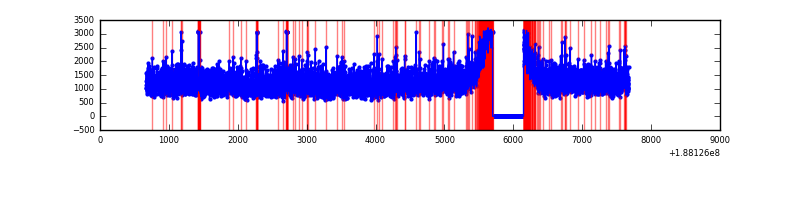 |
| C | 7004 | 6554 | 284 | 284 | 4.05% | 4.33% | 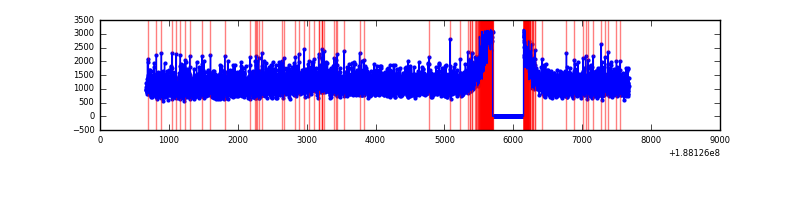 |
| D | 7004 | 6554 | 388 | 388 | 5.54% | 5.92% | 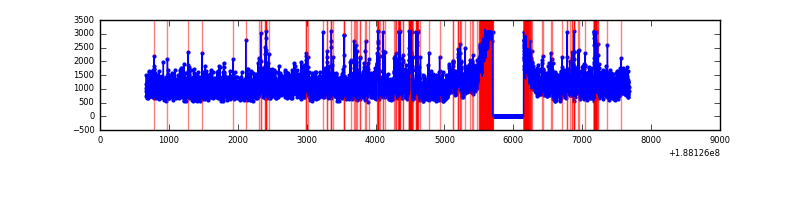 |
Top three noisy pixels from each quadrant. If the there are fewer than three noisy pixels in the level2.evt file, extra rows are filled as -1
| Pixel properties | Quadrant properties | ||||||
|---|---|---|---|---|---|---|---|
| Quadrant | DetID | PixID | Counts | Sigma | Mean | Median | Sigma |
| A | 12 | 243 | 30873 | 57.21 | 2072 | 2080 | 503.2 |
| A | 11 | 79 | 8492 | 12.74 | 2072 | 2080 | 503.2 |
| A | 3 | 111 | 6454 | 8.69 | 2072 | 2080 | 503.2 |
| B | 5 | 191 | 83305 | 159.83 | 2128 | 2137 | 507.8 |
| B | 6 | 53 | 64875 | 123.54 | 2128 | 2137 | 507.8 |
| B | 15 | 22 | 58668 | 111.31 | 2128 | 2137 | 507.8 |
| C | 15 | 241 | 348789 | 642.67 | 1925 | 1990 | 539.6 |
| C | 3 | 79 | 35599 | 62.28 | 1925 | 1990 | 539.6 |
| C | 3 | 111 | 28639 | 49.38 | 1925 | 1990 | 539.6 |
| D | 10 | 84 | 357907 | 597.13 | 1895 | 1962 | 596.1 |
| D | 1 | 83 | 140015 | 231.6 | 1895 | 1962 | 596.1 |
| D | 2 | 170 | 40143 | 64.05 | 1895 | 1962 | 596.1 |
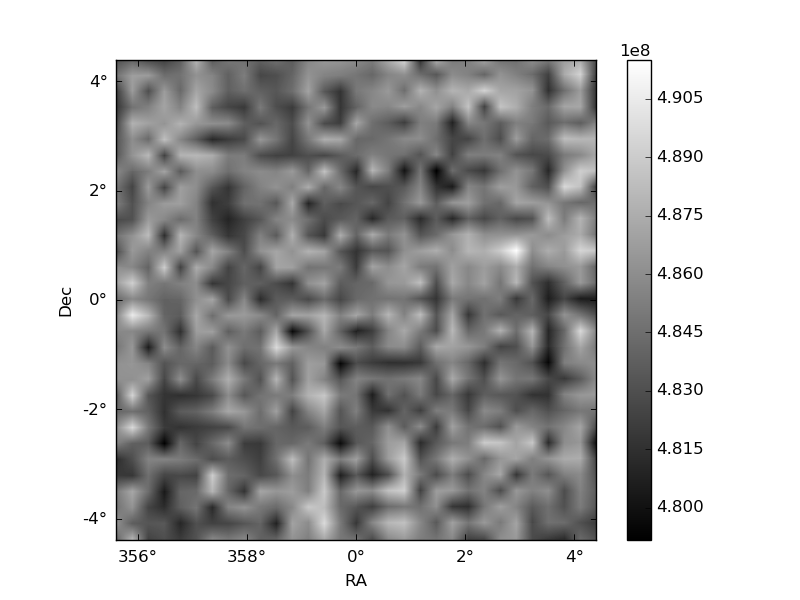
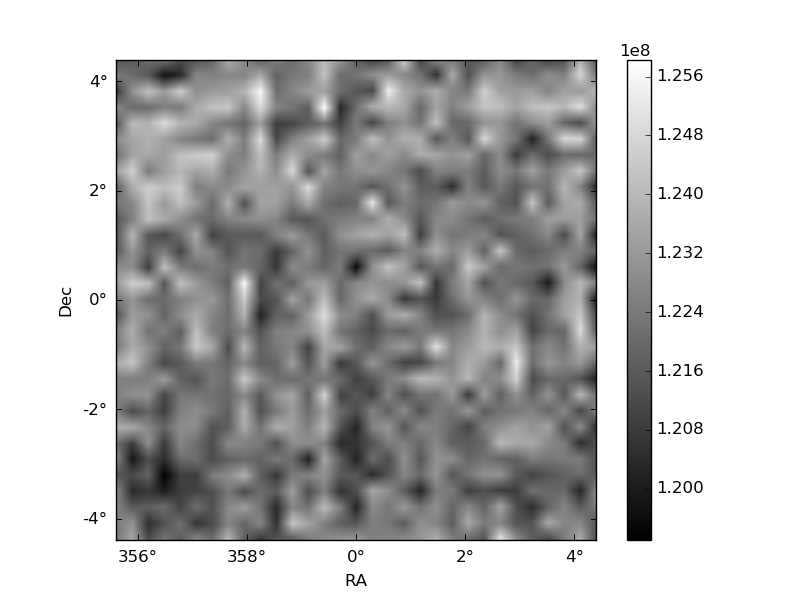
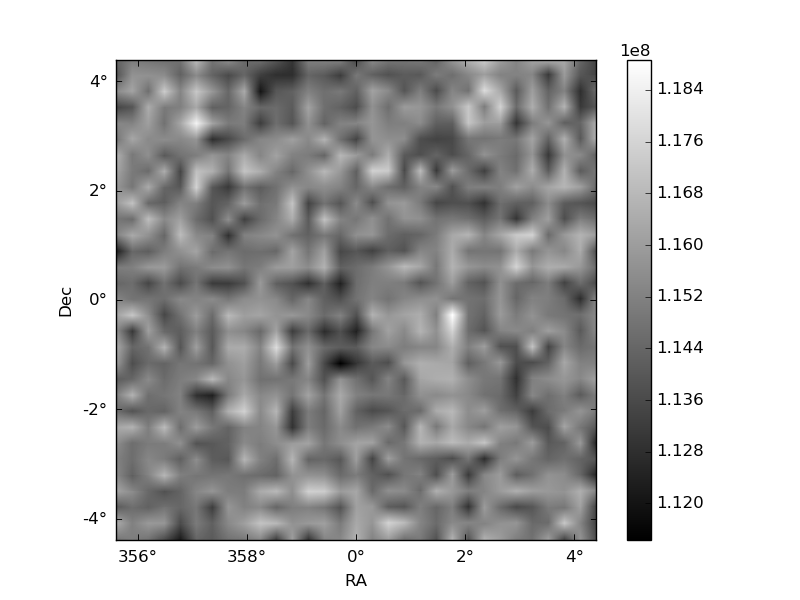
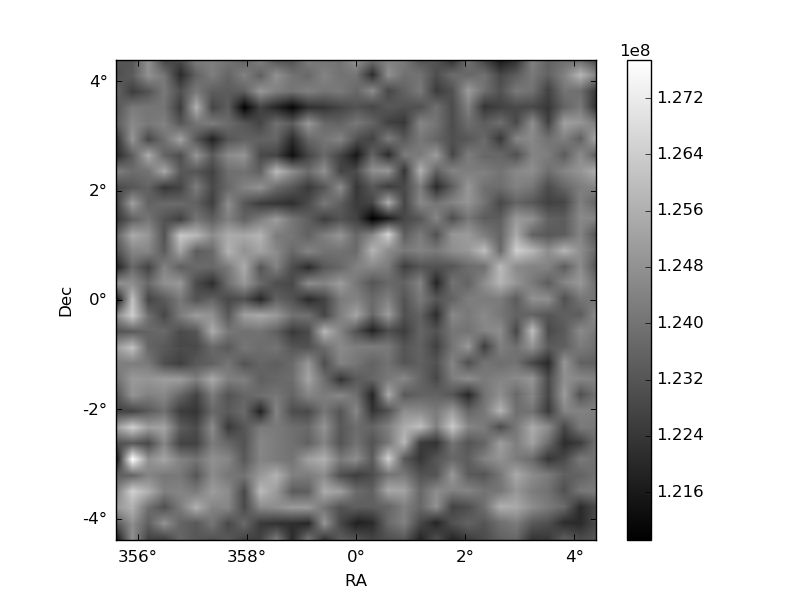
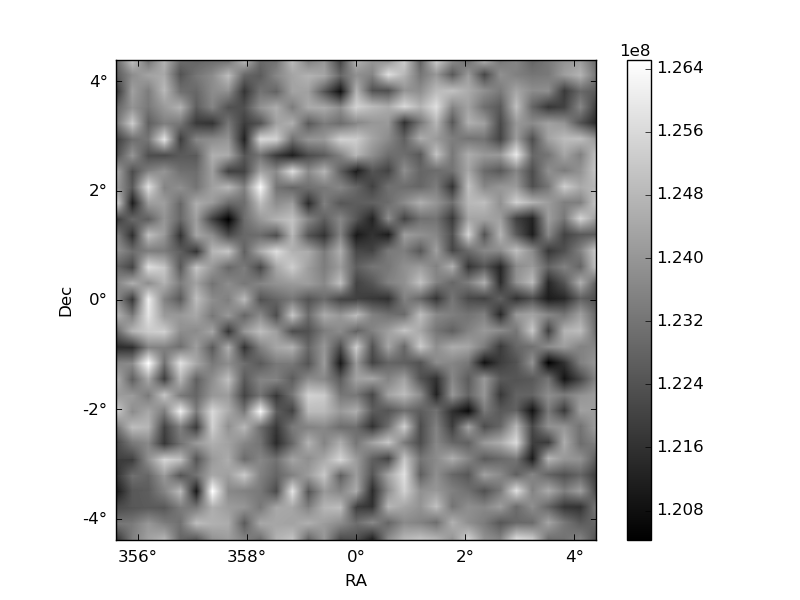
Histogram calculated using DETX and DETY for each event in the final _common_clean file
| Quadrant A | 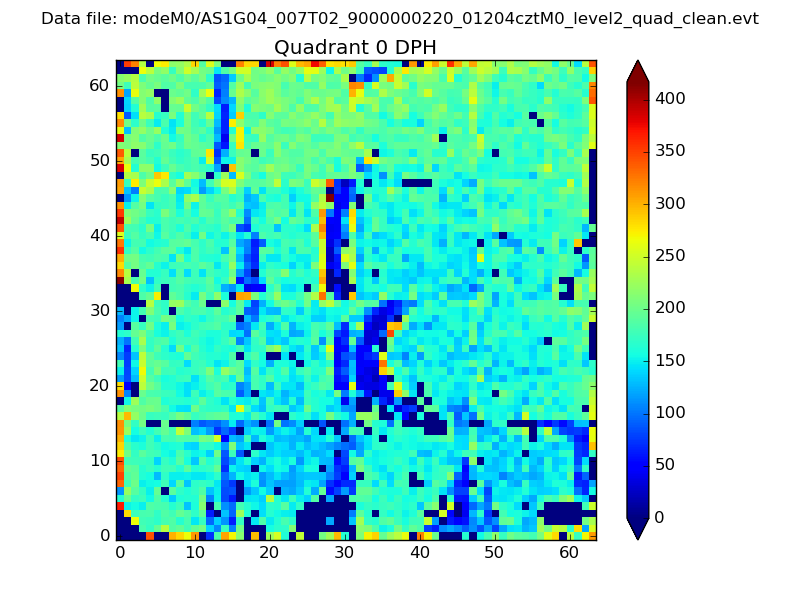 |
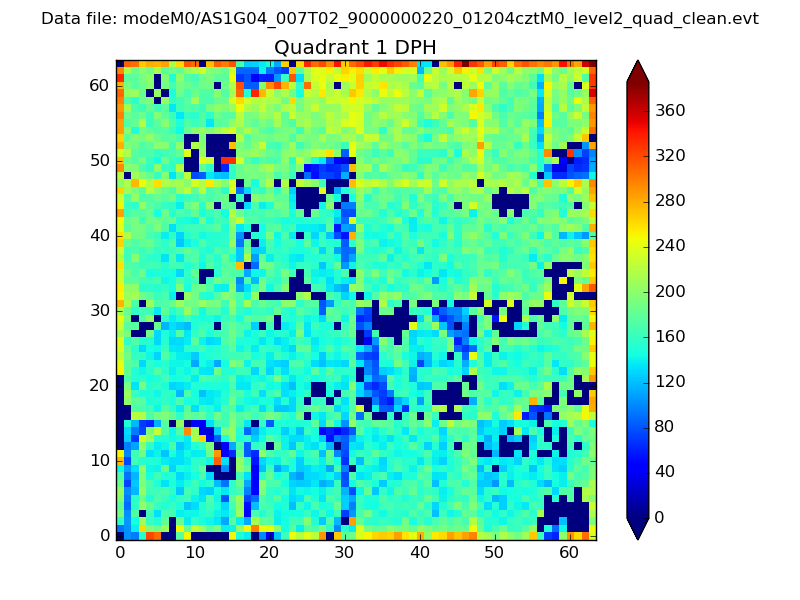 |
Quadrant B |
|---|---|---|---|
| Quadrant D | 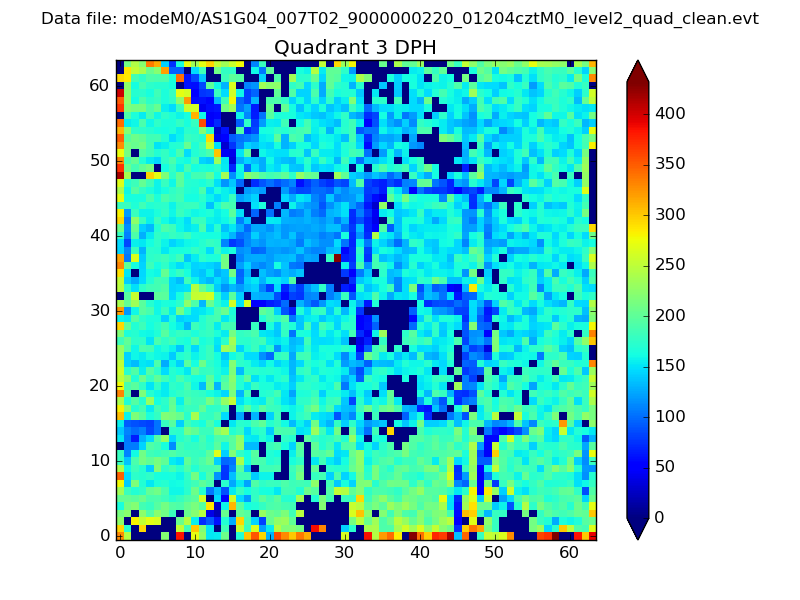 |
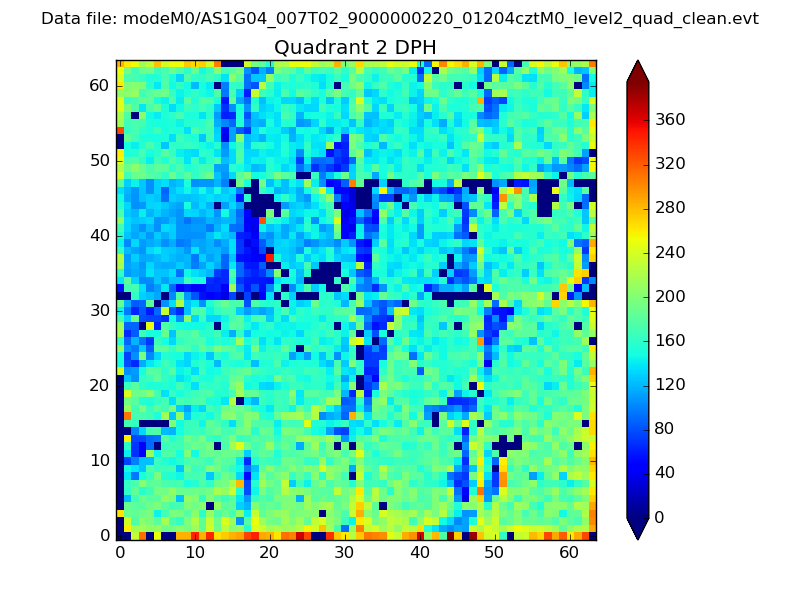 |
Quadrant C |
| Plot type | Count rate plots | Images |
|---|---|---|
| Comparison with Poisson distribution Blue bars denote a histogram of data divided into 1 sec bins. Red curve is a Poisson curve with rate = median count rate of data. |
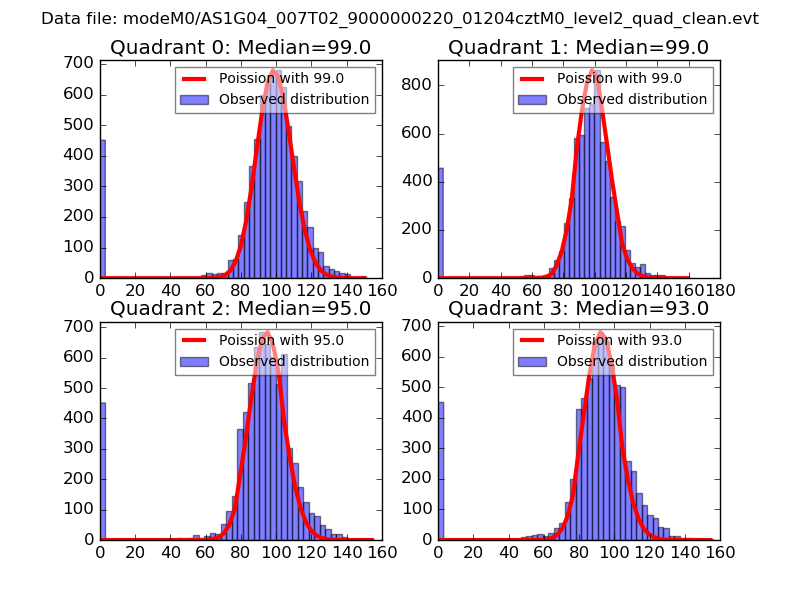 |
 |
| Quadrant-wise count rates Data is divided into 100 sec bins |
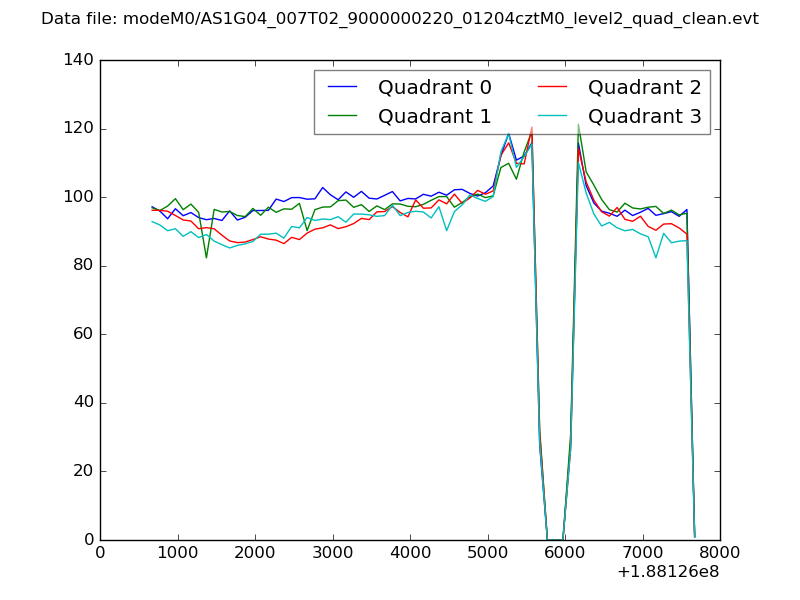 |
|
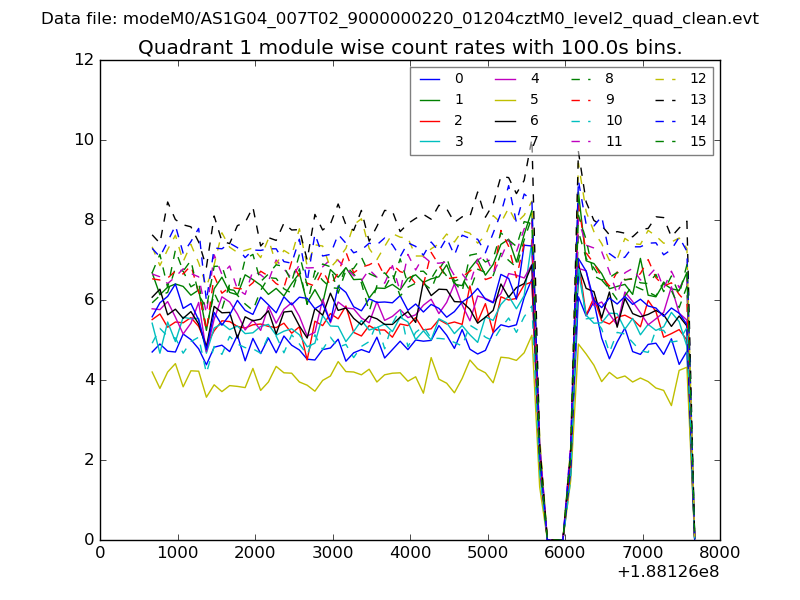
| Module-wise count rates for Quadrant A Data is divided into 100 sec bins |
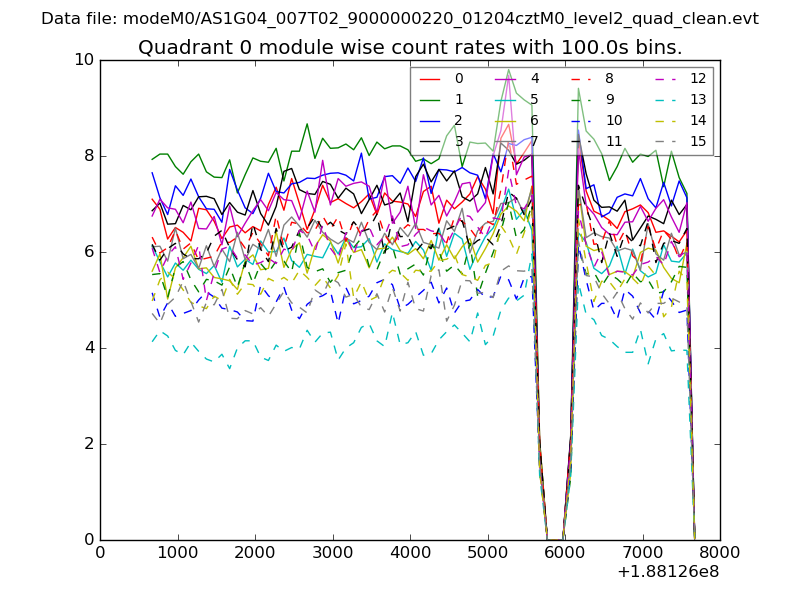 |
 |
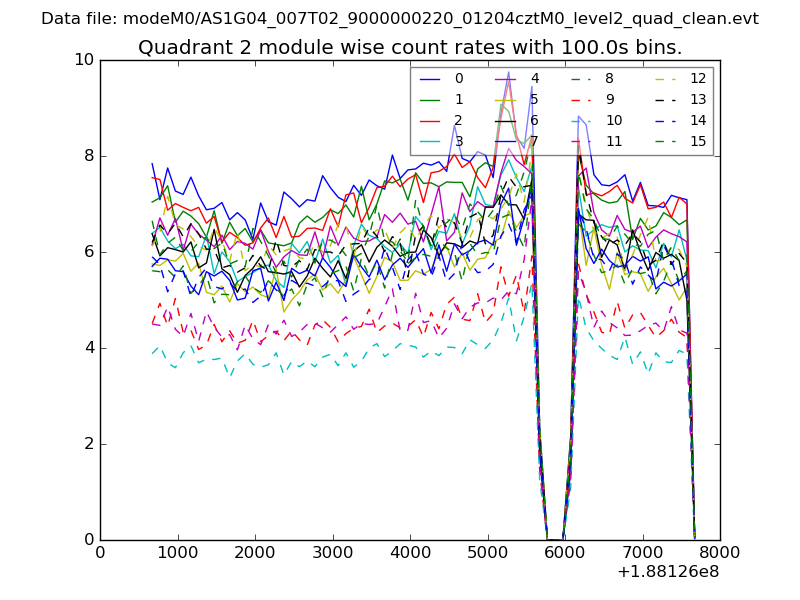
| Module-wise count rates for Quadrant B Data is divided into 100 sec bins |
 |
 |
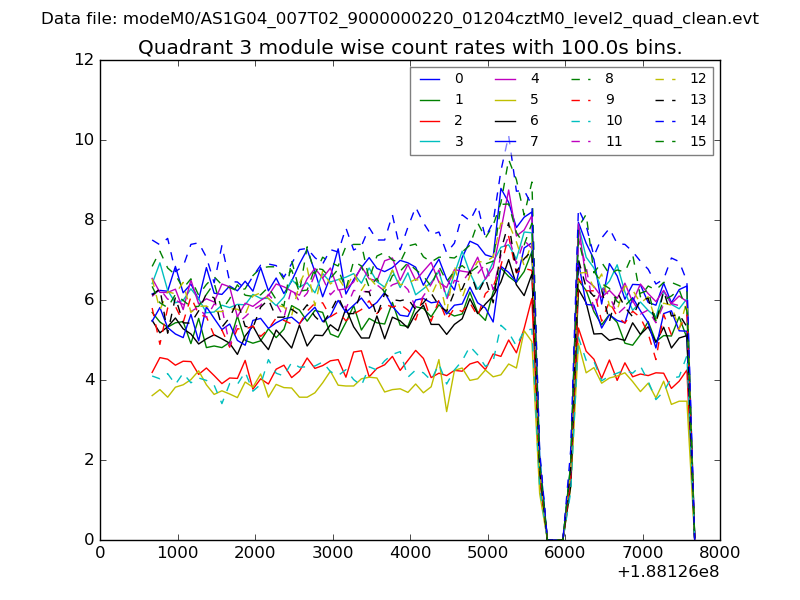
| Module-wise count rates for Quadrant C Data is divided into 100 sec bins |
 |
 |
| Module-wise count rates for Quadrant D Data is divided into 100 sec bins |
 |
 |
| Parameter | Plot |
|---|---|
| CZT HV Monitor | 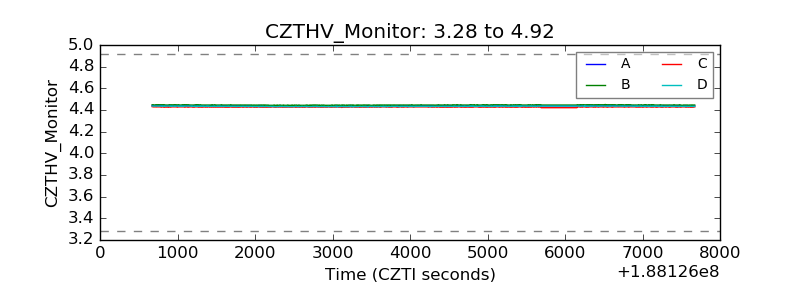 |
| D_VDD | 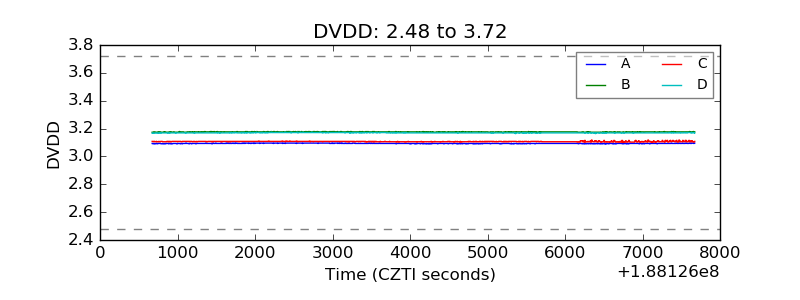 |
| Temperature 1 | 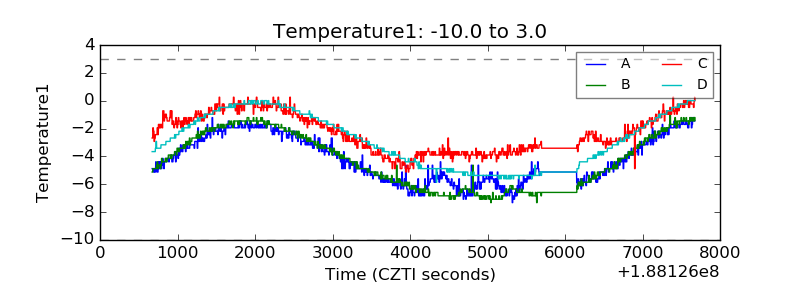 |
| Veto HV Monitor | 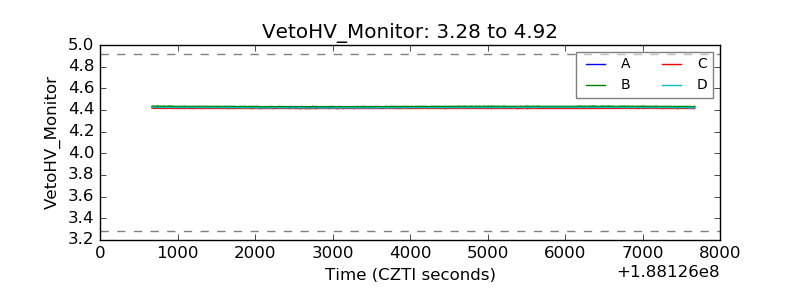 |
| Veto LLD | 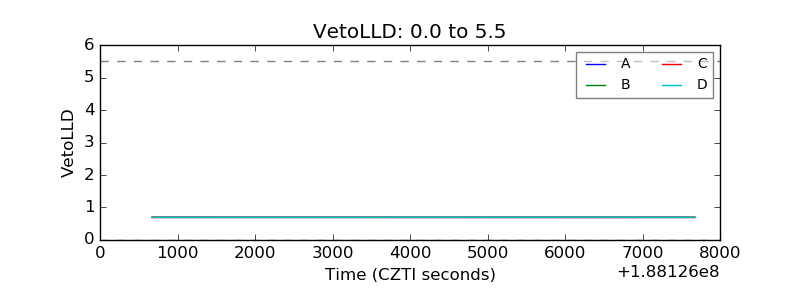 |
| Alpha Counter | 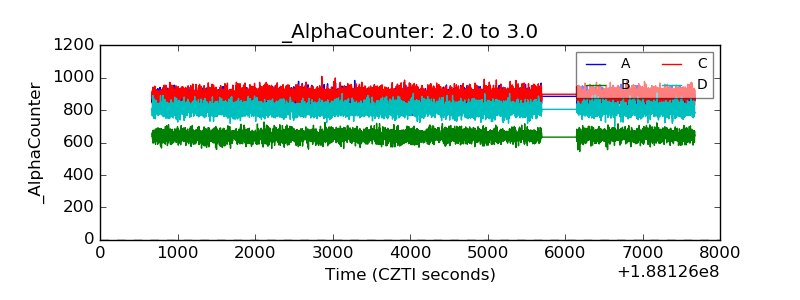 |
| _CPM_Rate | 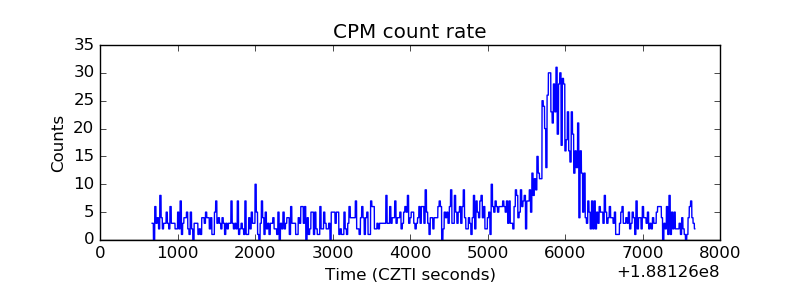 |
| CZT Counter | 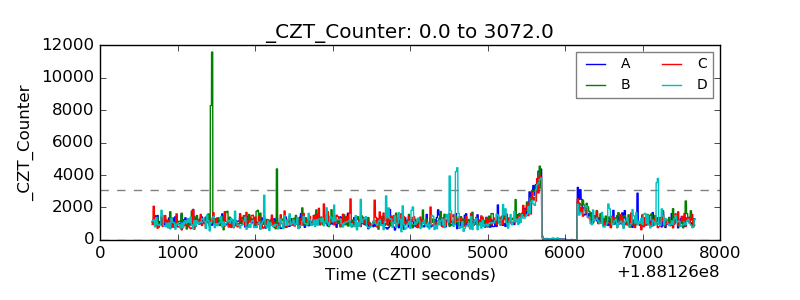 |
| +2.5 Volts monitor |  |
| +5 Volts monitor |  |
| _ROLL_ROT | 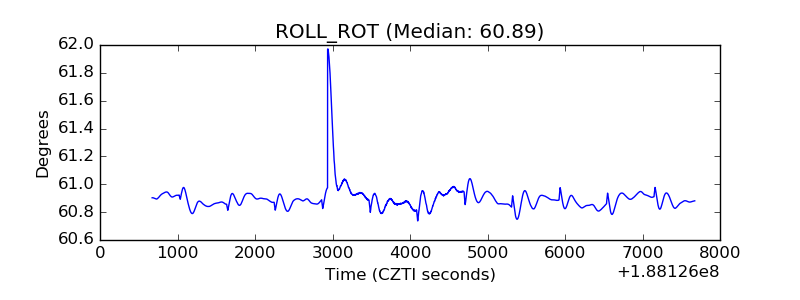 |
| _Roll_DEC | 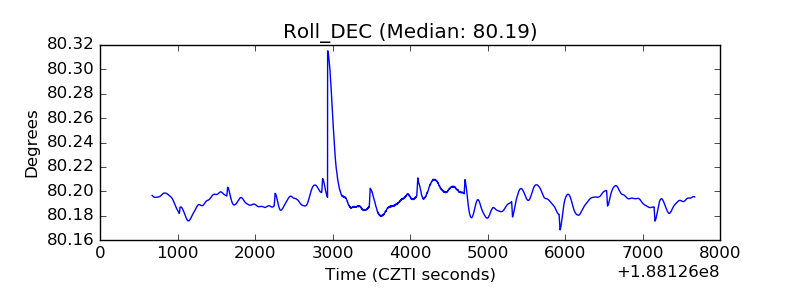 |
| _Roll_RA | 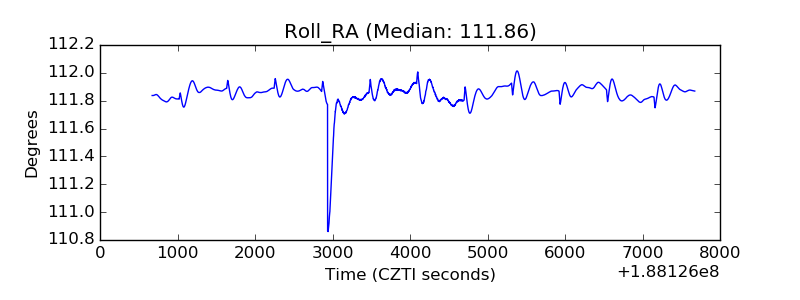 |
| Veto Counter | 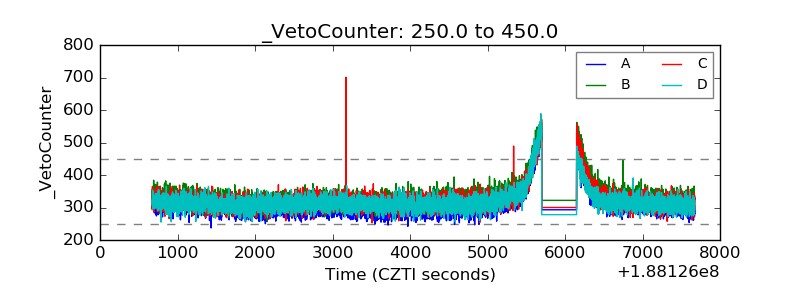 |