| Param | Original file | Final file |
|---|---|---|
| Filename | modeM0/AS1G04_007T02_9000000220_01205cztM0_level2.evt | modeM0/AS1G04_007T02_9000000220_01205cztM0_level2_quad_clean.evt |
| Size (bytes) | 1,276,790,400 | 114,549,120 |
| Size | 1.2 GB | 109.2 MB |
| Events in quadrant A | 9,351,706 | 758,892 |
| Events in quadrant B | 9,701,420 | 752,771 |
| Events in quadrant C | 9,309,509 | 724,339 |
| Events in quadrant D | 9,795,515 | 697,558 |
| Mode M0 | |||
|---|---|---|---|
| Quadrant | BADHDUFLAG | Total packets | Discarded packets |
| A | 0 | 33220 | 1 |
| B | 0 | 34294 | 0 |
| C | 0 | 33110 | 0 |
| D | 0 | 34647 | 0 |
| Mode SS | |||
|---|---|---|---|
| Quadrant | BADHDUFLAG | Total packets | Discarded packets |
| A | 0 | 154 | 0 |
| B | 0 | 154 | 0 |
| C | 0 | 154 | 0 |
| D | 0 | 154 | 0 |
| Quadrant | Total seconds | Saturated seconds | Saturation percentage |
|---|---|---|---|
| A | 7702 | 9 | 0.116853% |
| B | 7702 | 4 | 0.051935% |
| C | 7702 | 5 | 0.064918% |
| D | 7702 | 402 | 5.219424% |
Noise dominated data is calculated using 1-second bins in cleaned event files. If a bin has >2000 counts, and if more than 50% of those come from <1% of pixels, then it is considered to be noise-dominated and hence unusable.
| Quadrant | # 1 sec bins | Bins with >0 counts | Bins with >2000 counts | High rate bins dominated by noise | Noise dominated (total time) | Noise dominated (detector-on time) | Marked lightcurve |
|---|---|---|---|---|---|---|---|
| A | 7702 | 7702 | 331 | 331 | 4.30% | 4.30% | 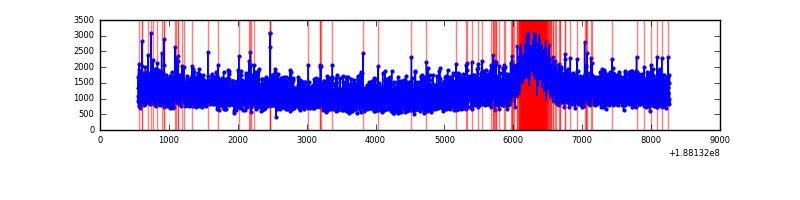 |
| B | 7702 | 7702 | 317 | 317 | 4.12% | 4.12% | 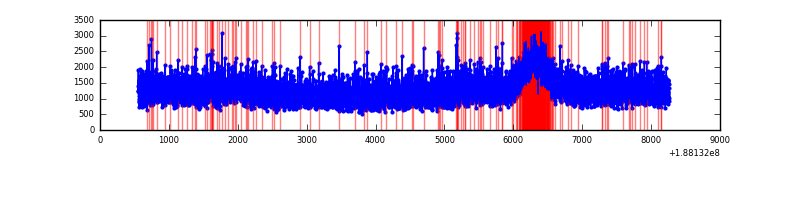 |
| C | 7702 | 7702 | 278 | 278 | 3.61% | 3.61% | 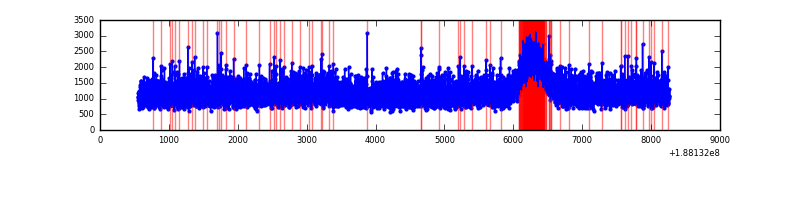 |
| D | 7702 | 7702 | 758 | 758 | 9.84% | 9.84% | 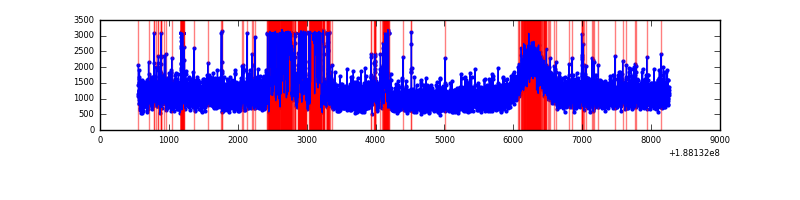 |
Top three noisy pixels from each quadrant. If the there are fewer than three noisy pixels in the level2.evt file, extra rows are filled as -1
| Pixel properties | Quadrant properties | ||||||
|---|---|---|---|---|---|---|---|
| Quadrant | DetID | PixID | Counts | Sigma | Mean | Median | Sigma |
| A | 12 | 243 | 19231 | 28.67 | 2430 | 2447 | 585.5 |
| A | 11 | 79 | 11999 | 16.31 | 2430 | 2447 | 585.5 |
| A | 3 | 111 | 7390 | 8.44 | 2430 | 2447 | 585.5 |
| B | 15 | 22 | 91569 | 150.82 | 2483 | 2496 | 590.6 |
| B | 7 | 221 | 30923 | 48.13 | 2483 | 2496 | 590.6 |
| B | 6 | 53 | 30554 | 47.51 | 2483 | 2496 | 590.6 |
| C | 15 | 241 | 411526 | 653.21 | 2250 | 2331 | 626.4 |
| C | 3 | 79 | 56497 | 86.47 | 2250 | 2331 | 626.4 |
| C | 3 | 111 | 42440 | 64.03 | 2250 | 2331 | 626.4 |
| D | 13 | 70 | 1158889 | 1711.88 | 2178 | 2263 | 675.6 |
| D | 1 | 83 | 296509 | 435.5 | 2178 | 2263 | 675.6 |
| D | 13 | 205 | 44013 | 61.79 | 2178 | 2263 | 675.6 |
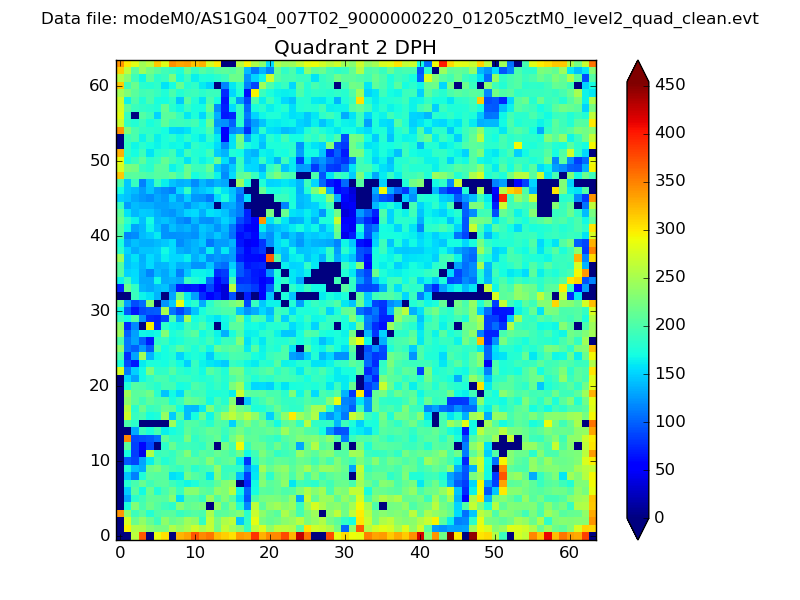
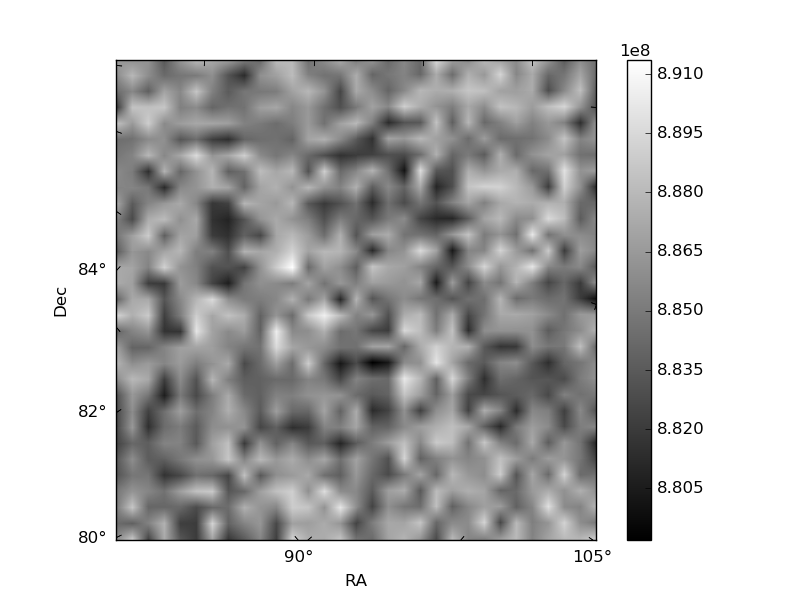
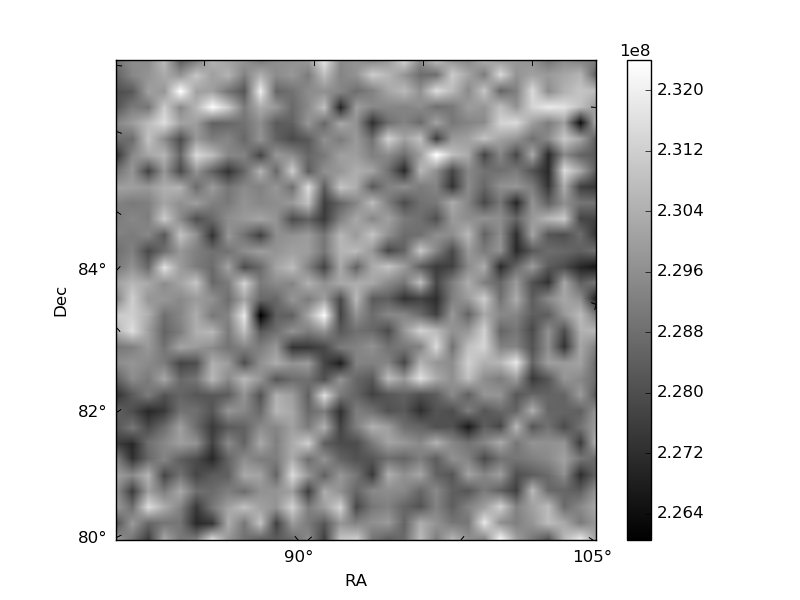
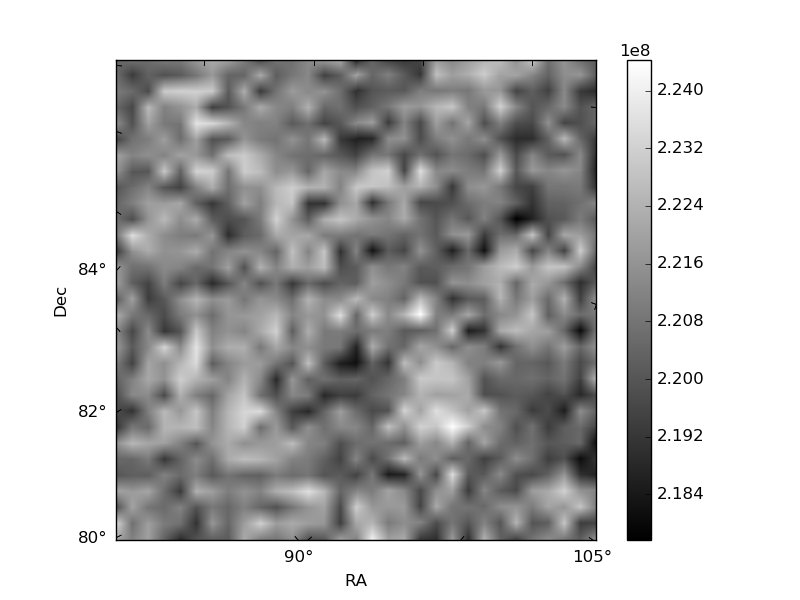
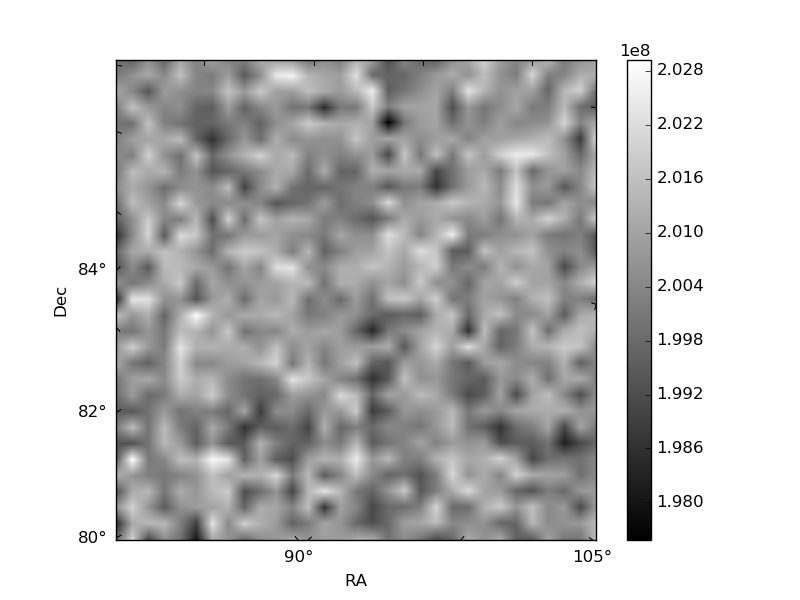
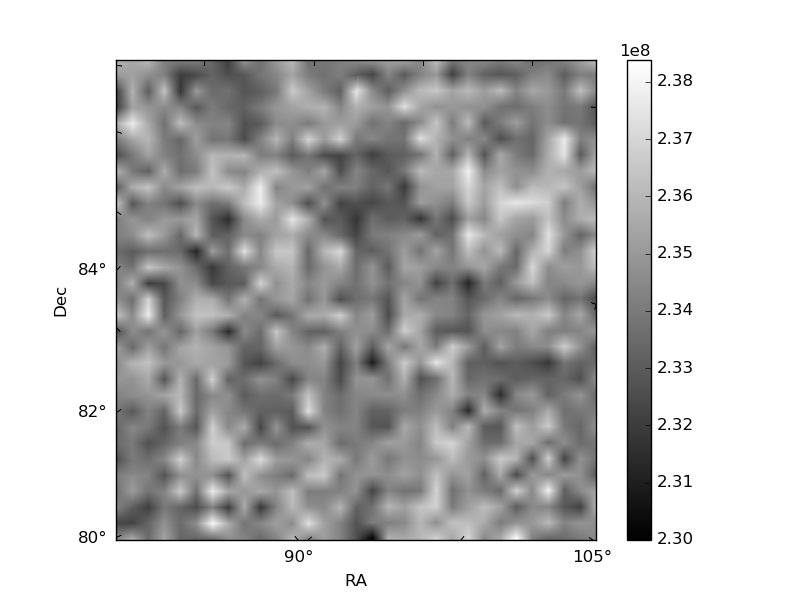
Histogram calculated using DETX and DETY for each event in the final _common_clean file
| Quadrant A | 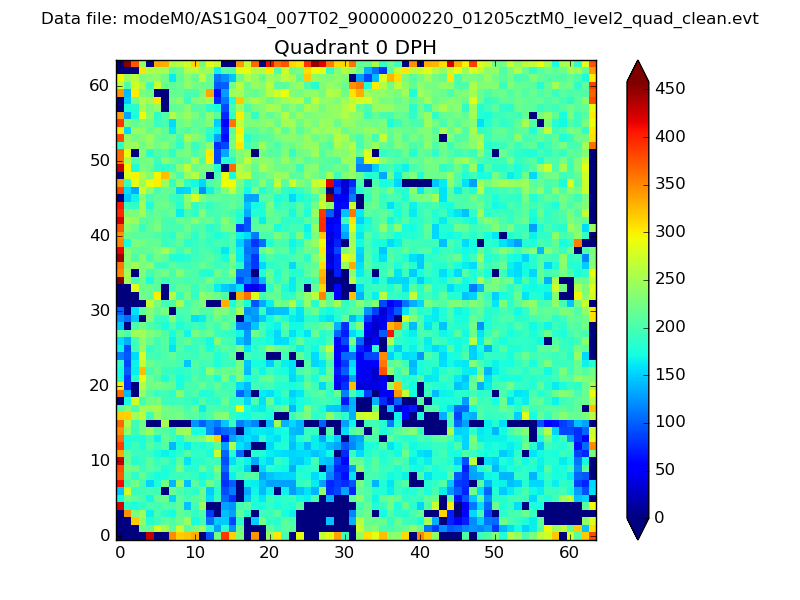 |
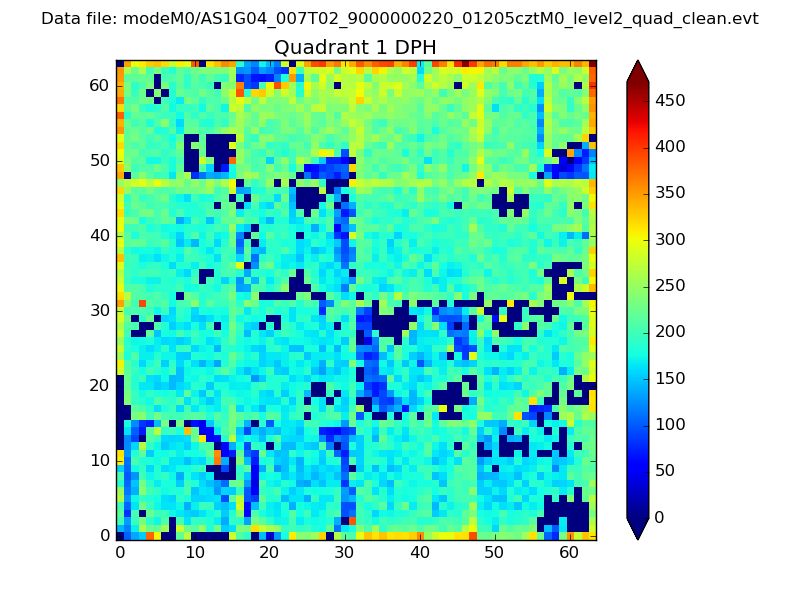 |
Quadrant B |
|---|---|---|---|
| Quadrant D | 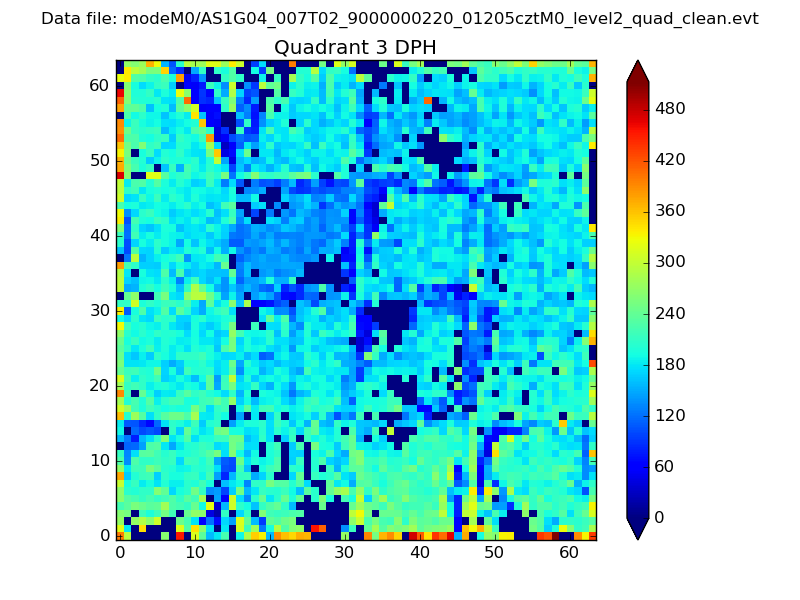 |
 |
Quadrant C |
| Plot type | Count rate plots | Images |
|---|---|---|
| Comparison with Poisson distribution Blue bars denote a histogram of data divided into 1 sec bins. Red curve is a Poisson curve with rate = median count rate of data. |
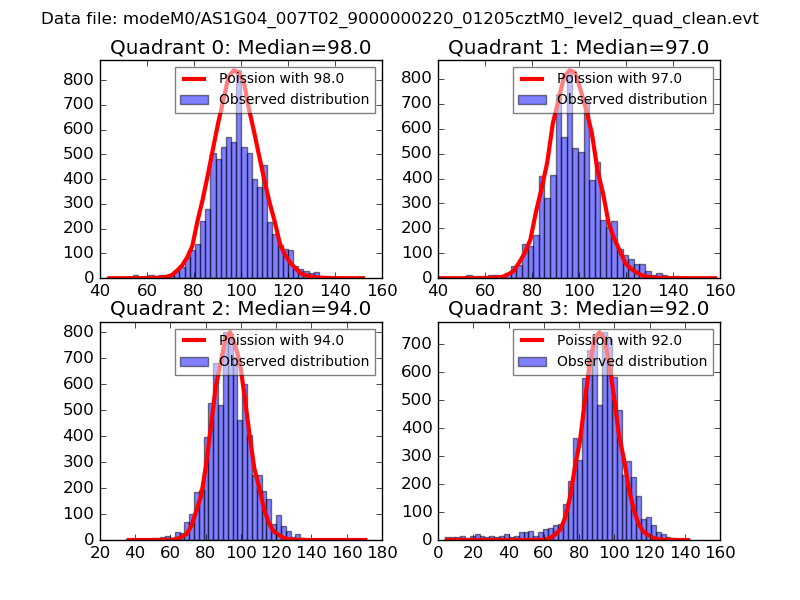 |
 |
| Quadrant-wise count rates Data is divided into 100 sec bins |
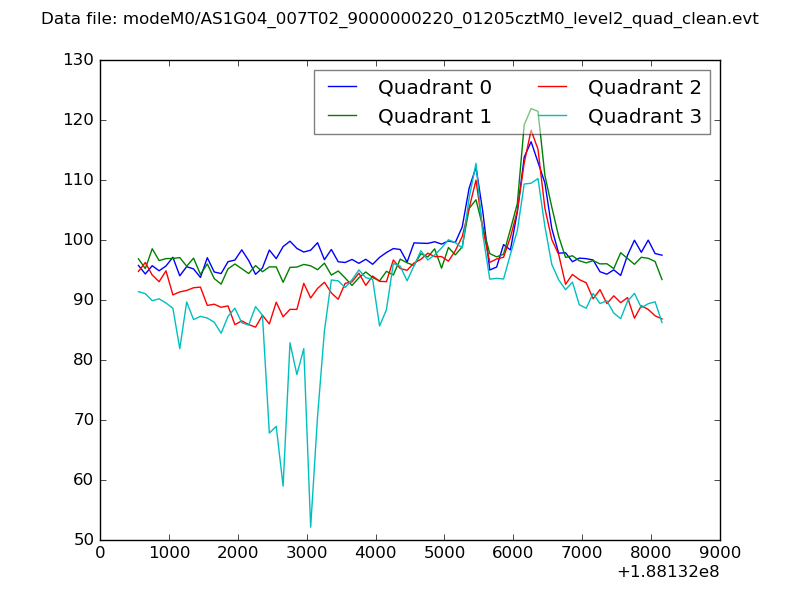 |
|
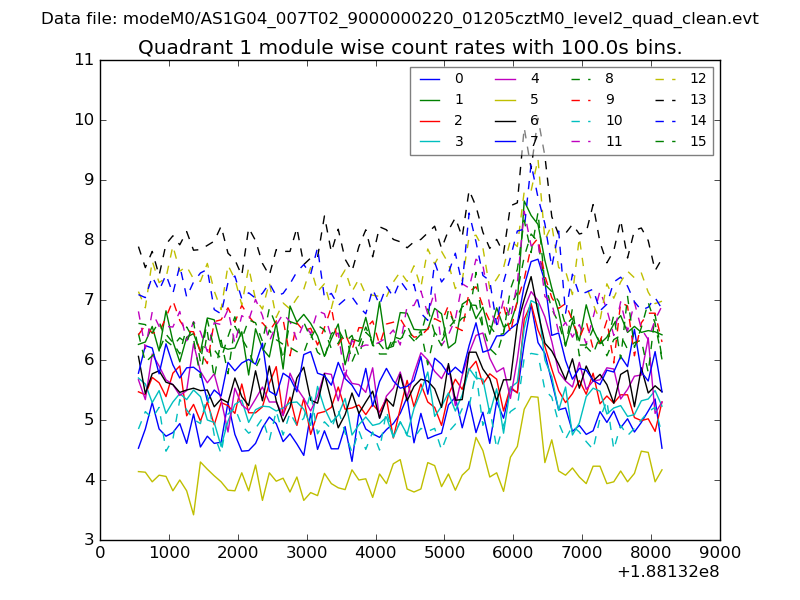
| Module-wise count rates for Quadrant A Data is divided into 100 sec bins |
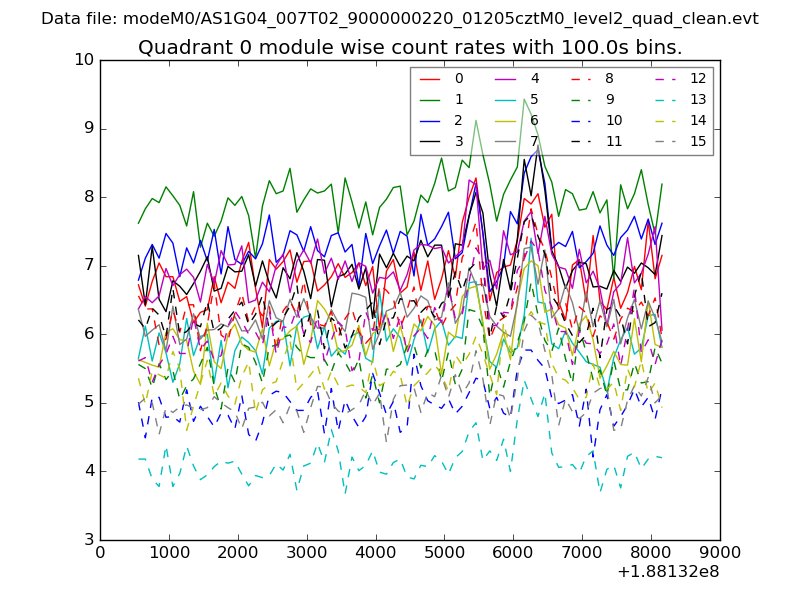 |
 |
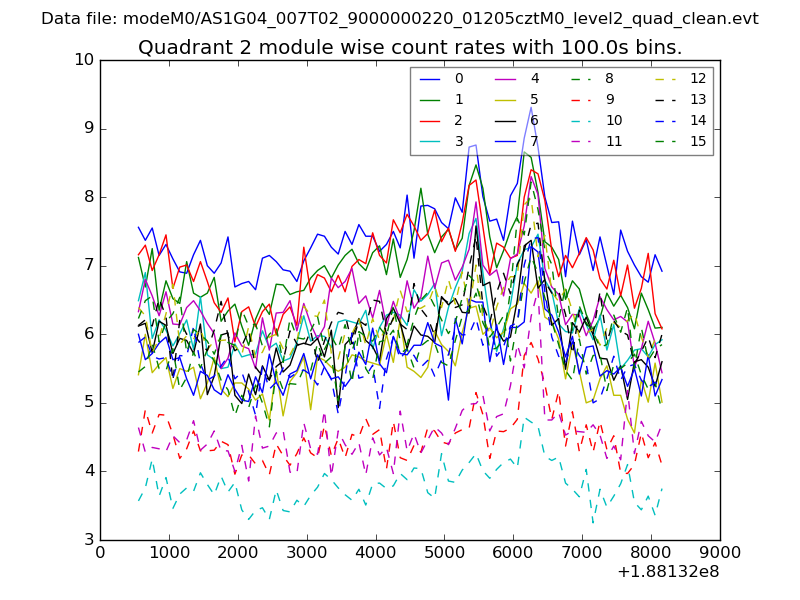
| Module-wise count rates for Quadrant B Data is divided into 100 sec bins |
 |
 |
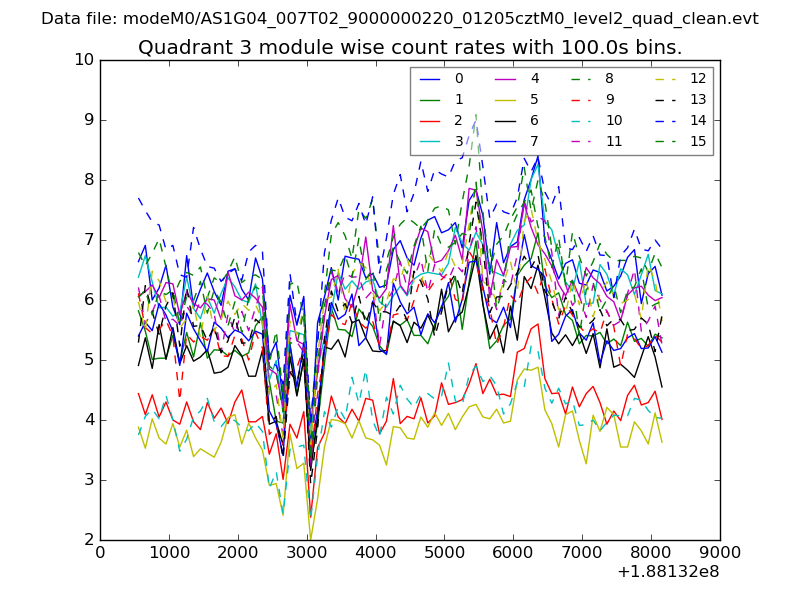
| Module-wise count rates for Quadrant C Data is divided into 100 sec bins |
 |
 |
| Module-wise count rates for Quadrant D Data is divided into 100 sec bins |
 |
 |
| Parameter | Plot |
|---|---|
| CZT HV Monitor | 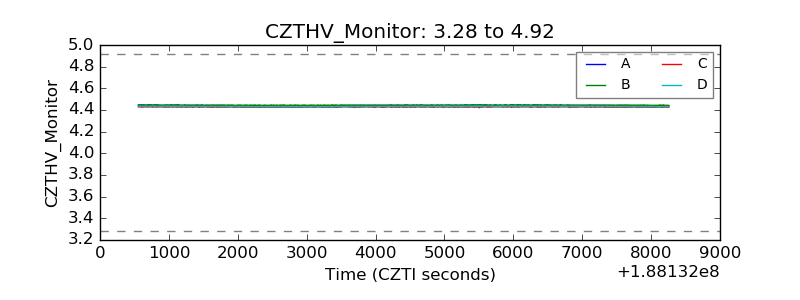 |
| D_VDD | 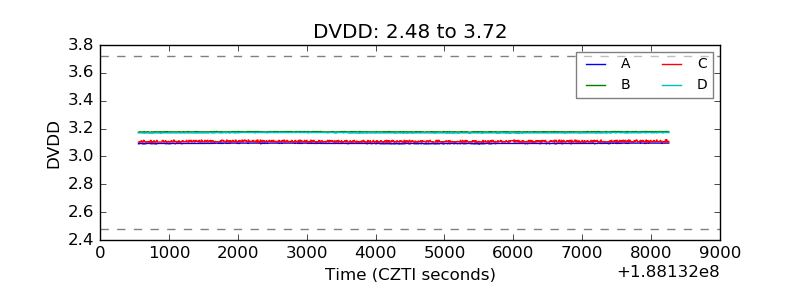 |
| Temperature 1 | 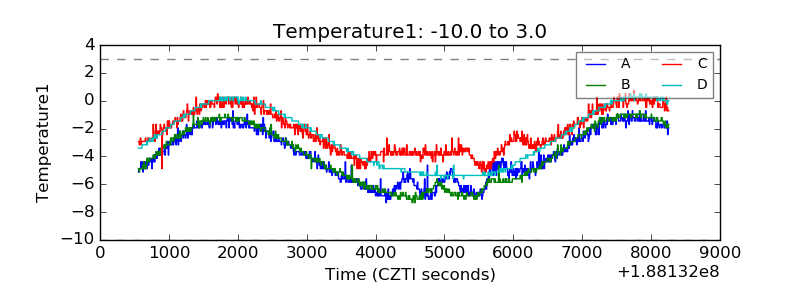 |
| Veto HV Monitor | 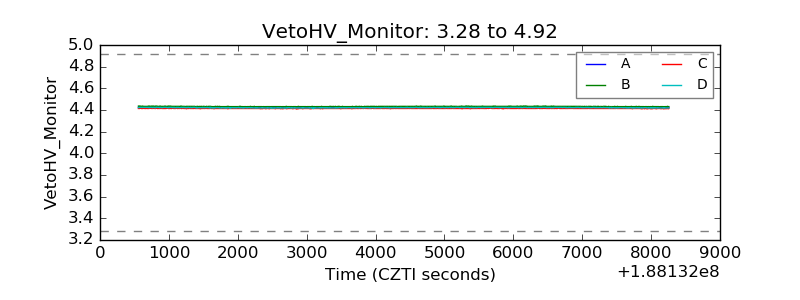 |
| Veto LLD | 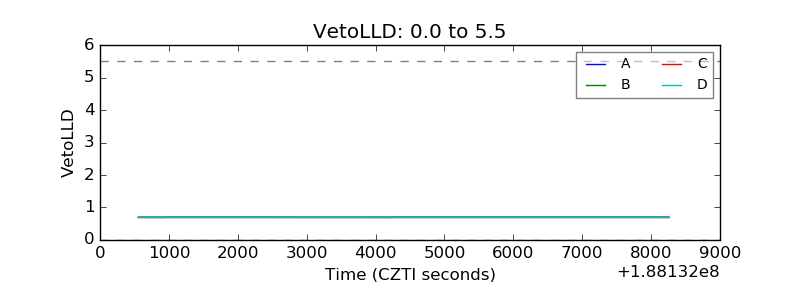 |
| Alpha Counter | 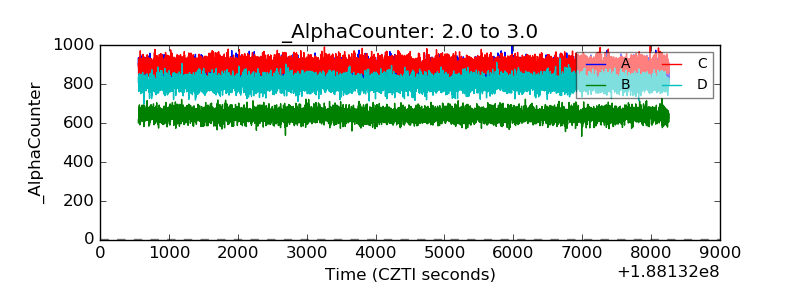 |
| _CPM_Rate | 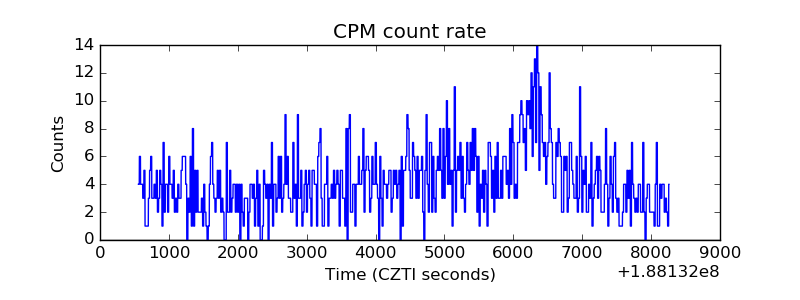 |
| CZT Counter | 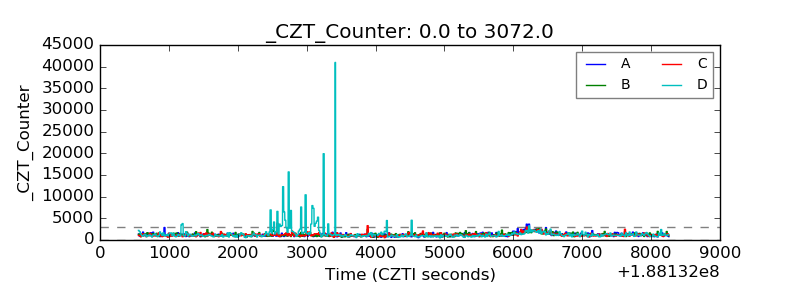 |
| +2.5 Volts monitor |  |
| +5 Volts monitor | 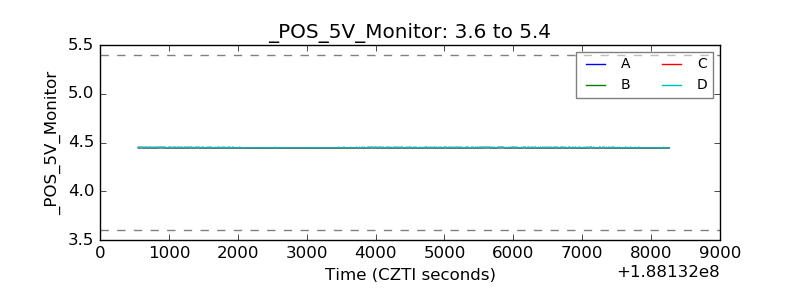 |
| _ROLL_ROT | 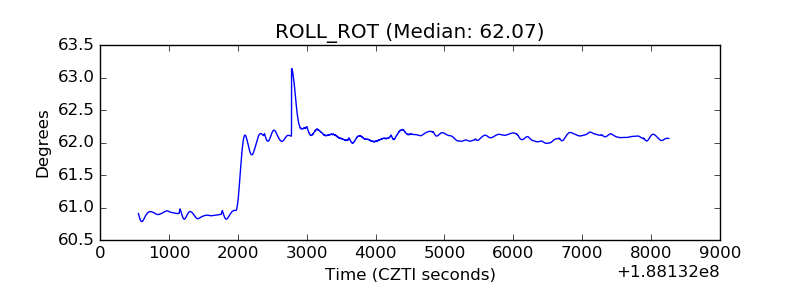 |
| _Roll_DEC | 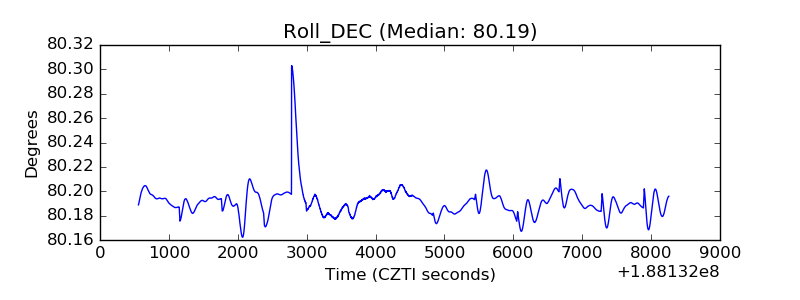 |
| _Roll_RA | 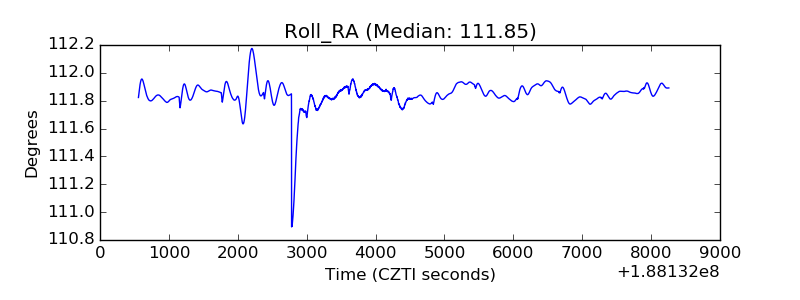 |
| Veto Counter | 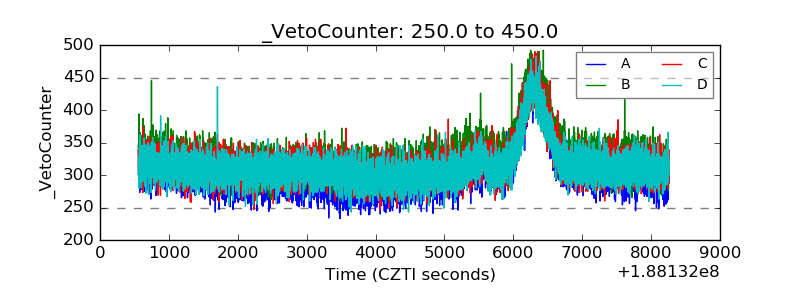 |