| Param | Original file | Final file |
|---|---|---|
| Filename | modeM0/AS1G04_007T02_9000000220_01206cztM0_level2.evt | modeM0/AS1G04_007T02_9000000220_01206cztM0_level2_quad_clean.evt |
| Size (bytes) | 1,144,969,920 | 102,211,200 |
| Size | 1.1 GB | 97.5 MB |
| Events in quadrant A | 8,463,969 | 674,982 |
| Events in quadrant B | 8,926,318 | 667,605 |
| Events in quadrant C | 8,385,060 | 642,971 |
| Events in quadrant D | 8,445,186 | 630,887 |
| Mode M0 | |||
|---|---|---|---|
| Quadrant | BADHDUFLAG | Total packets | Discarded packets |
| A | 0 | 30013 | 1 |
| B | 0 | 31397 | 0 |
| C | 0 | 29768 | 0 |
| D | 0 | 30037 | 0 |
| Mode SS | |||
|---|---|---|---|
| Quadrant | BADHDUFLAG | Total packets | Discarded packets |
| A | 0 | 138 | 0 |
| B | 0 | 138 | 0 |
| C | 0 | 138 | 0 |
| D | 0 | 138 | 0 |
| Quadrant | Total seconds | Saturated seconds | Saturation percentage |
|---|---|---|---|
| A | 6873 | 79 | 1.149425% |
| B | 6873 | 35 | 0.509239% |
| C | 6873 | 3 | 0.043649% |
| D | 6873 | 242 | 3.521024% |
Noise dominated data is calculated using 1-second bins in cleaned event files. If a bin has >2000 counts, and if more than 50% of those come from <1% of pixels, then it is considered to be noise-dominated and hence unusable.
| Quadrant | # 1 sec bins | Bins with >0 counts | Bins with >2000 counts | High rate bins dominated by noise | Noise dominated (total time) | Noise dominated (detector-on time) | Marked lightcurve |
|---|---|---|---|---|---|---|---|
| A | 6873 | 6873 | 312 | 312 | 4.54% | 4.54% | 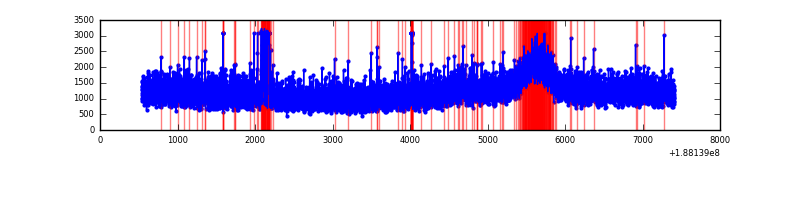 |
| B | 6873 | 6873 | 404 | 404 | 5.88% | 5.88% |  |
| C | 6873 | 6873 | 255 | 255 | 3.71% | 3.71% | 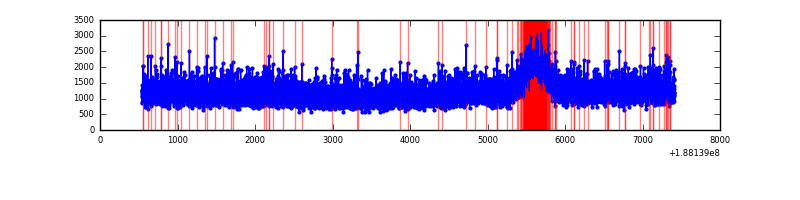 |
| D | 6873 | 6873 | 552 | 552 | 8.03% | 8.03% |  |
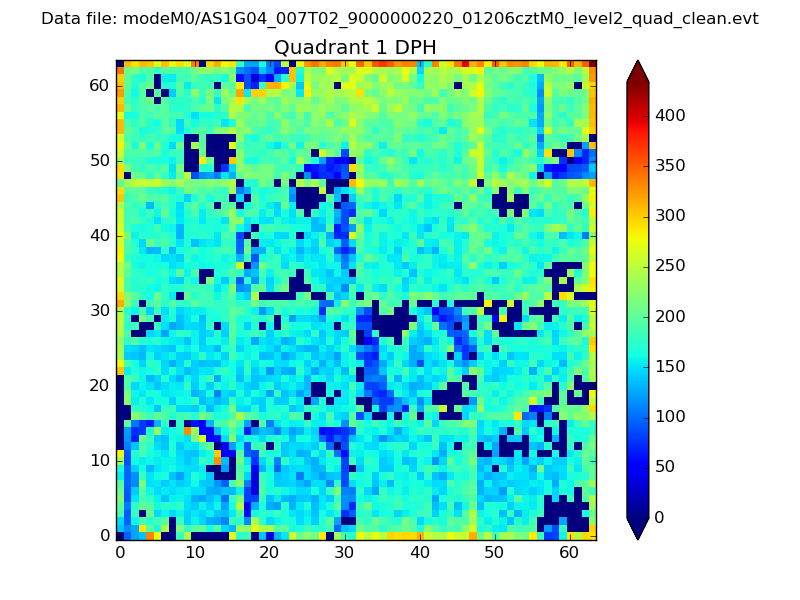
Top three noisy pixels from each quadrant. If the there are fewer than three noisy pixels in the level2.evt file, extra rows are filled as -1
| Pixel properties | Quadrant properties | ||||||
|---|---|---|---|---|---|---|---|
| Quadrant | DetID | PixID | Counts | Sigma | Mean | Median | Sigma |
| A | 12 | 243 | 226755 | 435.22 | 2137 | 2147 | 516.1 |
| A | 0 | 51 | 27972 | 50.04 | 2137 | 2147 | 516.1 |
| A | 11 | 79 | 8995 | 13.27 | 2137 | 2147 | 516.1 |
| B | 5 | 191 | 260211 | 488.73 | 2224 | 2232 | 527.9 |
| B | 15 | 22 | 91133 | 168.42 | 2224 | 2232 | 527.9 |
| B | 7 | 221 | 29393 | 51.46 | 2224 | 2232 | 527.9 |
| C | 15 | 241 | 366552 | 643.74 | 2025 | 2097 | 566.2 |
| C | 3 | 79 | 60325 | 102.85 | 2025 | 2097 | 566.2 |
| C | 3 | 111 | 41090 | 68.87 | 2025 | 2097 | 566.2 |
| D | 13 | 70 | 715358 | 1167.23 | 1967 | 2039 | 611.1 |
| D | 2 | 41 | 105079 | 168.61 | 1967 | 2039 | 611.1 |
| D | 9 | 66 | 77531 | 123.53 | 1967 | 2039 | 611.1 |
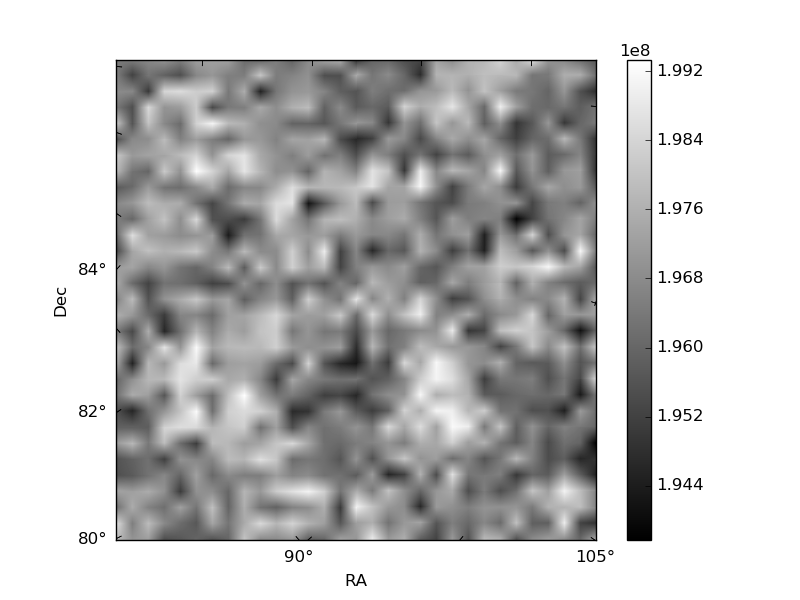
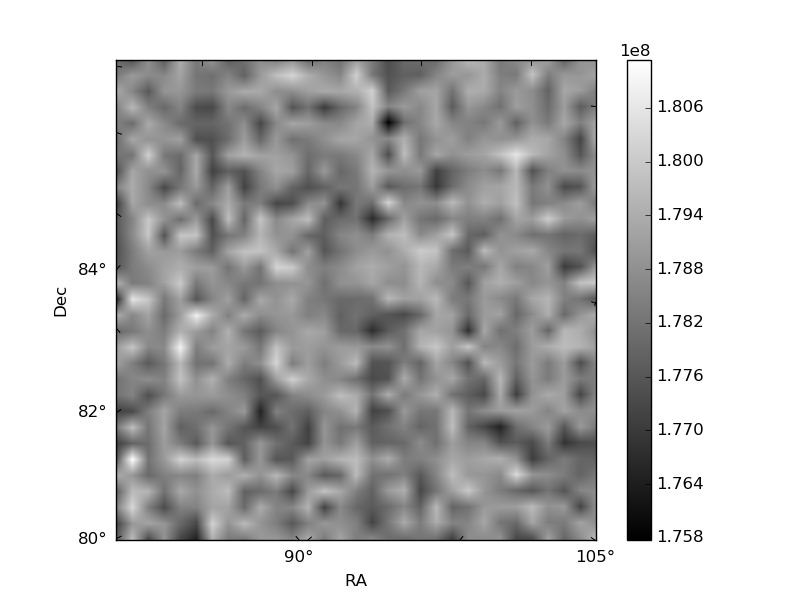
Histogram calculated using DETX and DETY for each event in the final _common_clean file
| Quadrant A | 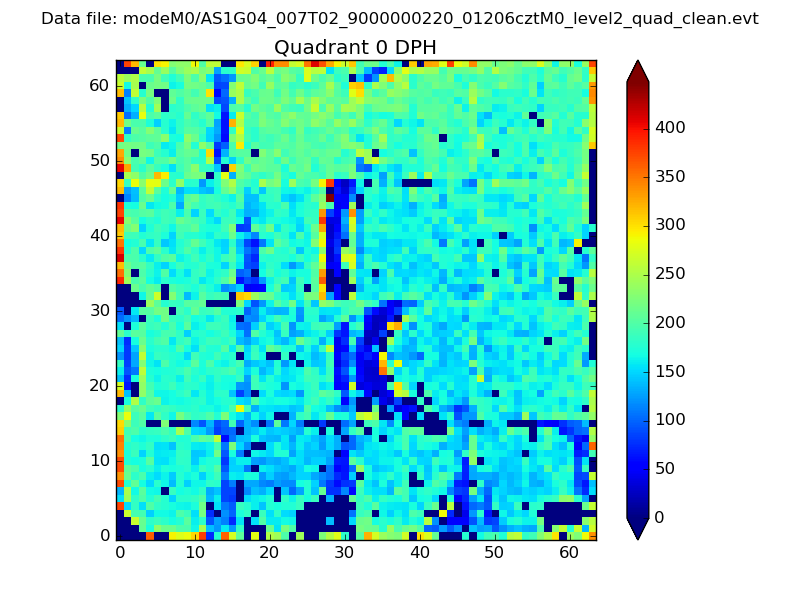 |
 |
Quadrant B |
|---|---|---|---|
| Quadrant D | 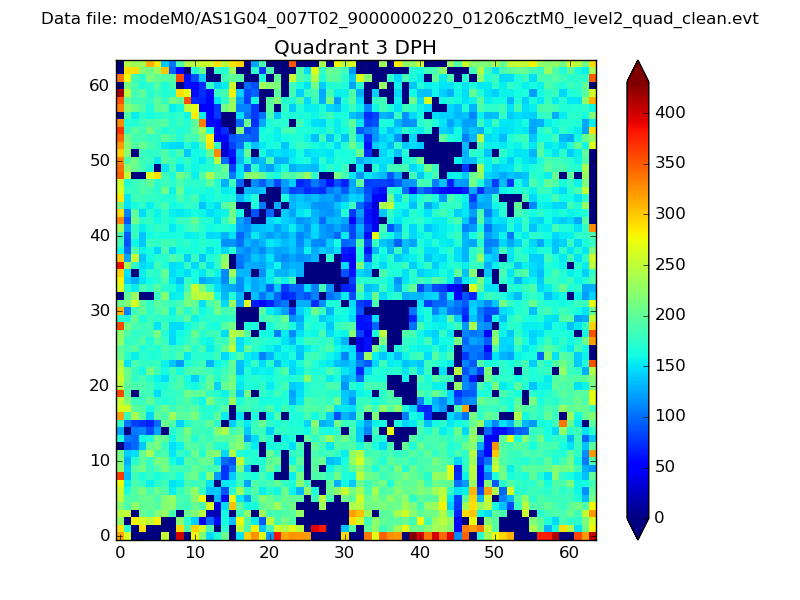 |
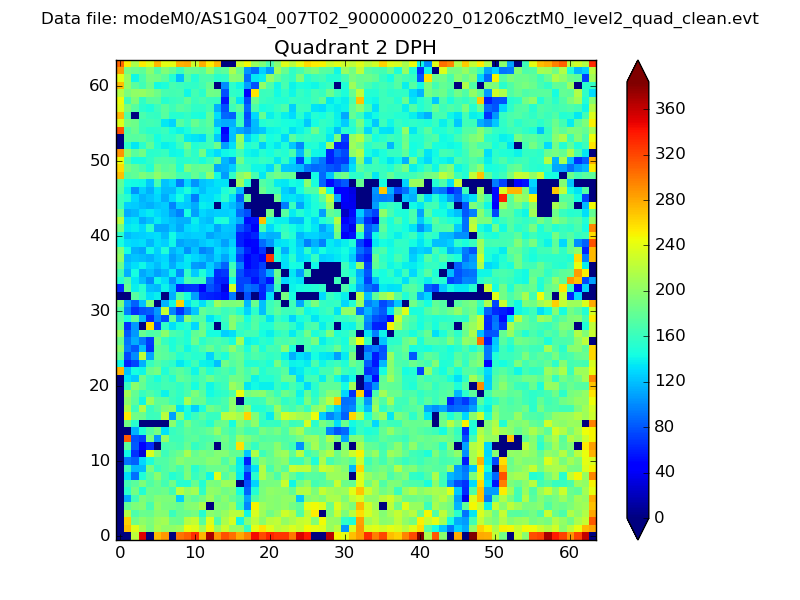 |
Quadrant C |
| Plot type | Count rate plots | Images |
|---|---|---|
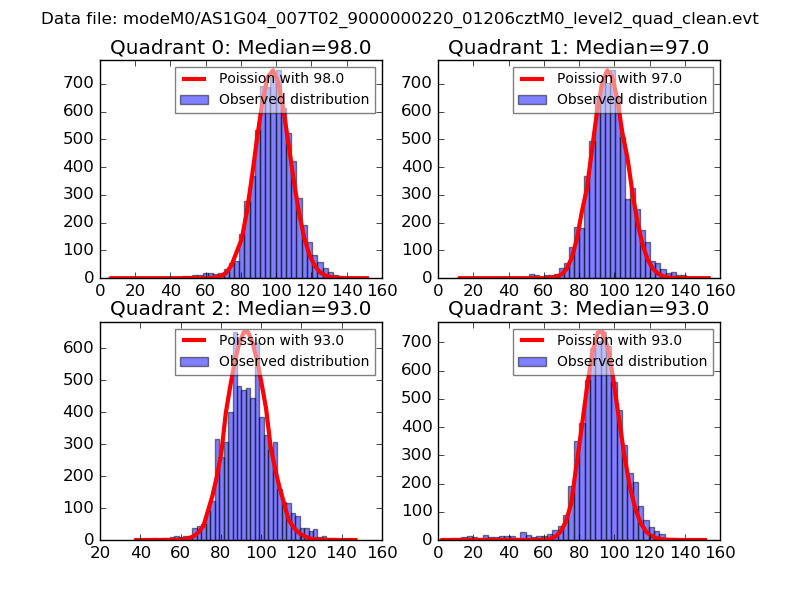
| Comparison with Poisson distribution Blue bars denote a histogram of data divided into 1 sec bins. Red curve is a Poisson curve with rate = median count rate of data. |
 |
 |
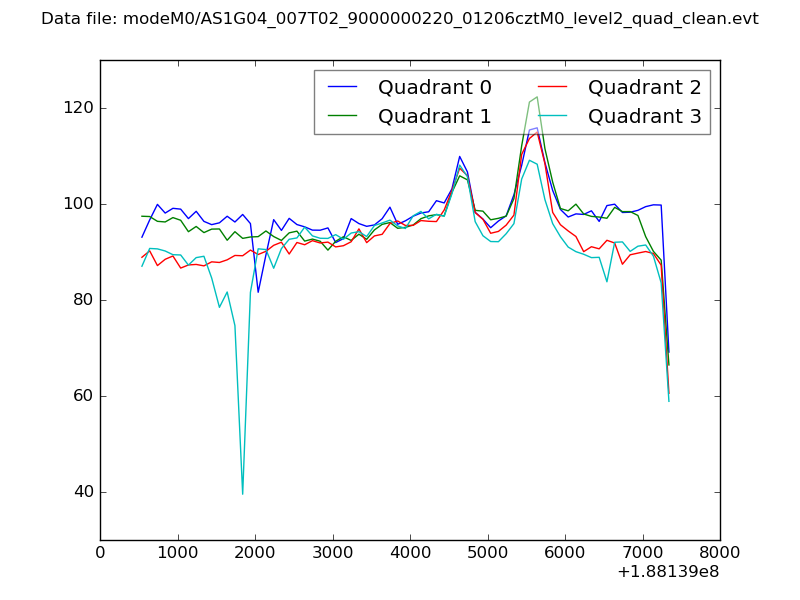
| Quadrant-wise count rates Data is divided into 100 sec bins |
 |
|
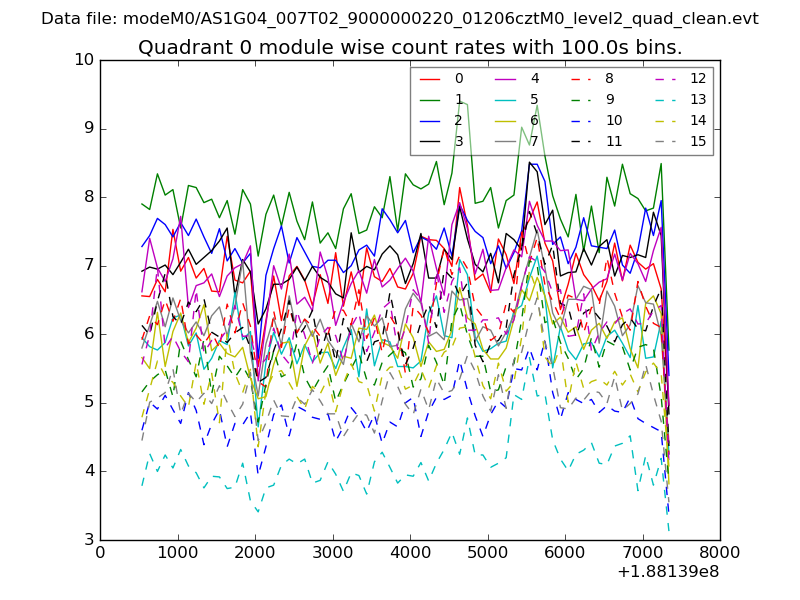
| Module-wise count rates for Quadrant A Data is divided into 100 sec bins |
 |
 |
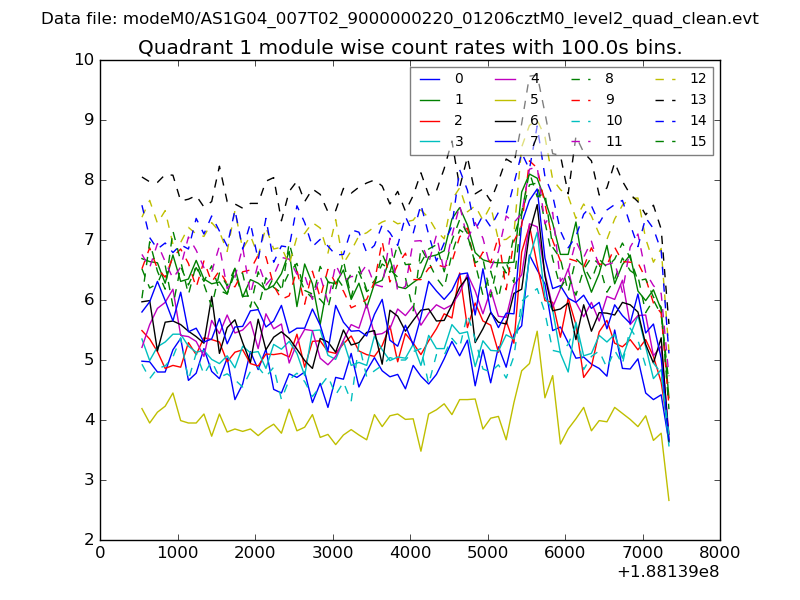
| Module-wise count rates for Quadrant B Data is divided into 100 sec bins |
 |
 |
| Module-wise count rates for Quadrant C Data is divided into 100 sec bins |
 |
 |
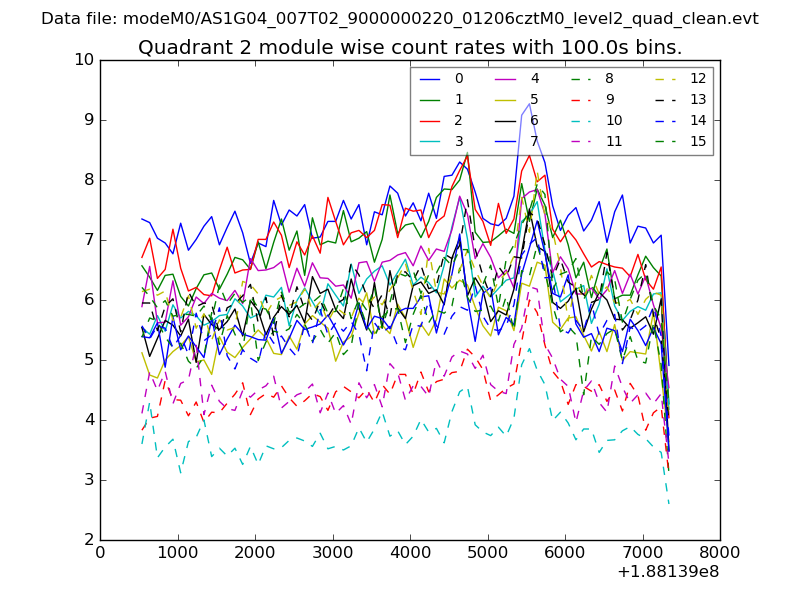
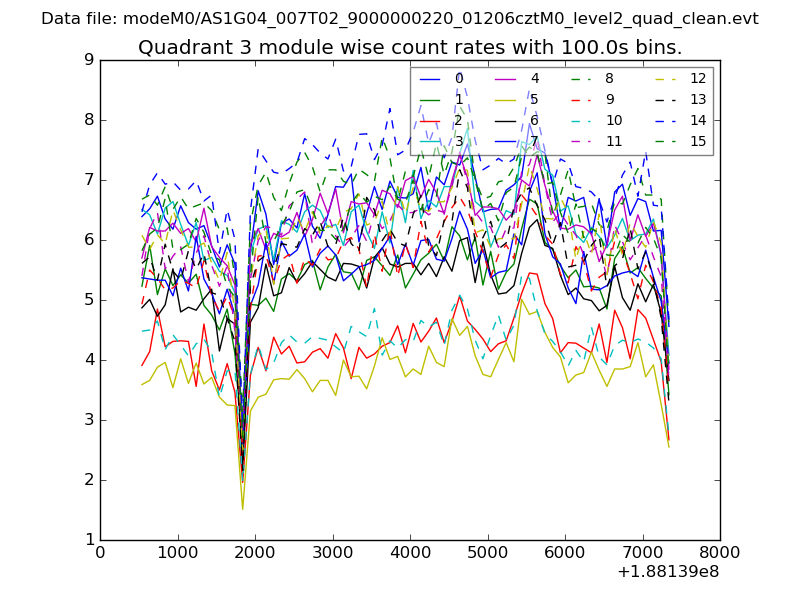
| Module-wise count rates for Quadrant D Data is divided into 100 sec bins |
 |
 |
| Parameter | Plot |
|---|---|
| CZT HV Monitor | 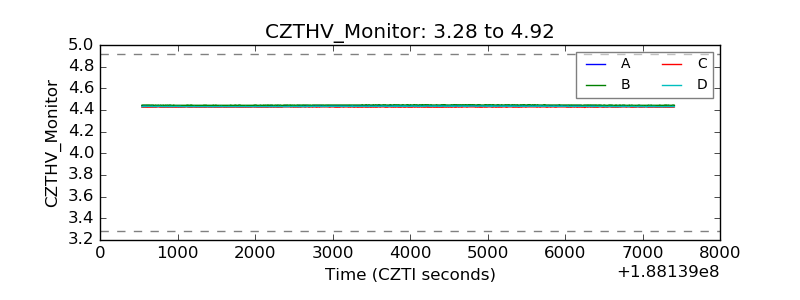 |
| D_VDD | 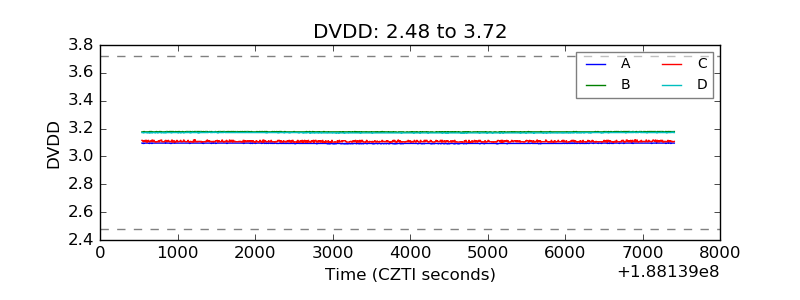 |
| Temperature 1 | 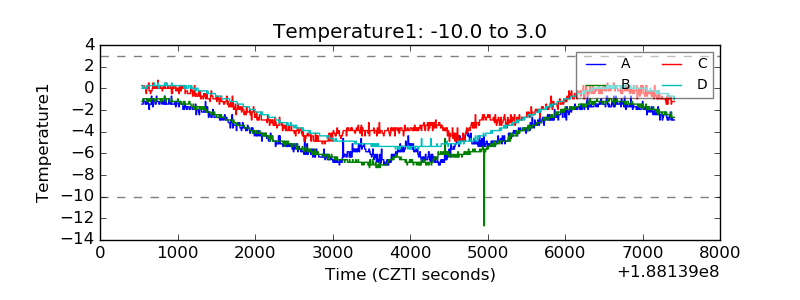 |
| Veto HV Monitor | 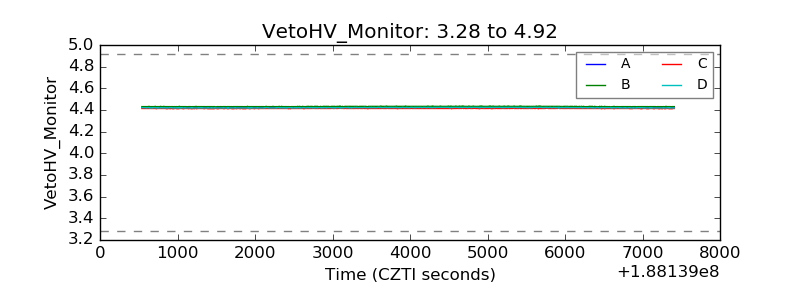 |
| Veto LLD | 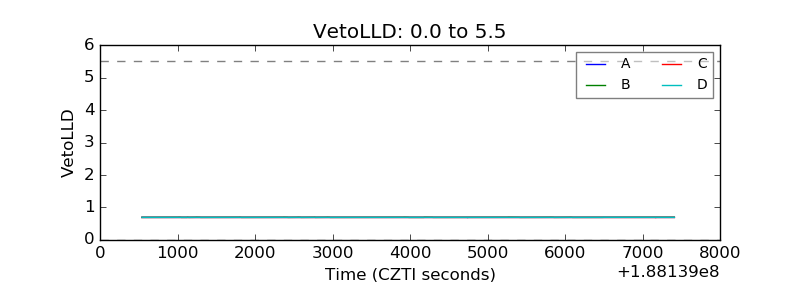 |
| Alpha Counter | 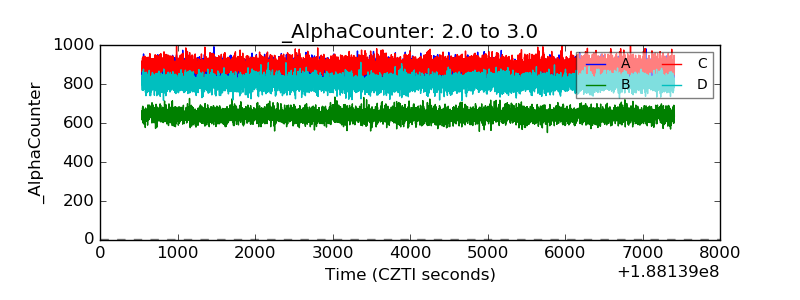 |
| _CPM_Rate | 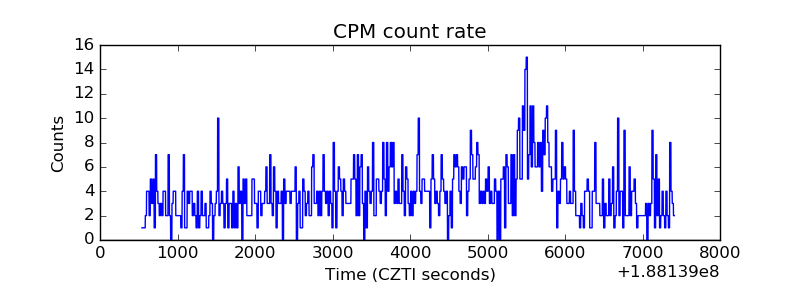 |
| CZT Counter | 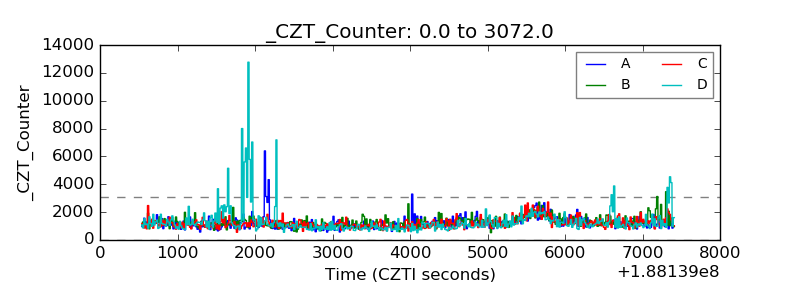 |
| +2.5 Volts monitor |  |
| +5 Volts monitor |  |
| _ROLL_ROT | 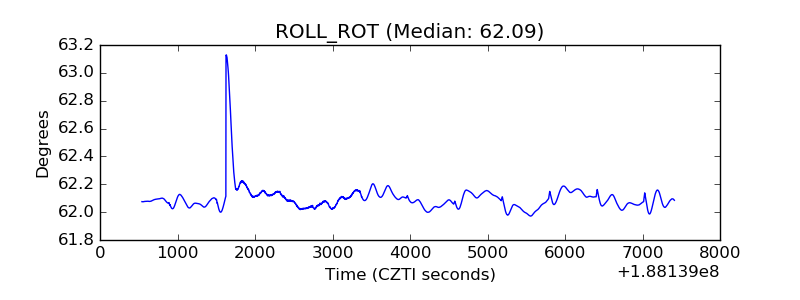 |
| _Roll_DEC | 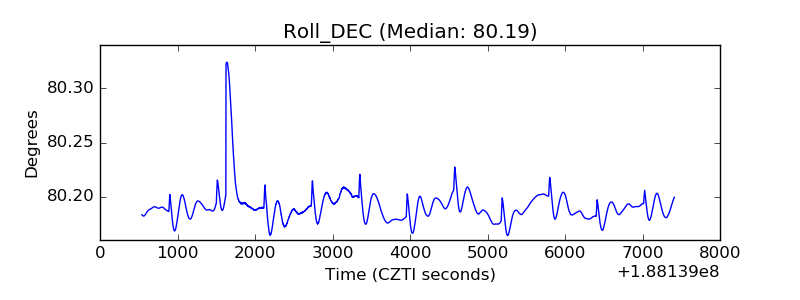 |
| _Roll_RA | 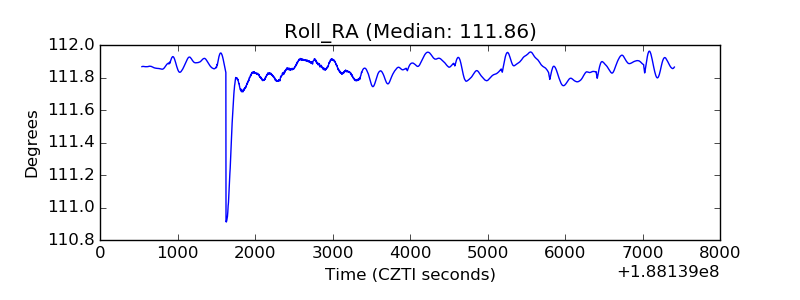 |
| Veto Counter | 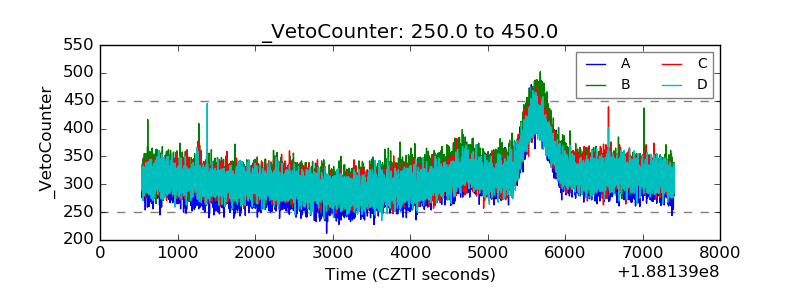 |