| Param | Original file | Final file |
|---|---|---|
| Filename | modeM0/AS1G04_007T02_9000000220_01207cztM0_level2.evt | modeM0/AS1G04_007T02_9000000220_01207cztM0_level2_quad_clean.evt |
| Size (bytes) | 1,148,935,680 | 104,857,920 |
| Size | 1.1 GB | 100.0 MB |
| Events in quadrant A | 8,451,099 | 691,368 |
| Events in quadrant B | 8,982,887 | 683,715 |
| Events in quadrant C | 8,546,012 | 658,480 |
| Events in quadrant D | 8,349,141 | 651,495 |
| Mode M9 | |||
|---|---|---|---|
| Quadrant | BADHDUFLAG | Total packets | Discarded packets |
| A | 0 | 3 | 0 |
| B | 0 | 3 | 0 |
| C | 0 | 3 | 0 |
| D | 0 | 3 | 0 |
| Mode M0 | |||
|---|---|---|---|
| Quadrant | BADHDUFLAG | Total packets | Discarded packets |
| A | 0 | 30118 | 2 |
| B | 0 | 31705 | 1 |
| C | 0 | 30370 | 1 |
| D | 0 | 29873 | 1 |
| Mode SS | |||
|---|---|---|---|
| Quadrant | BADHDUFLAG | Total packets | Discarded packets |
| A | 0 | 142 | 0 |
| B | 0 | 142 | 0 |
| C | 0 | 142 | 0 |
| D | 0 | 142 | 0 |
| Quadrant | Total seconds | Saturated seconds | Saturation percentage |
|---|---|---|---|
| A | 7046 | 7 | 0.099347% |
| B | 7046 | 54 | 0.766392% |
| C | 7046 | 6 | 0.085155% |
| D | 7046 | 118 | 1.674709% |
Noise dominated data is calculated using 1-second bins in cleaned event files. If a bin has >2000 counts, and if more than 50% of those come from <1% of pixels, then it is considered to be noise-dominated and hence unusable.
| Quadrant | # 1 sec bins | Bins with >0 counts | Bins with >2000 counts | High rate bins dominated by noise | Noise dominated (total time) | Noise dominated (detector-on time) | Marked lightcurve |
|---|---|---|---|---|---|---|---|
| A | 7326 | 7047 | 224 | 224 | 3.06% | 3.18% | 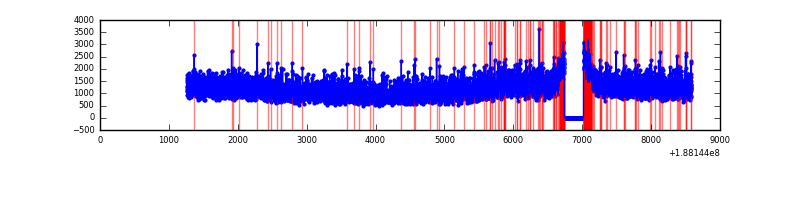 |
| B | 7326 | 7047 | 387 | 387 | 5.28% | 5.49% | 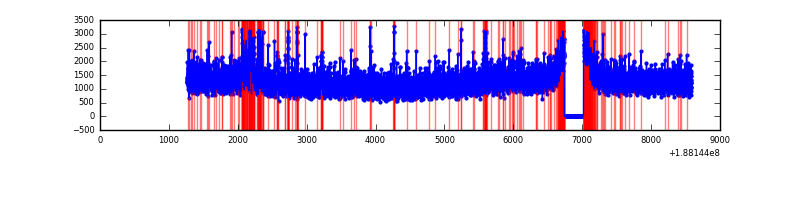 |
| C | 7326 | 7047 | 202 | 202 | 2.76% | 2.87% | 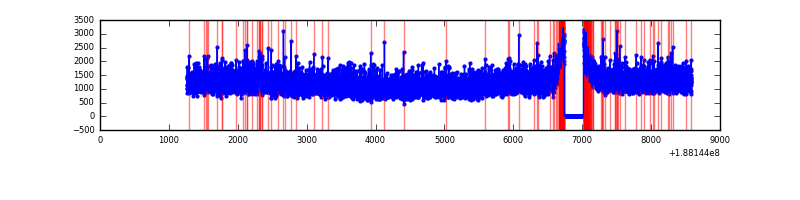 |
| D | 7326 | 7047 | 422 | 422 | 5.76% | 5.99% | 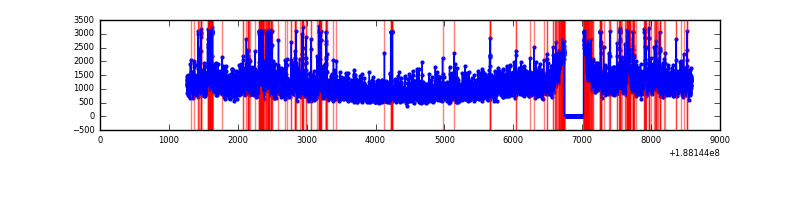 |
Top three noisy pixels from each quadrant. If the there are fewer than three noisy pixels in the level2.evt file, extra rows are filled as -1
| Pixel properties | Quadrant properties | ||||||
|---|---|---|---|---|---|---|---|
| Quadrant | DetID | PixID | Counts | Sigma | Mean | Median | Sigma |
| A | 8 | 14 | 50397 | 92.06 | 2181 | 2193 | 523.6 |
| A | 4 | 32 | 13614 | 21.81 | 2181 | 2193 | 523.6 |
| A | 11 | 79 | 9565 | 14.08 | 2181 | 2193 | 523.6 |
| B | 5 | 191 | 278568 | 518.25 | 2254 | 2266 | 533.1 |
| B | 15 | 22 | 49046 | 87.74 | 2254 | 2266 | 533.1 |
| B | 6 | 53 | 27256 | 46.87 | 2254 | 2266 | 533.1 |
| C | 15 | 241 | 375392 | 645.8 | 2064 | 2135 | 578.0 |
| C | 3 | 79 | 53440 | 88.77 | 2064 | 2135 | 578.0 |
| C | 3 | 111 | 38969 | 63.73 | 2064 | 2135 | 578.0 |
| D | 13 | 70 | 287805 | 458.27 | 2018 | 2093 | 623.5 |
| D | 13 | 205 | 173672 | 275.21 | 2018 | 2093 | 623.5 |
| D | 10 | 84 | 126807 | 200.04 | 2018 | 2093 | 623.5 |
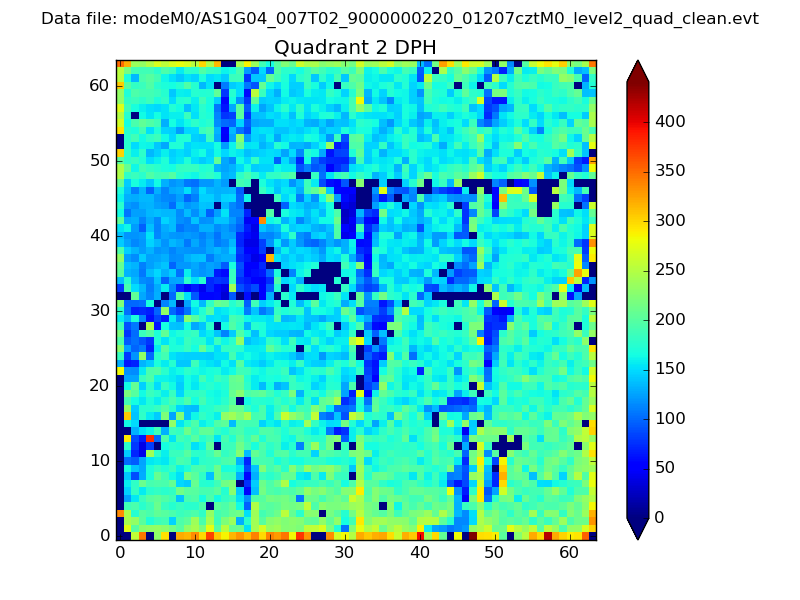
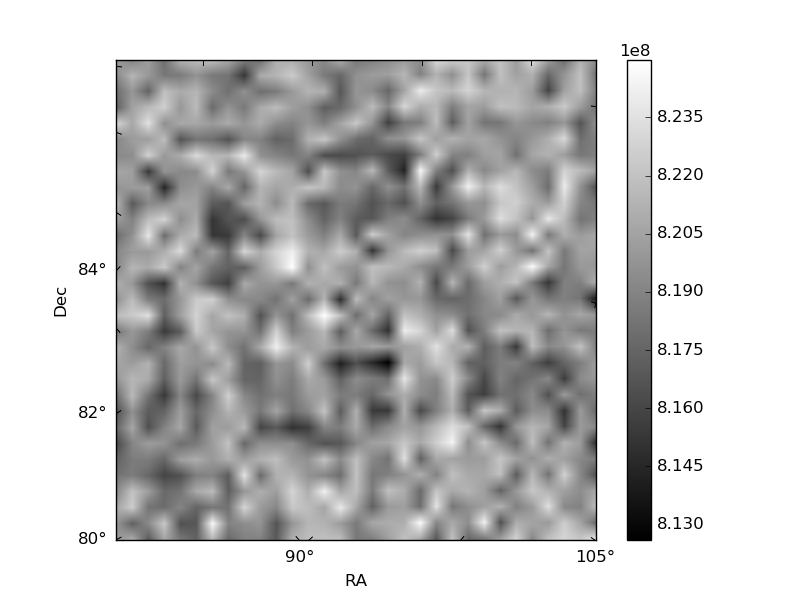
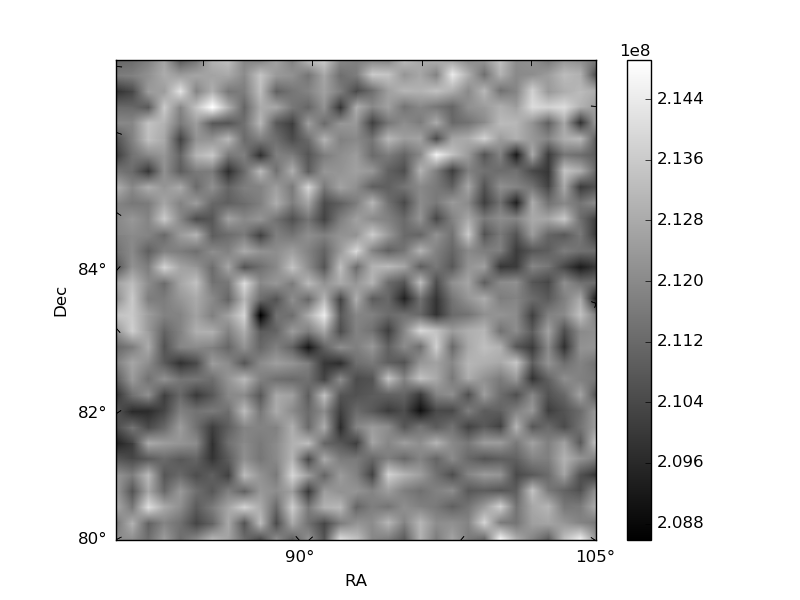
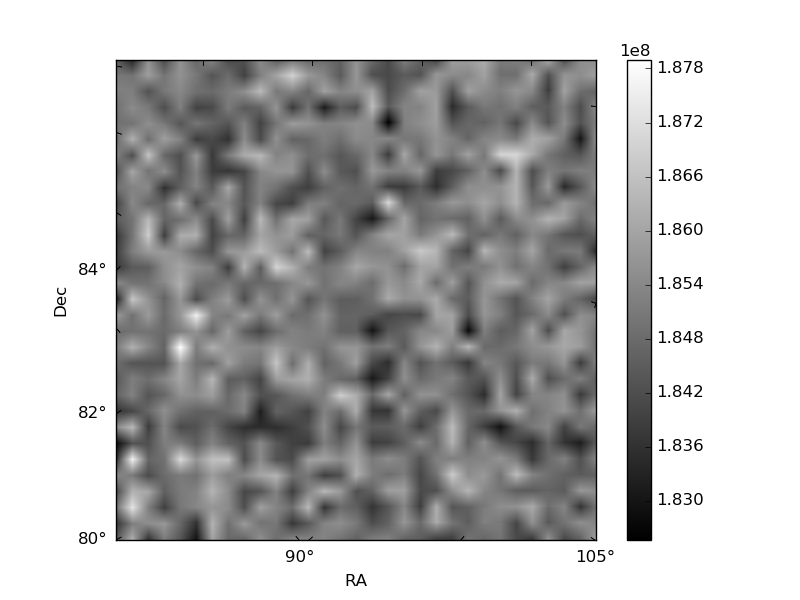
Histogram calculated using DETX and DETY for each event in the final _common_clean file
| Quadrant A | 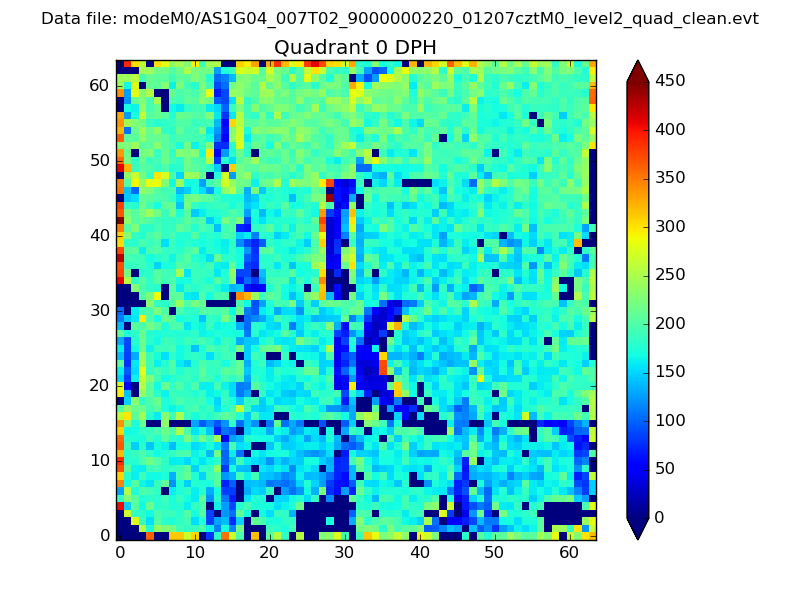 |
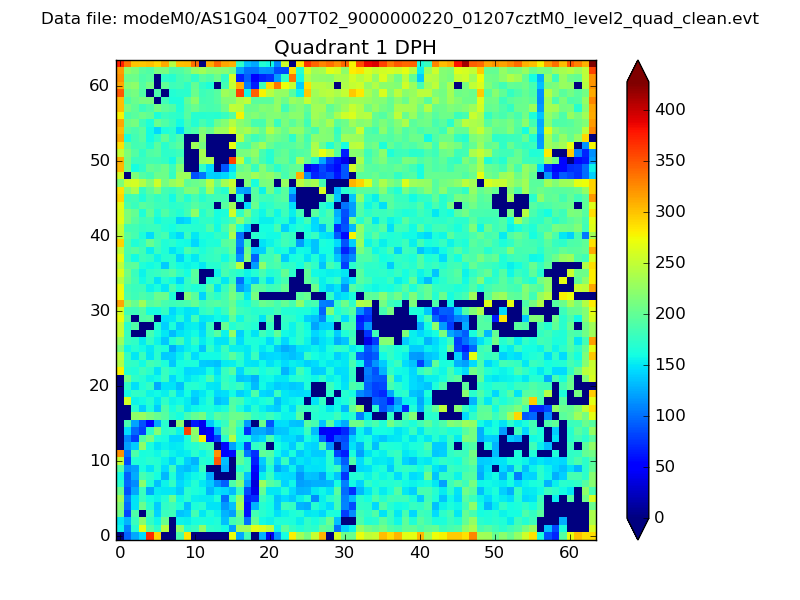 |
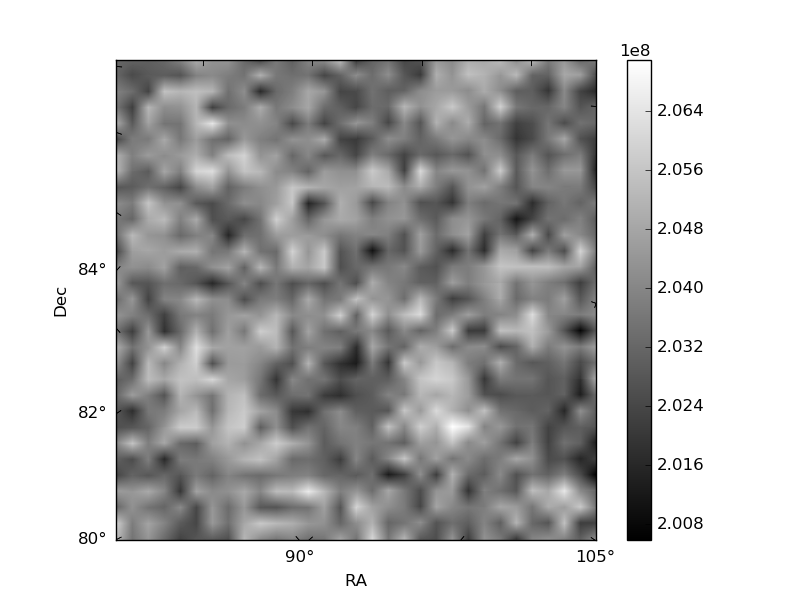
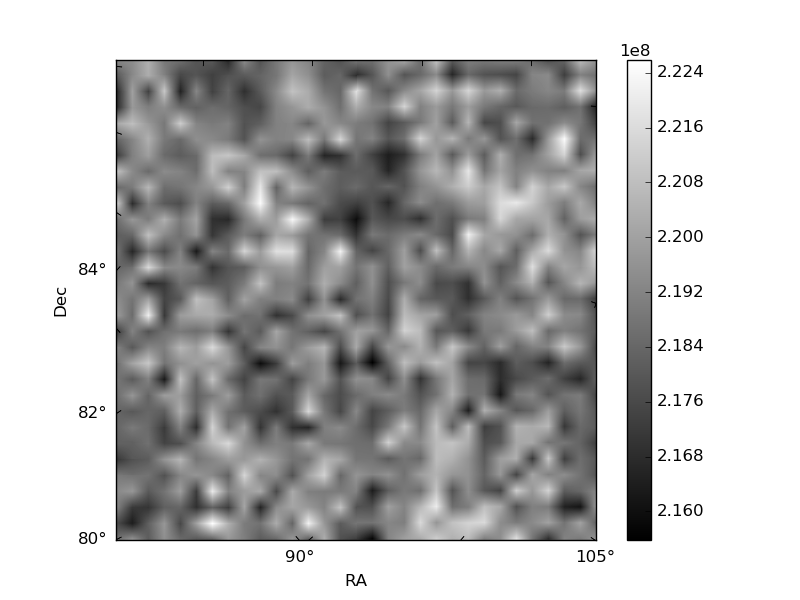
Quadrant B |
|---|---|---|---|
| Quadrant D | 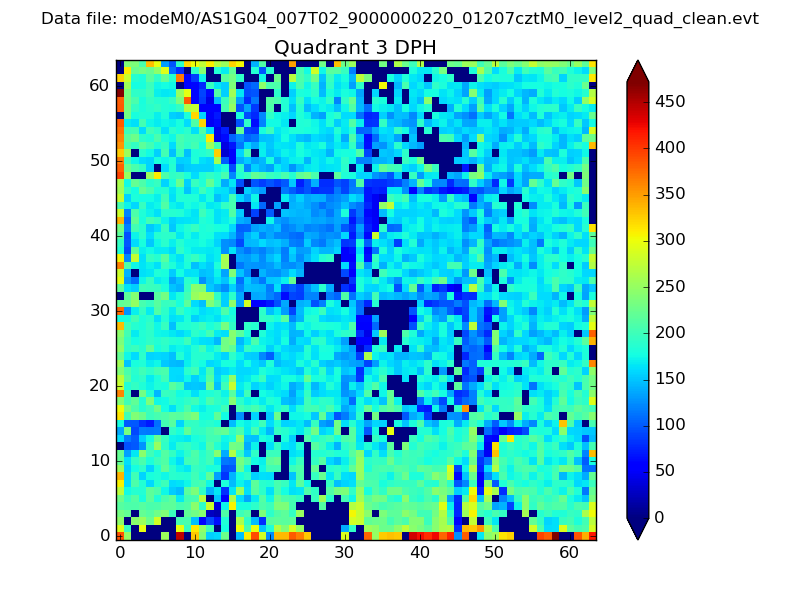 |
 |
Quadrant C |
| Plot type | Count rate plots | Images |
|---|---|---|
| Comparison with Poisson distribution Blue bars denote a histogram of data divided into 1 sec bins. Red curve is a Poisson curve with rate = median count rate of data. |
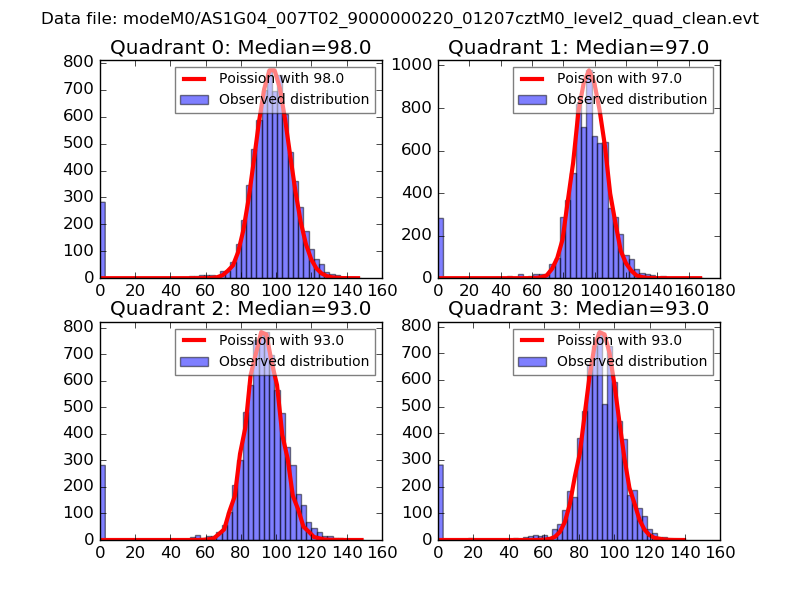 |
 |
| Quadrant-wise count rates Data is divided into 100 sec bins |
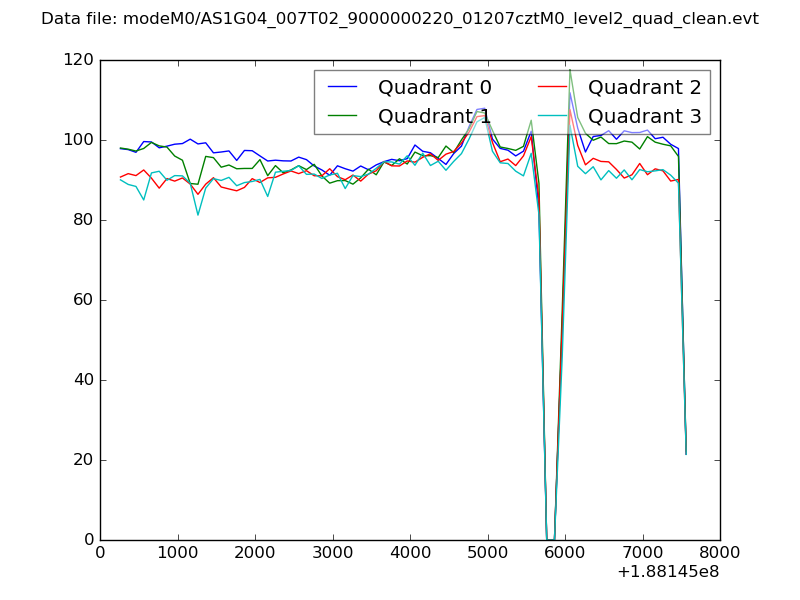 |
|
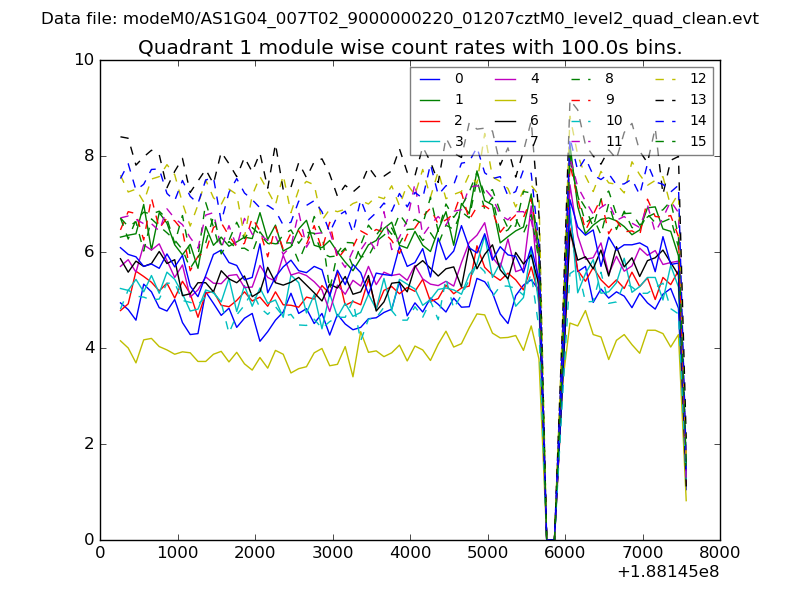
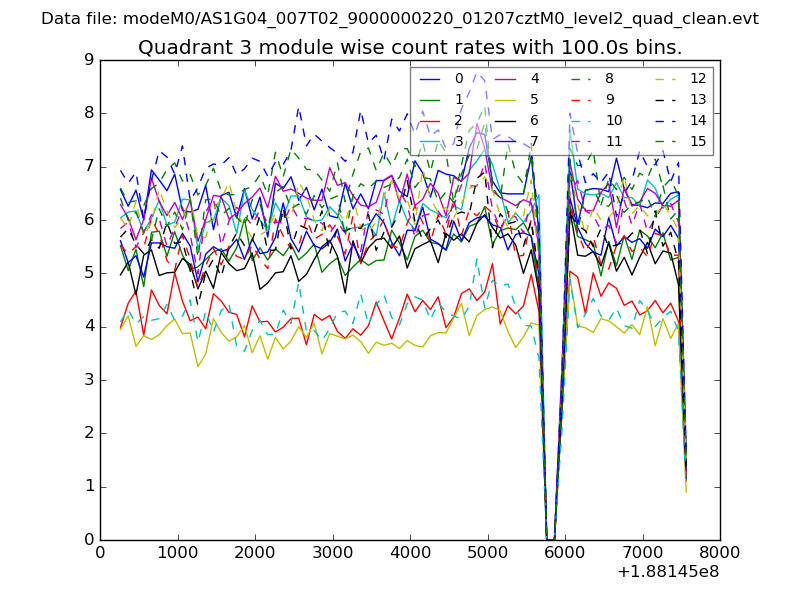
| Module-wise count rates for Quadrant A Data is divided into 100 sec bins |
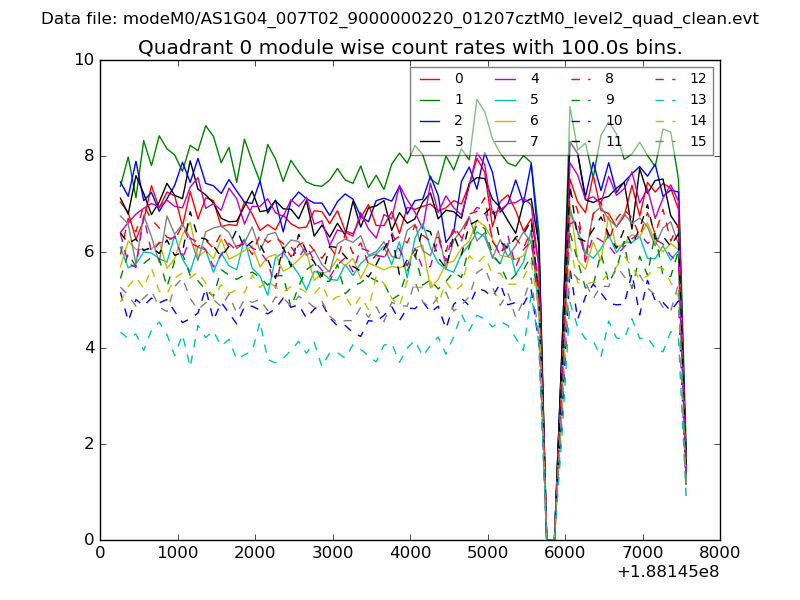 |
 |
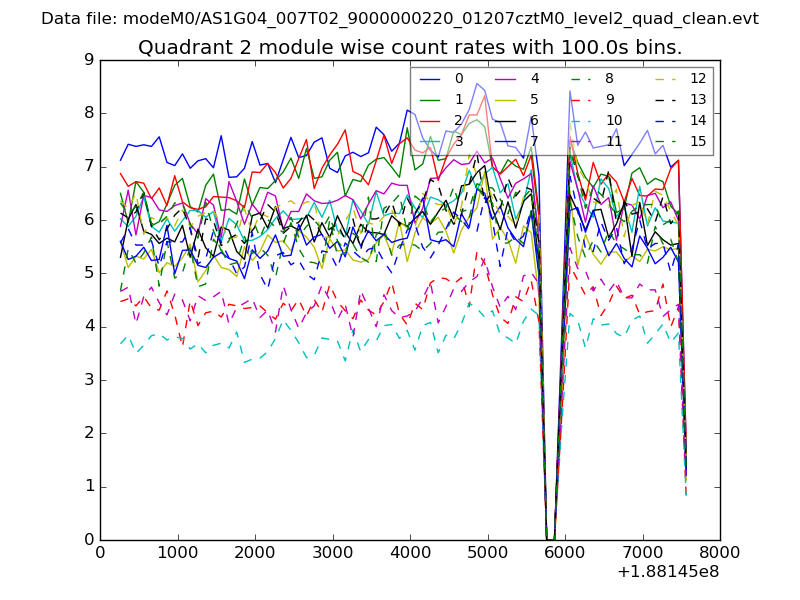
| Module-wise count rates for Quadrant B Data is divided into 100 sec bins |
 |
 |
| Module-wise count rates for Quadrant C Data is divided into 100 sec bins |
 |
 |
| Module-wise count rates for Quadrant D Data is divided into 100 sec bins |
 |
 |
| Parameter | Plot |
|---|---|
| CZT HV Monitor | 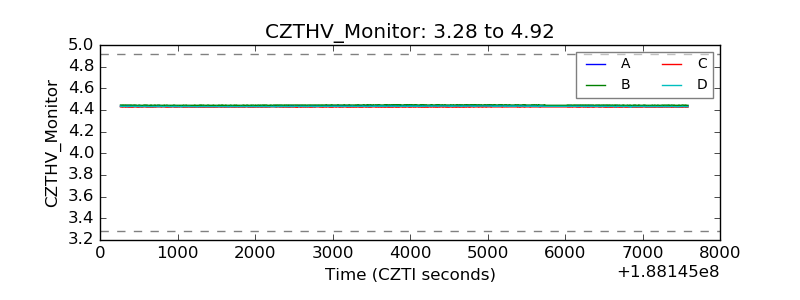 |
| D_VDD | 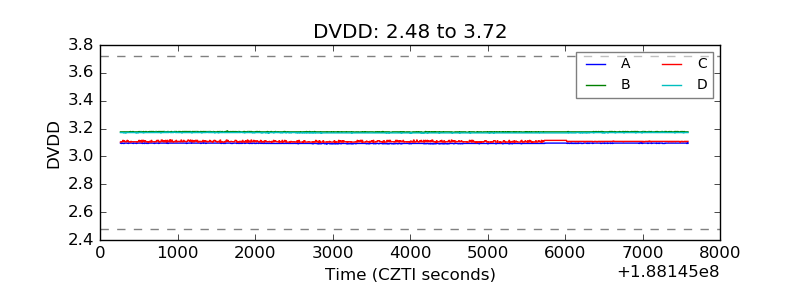 |
| Temperature 1 | 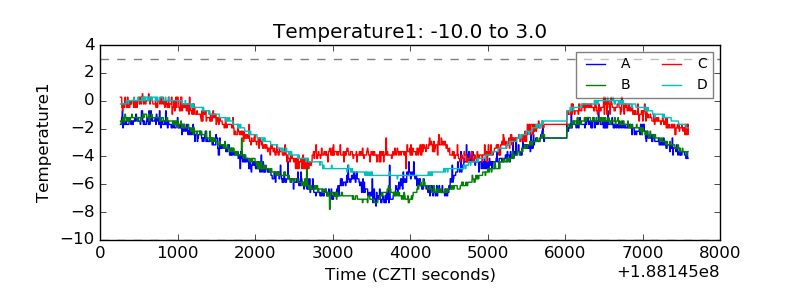 |
| Veto HV Monitor | 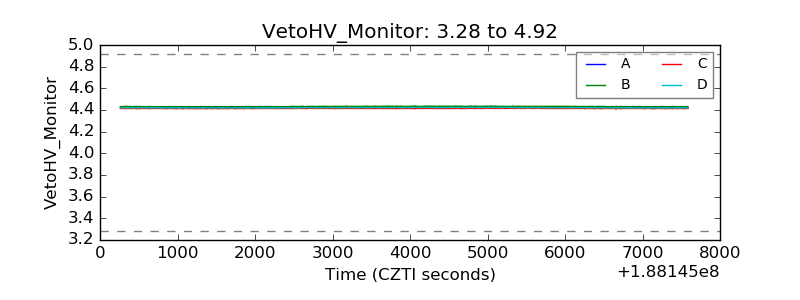 |
| Veto LLD | 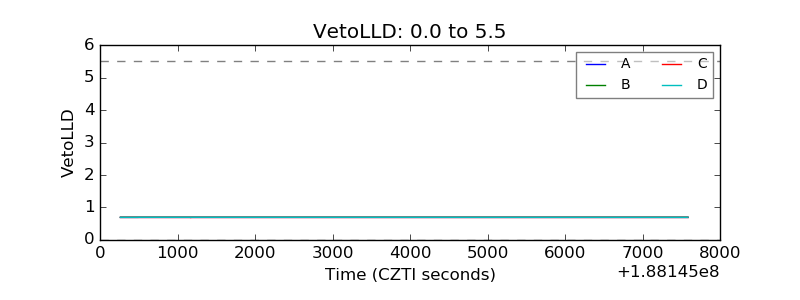 |
| Alpha Counter | 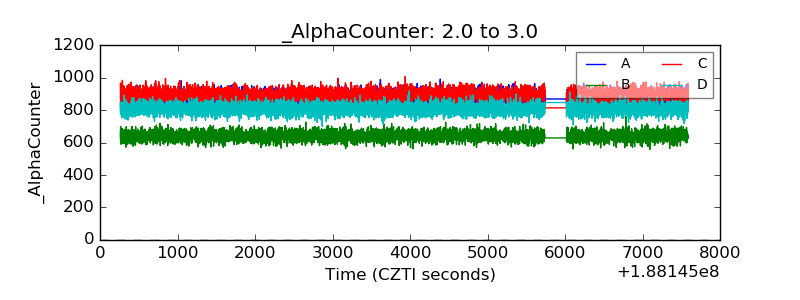 |
| _CPM_Rate | 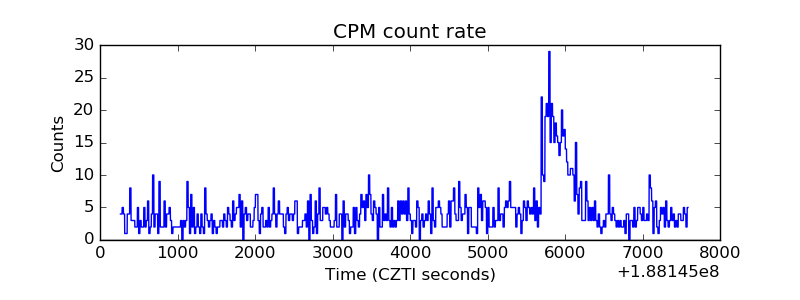 |
| CZT Counter | 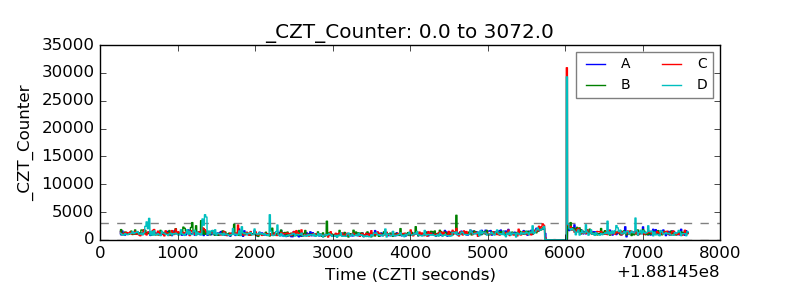 |
| +2.5 Volts monitor |  |
| +5 Volts monitor |  |
| _ROLL_ROT | 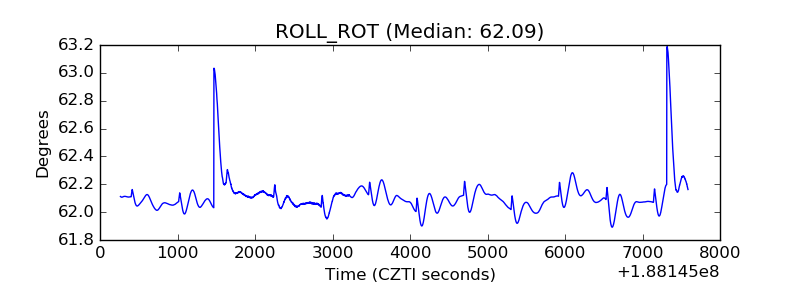 |
| _Roll_DEC | 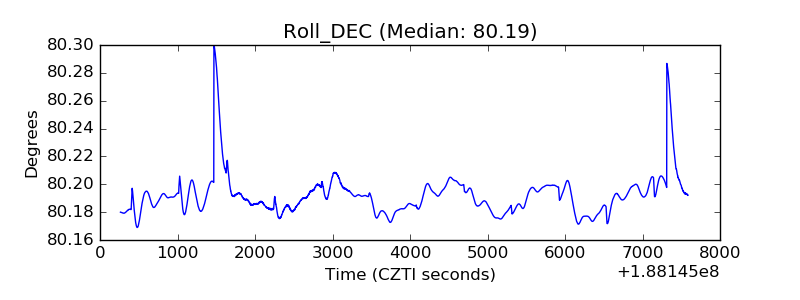 |
| _Roll_RA | 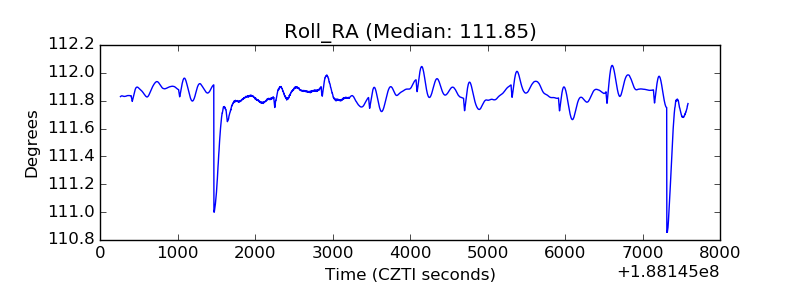 |
| Veto Counter | 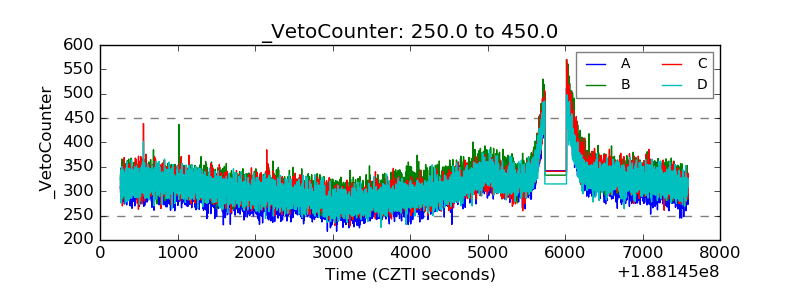 |