| Param | Original file | Final file |
|---|---|---|
| Filename | modeM0/AS1G04_007T02_9000000220_01209cztM0_level2.evt | modeM0/AS1G04_007T02_9000000220_01209cztM0_level2_quad_clean.evt |
| Size (bytes) | 1,085,132,160 | 99,904,320 |
| Size | 1.0 GB | 95.3 MB |
| Events in quadrant A | 7,985,134 | 654,129 |
| Events in quadrant B | 8,258,385 | 649,848 |
| Events in quadrant C | 8,056,701 | 632,976 |
| Events in quadrant D | 8,119,601 | 622,202 |
| Mode M9 | |||
|---|---|---|---|
| Quadrant | BADHDUFLAG | Total packets | Discarded packets |
| A | 0 | 7 | 0 |
| B | 0 | 7 | 0 |
| C | 0 | 7 | 0 |
| D | 0 | 7 | 0 |
| Mode M0 | |||
|---|---|---|---|
| Quadrant | BADHDUFLAG | Total packets | Discarded packets |
| A | 0 | 28443 | 2 |
| B | 0 | 29271 | 1 |
| C | 0 | 28714 | 1 |
| D | 0 | 28903 | 1 |
| Mode SS | |||
|---|---|---|---|
| Quadrant | BADHDUFLAG | Total packets | Discarded packets |
| A | 0 | 136 | 0 |
| B | 0 | 136 | 0 |
| C | 0 | 136 | 0 |
| D | 0 | 136 | 0 |
| Quadrant | Total seconds | Saturated seconds | Saturation percentage |
|---|---|---|---|
| A | 6690 | 11 | 0.164425% |
| B | 6690 | 21 | 0.313901% |
| C | 6690 | 22 | 0.328849% |
| D | 6690 | 86 | 1.285501% |
Noise dominated data is calculated using 1-second bins in cleaned event files. If a bin has >2000 counts, and if more than 50% of those come from <1% of pixels, then it is considered to be noise-dominated and hence unusable.
| Quadrant | # 1 sec bins | Bins with >0 counts | Bins with >2000 counts | High rate bins dominated by noise | Noise dominated (total time) | Noise dominated (detector-on time) | Marked lightcurve |
|---|---|---|---|---|---|---|---|
| A | 7390 | 6690 | 199 | 199 | 2.69% | 2.97% | 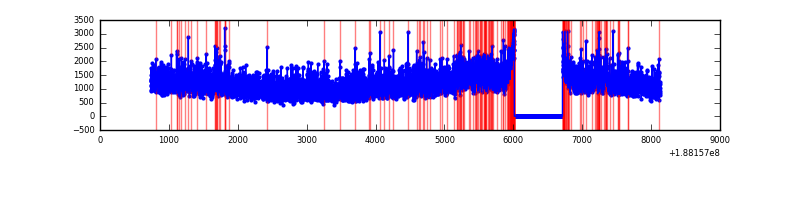 |
| B | 7390 | 6690 | 212 | 212 | 2.87% | 3.17% | 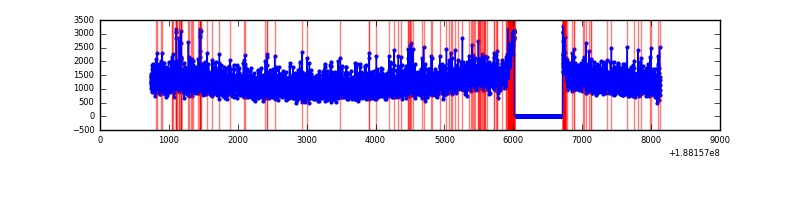 |
| C | 7390 | 6690 | 175 | 175 | 2.37% | 2.62% | 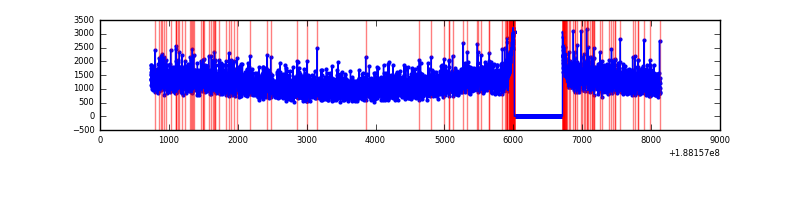 |
| D | 7390 | 6690 | 333 | 333 | 4.51% | 4.98% | 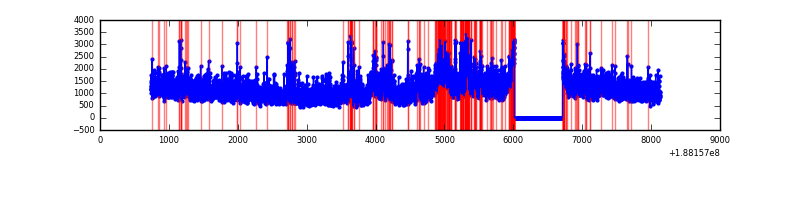 |
Top three noisy pixels from each quadrant. If the there are fewer than three noisy pixels in the level2.evt file, extra rows are filled as -1
| Pixel properties | Quadrant properties | ||||||
|---|---|---|---|---|---|---|---|
| Quadrant | DetID | PixID | Counts | Sigma | Mean | Median | Sigma |
| A | 8 | 14 | 68717 | 136.29 | 2033 | 2052 | 489.2 |
| A | 12 | 243 | 49507 | 97.01 | 2033 | 2052 | 489.2 |
| A | 13 | 34 | 22388 | 41.57 | 2033 | 2052 | 489.2 |
| B | 15 | 22 | 54310 | 104.08 | 2132 | 2138 | 501.3 |
| B | 14 | 3 | 35353 | 66.26 | 2132 | 2138 | 501.3 |
| B | 15 | 255 | 20106 | 35.85 | 2132 | 2138 | 501.3 |
| C | 15 | 241 | 349488 | 636.08 | 1957 | 2026 | 546.3 |
| C | 3 | 111 | 30903 | 52.86 | 1957 | 2026 | 546.3 |
| C | 3 | 79 | 29416 | 50.14 | 1957 | 2026 | 546.3 |
| D | 1 | 83 | 413416 | 697.17 | 1889 | 1959 | 590.2 |
| D | 10 | 84 | 401429 | 676.86 | 1889 | 1959 | 590.2 |
| D | 1 | 239 | 111660 | 185.88 | 1889 | 1959 | 590.2 |
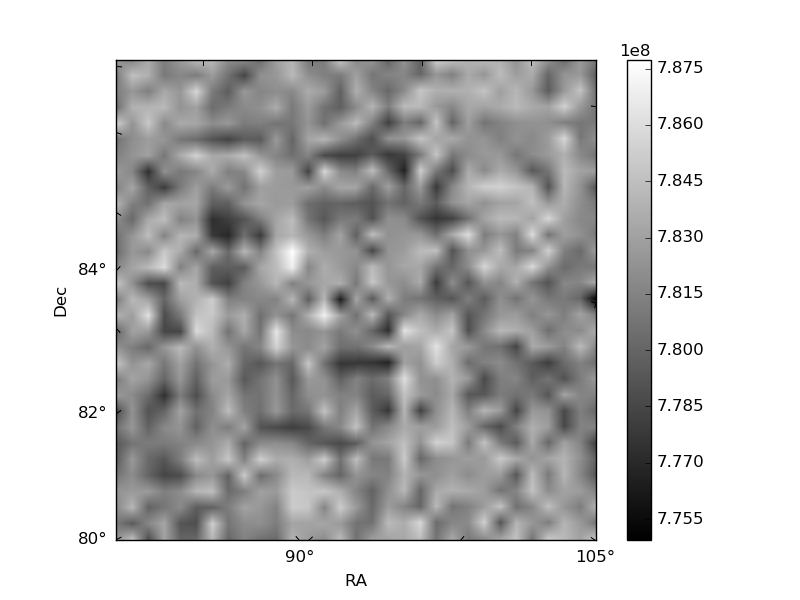
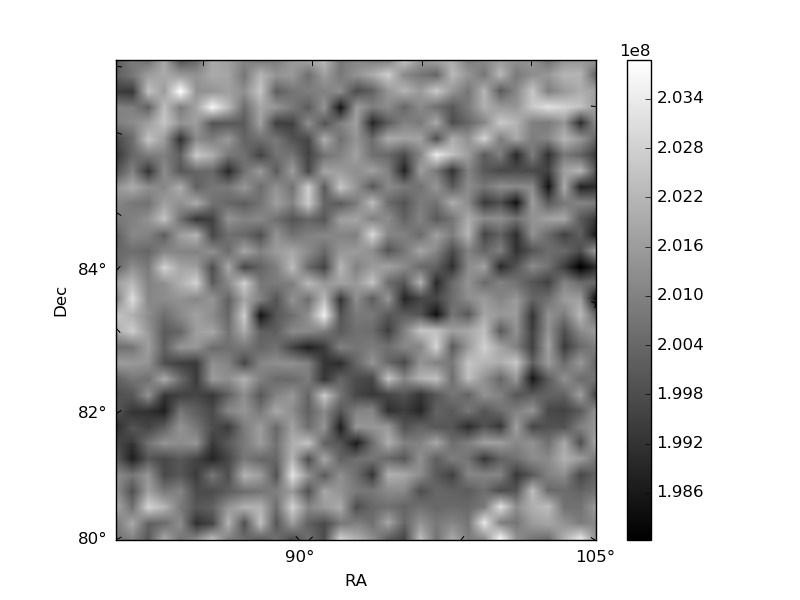
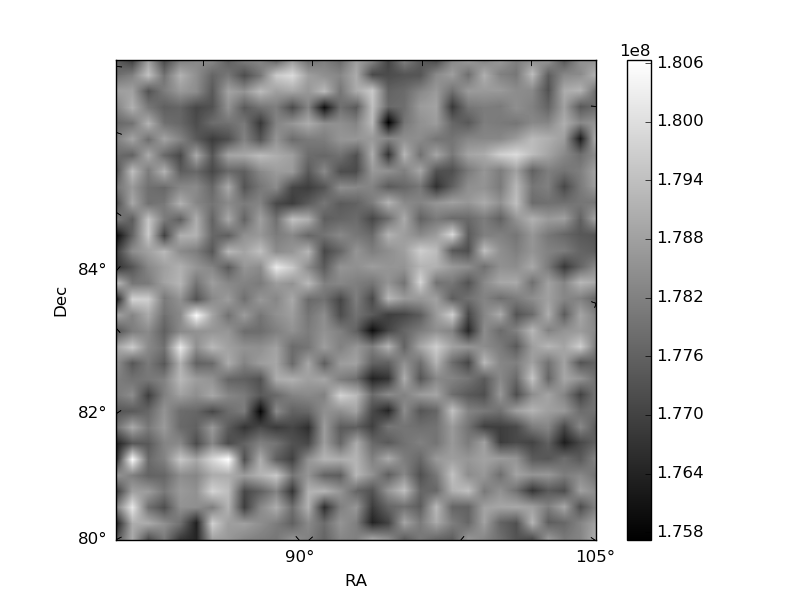
Histogram calculated using DETX and DETY for each event in the final _common_clean file
| Quadrant A | 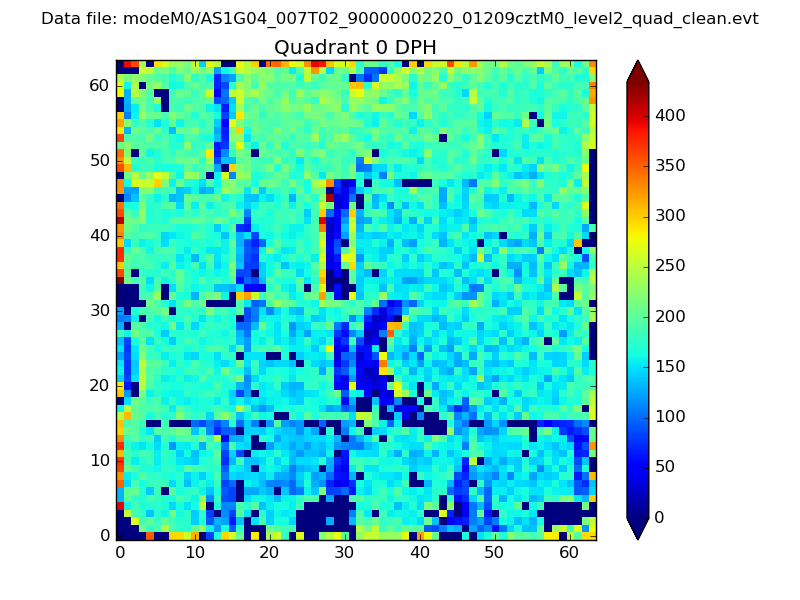 |
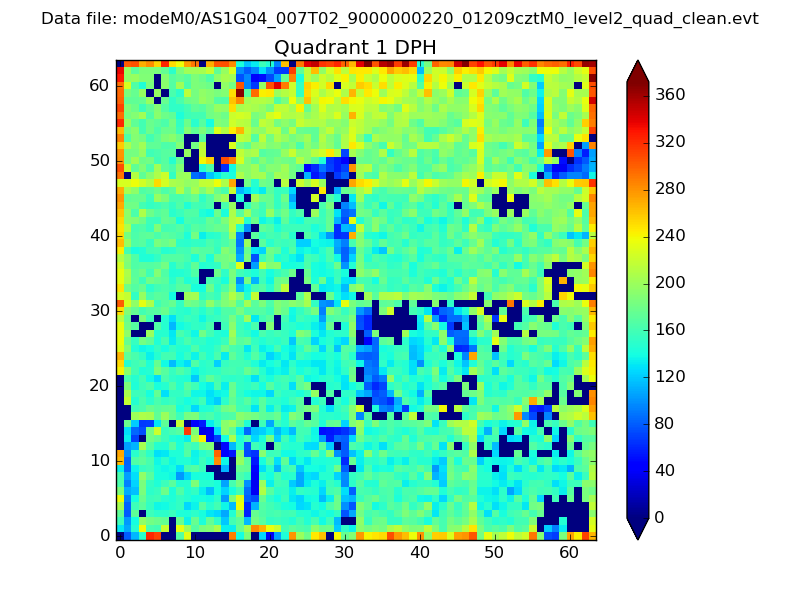 |
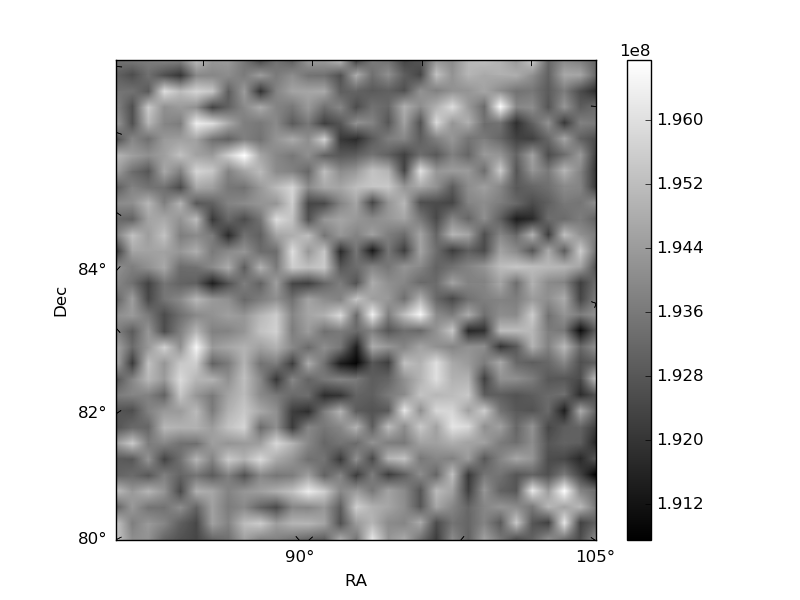
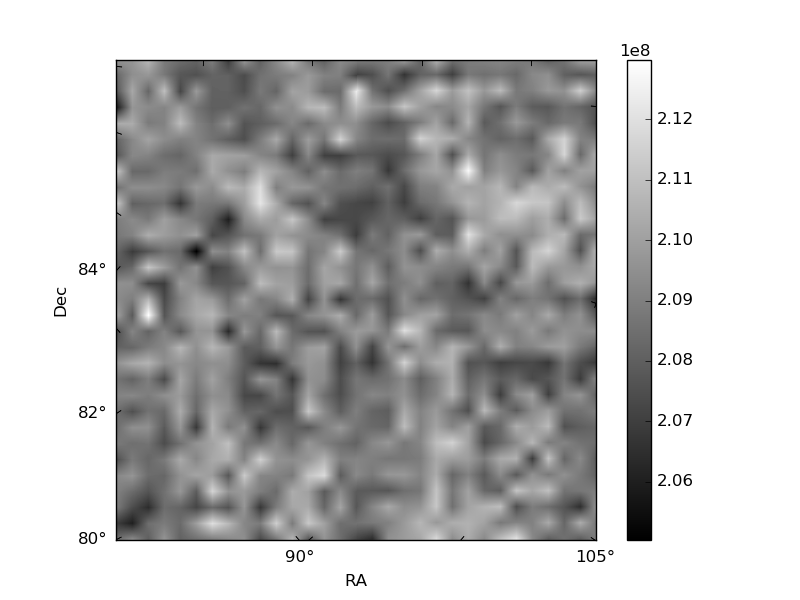
Quadrant B |
|---|---|---|---|
| Quadrant D | 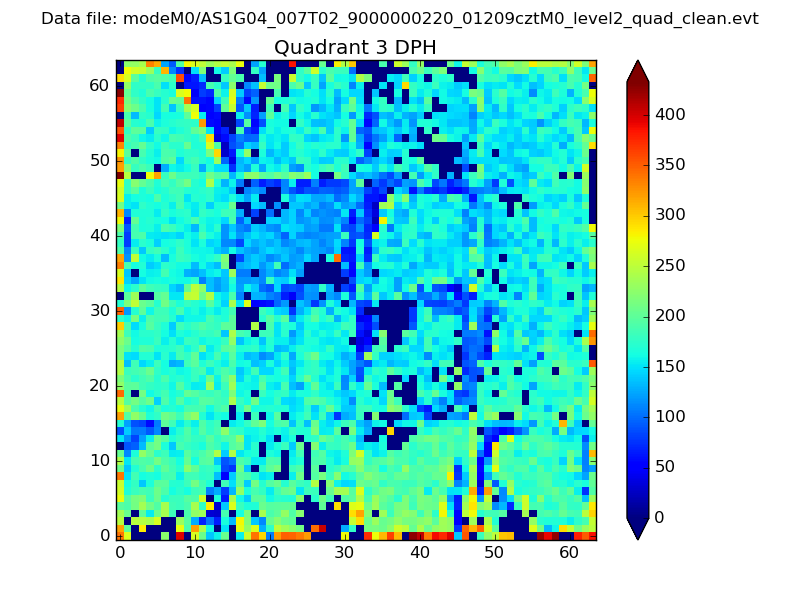 |
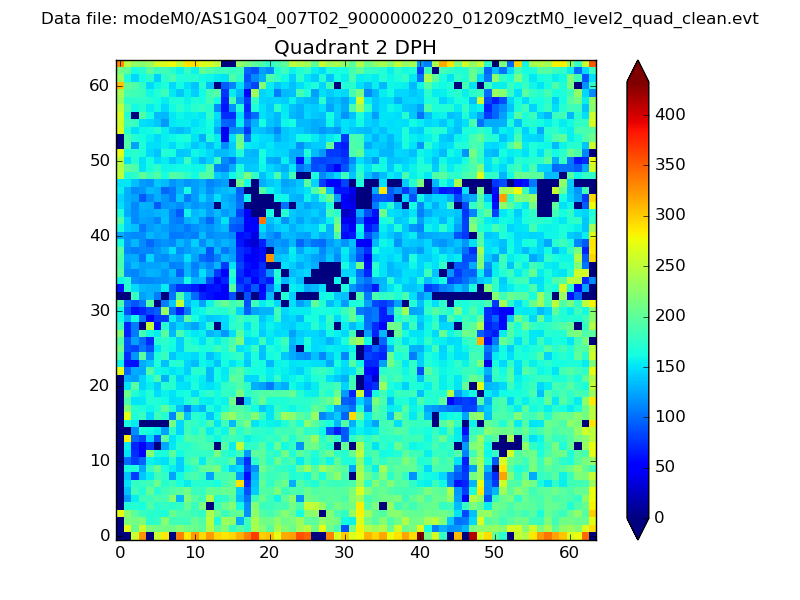 |
Quadrant C |
| Plot type | Count rate plots | Images |
|---|---|---|
| Comparison with Poisson distribution Blue bars denote a histogram of data divided into 1 sec bins. Red curve is a Poisson curve with rate = median count rate of data. |
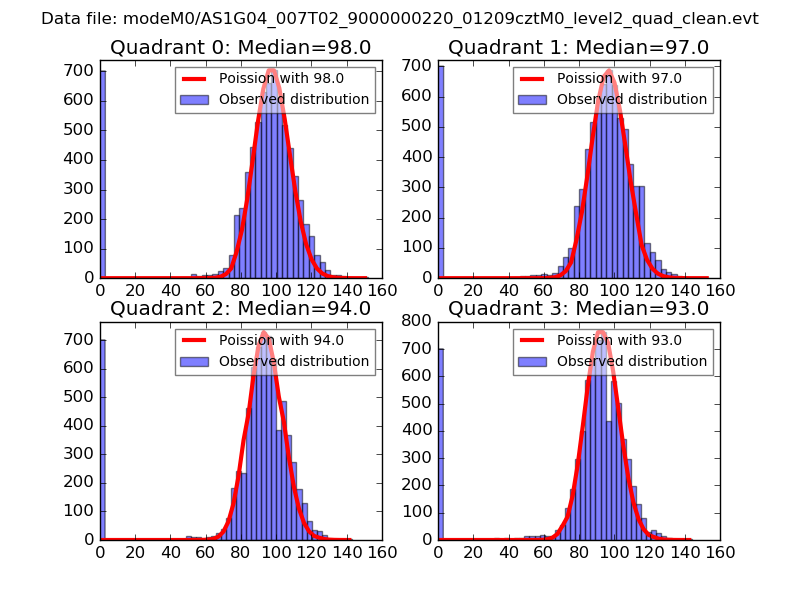 |
 |
| Quadrant-wise count rates Data is divided into 100 sec bins |
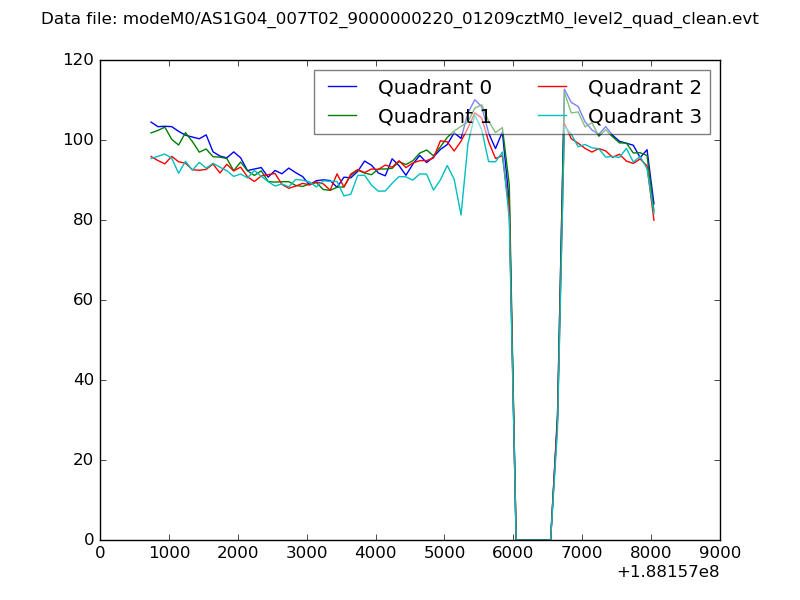 |
|
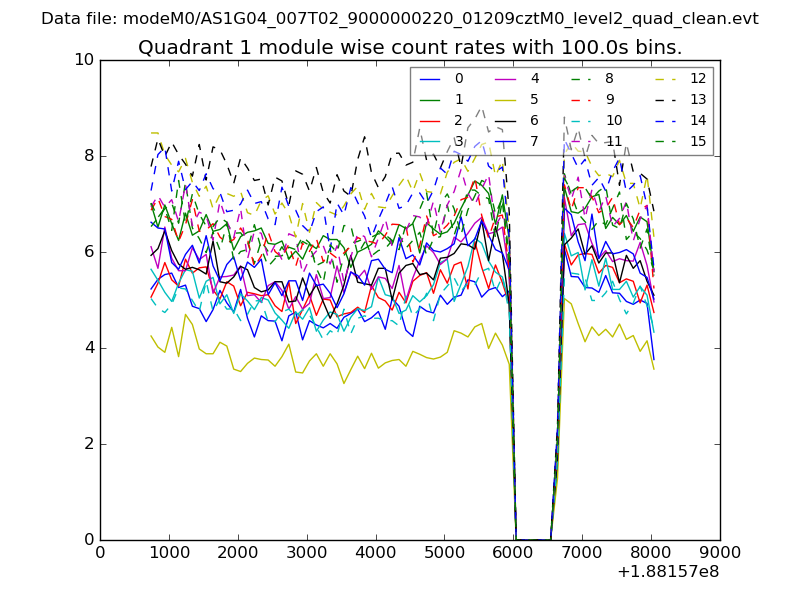
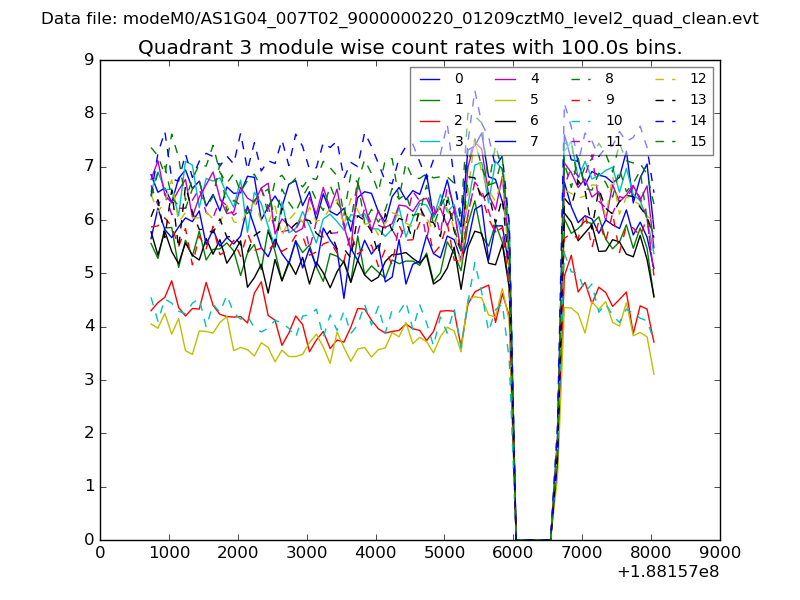
| Module-wise count rates for Quadrant A Data is divided into 100 sec bins |
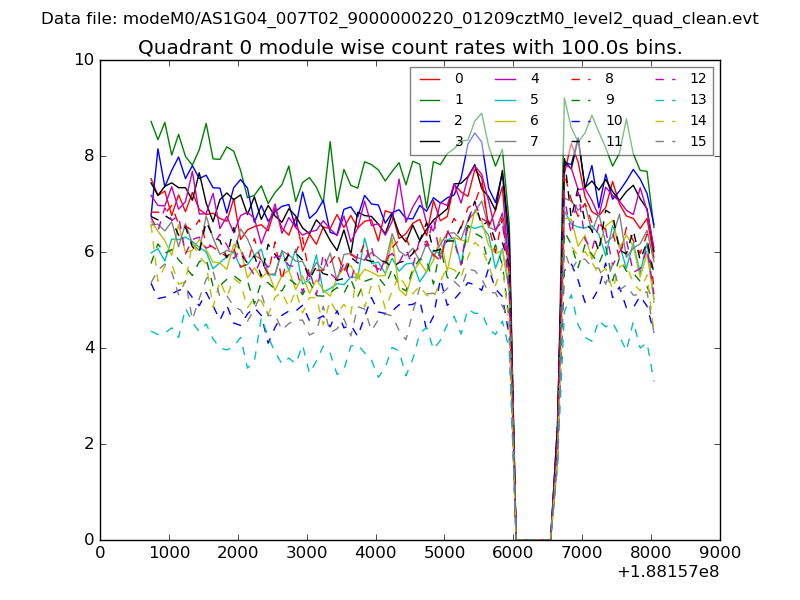 |
 |
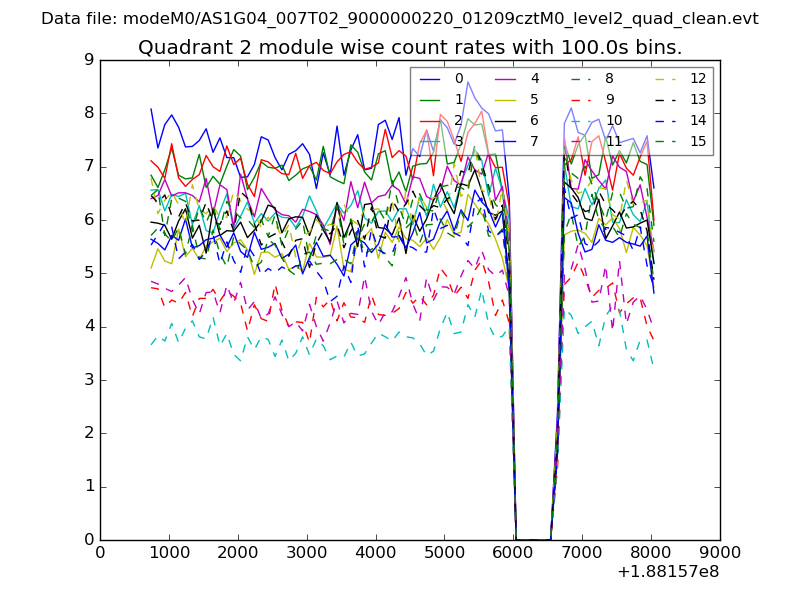
| Module-wise count rates for Quadrant B Data is divided into 100 sec bins |
 |
 |
| Module-wise count rates for Quadrant C Data is divided into 100 sec bins |
 |
 |
| Module-wise count rates for Quadrant D Data is divided into 100 sec bins |
 |
 |
| Parameter | Plot |
|---|---|
| CZT HV Monitor | 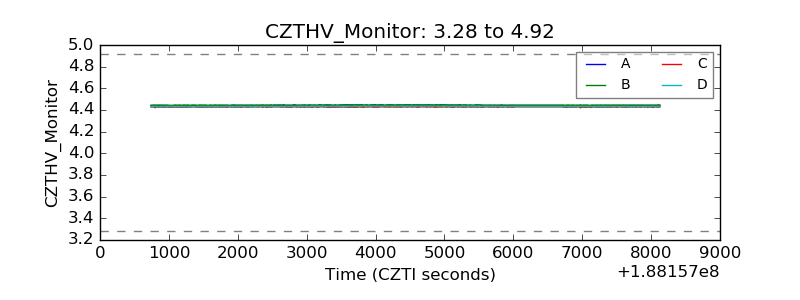 |
| D_VDD | 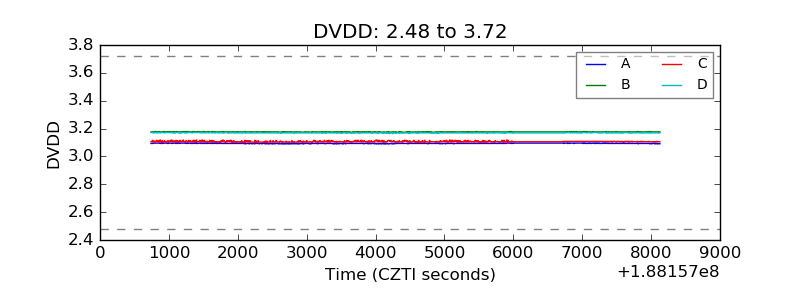 |
| Temperature 1 | 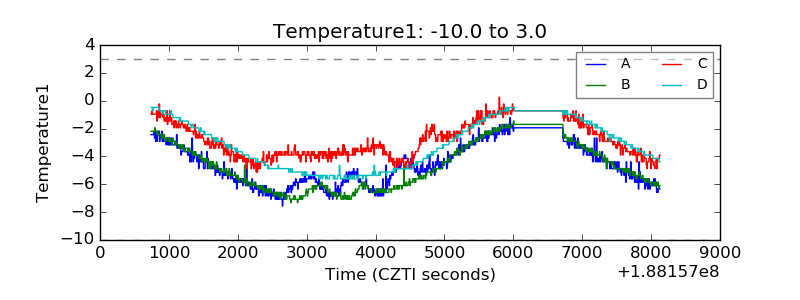 |
| Veto HV Monitor |  |
| Veto LLD | 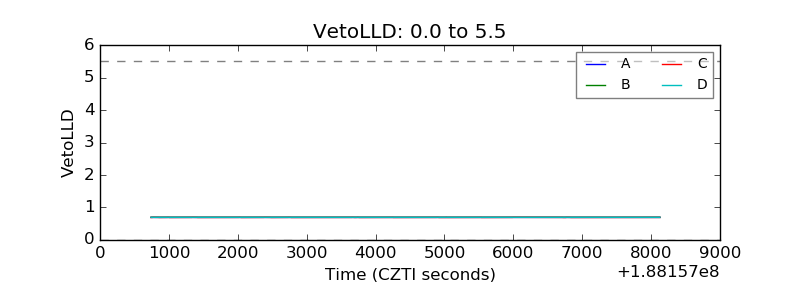 |
| Alpha Counter | 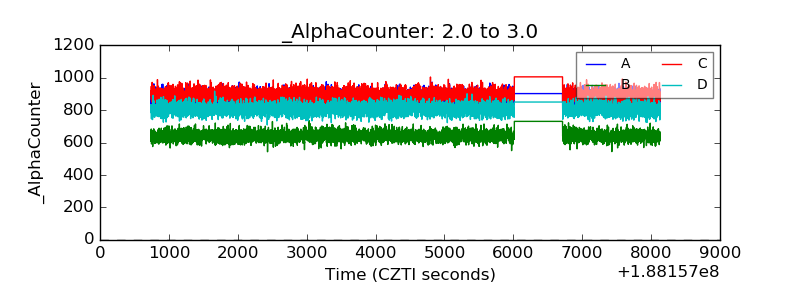 |
| _CPM_Rate | 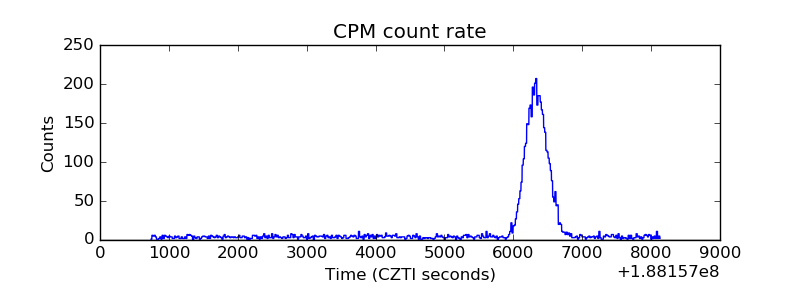 |
| CZT Counter | 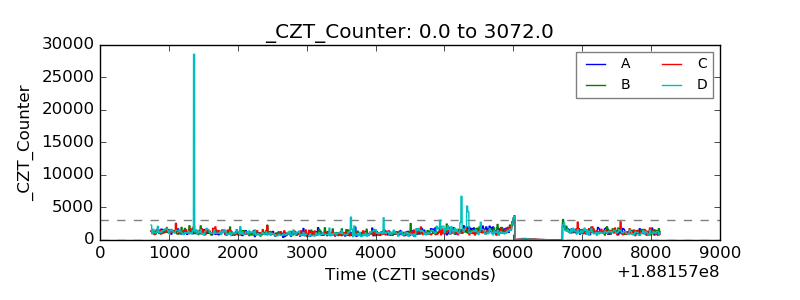 |
| +2.5 Volts monitor |  |
| +5 Volts monitor |  |
| _ROLL_ROT | 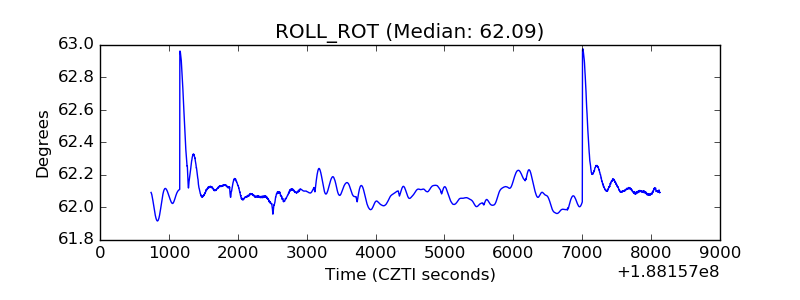 |
| _Roll_DEC | 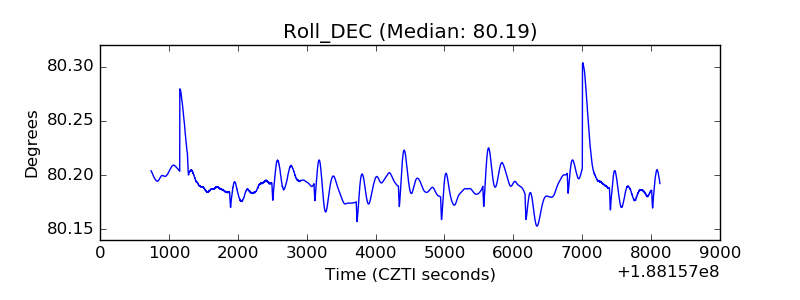 |
| _Roll_RA | 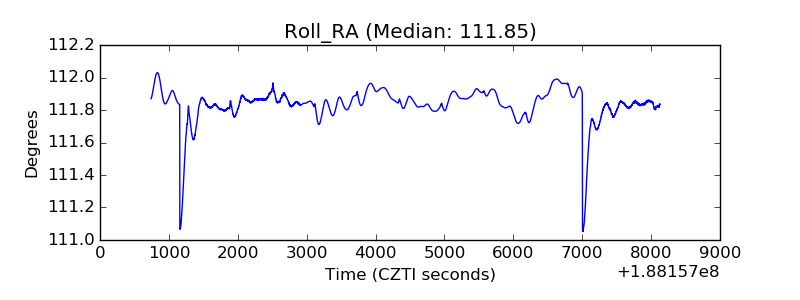 |
| Veto Counter | 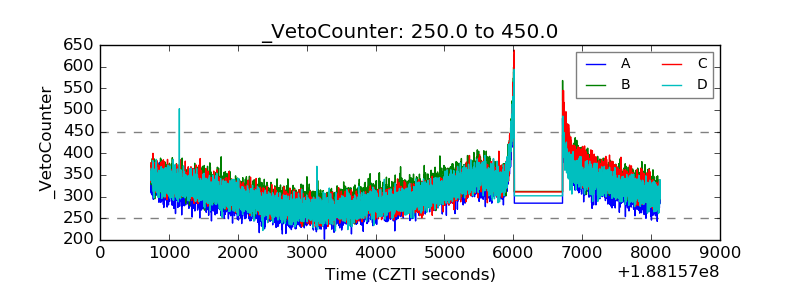 |